Reports
In PFLB Platform, you can generate a report with the results of load testing. You can create the report yourself in the built-in editor or generate it using artificial intelligence.
The report may include:
other blocks such as headers, lists, images.
Generate AI reports
Go to the Reports page and click + AI Report. The dialog opens:
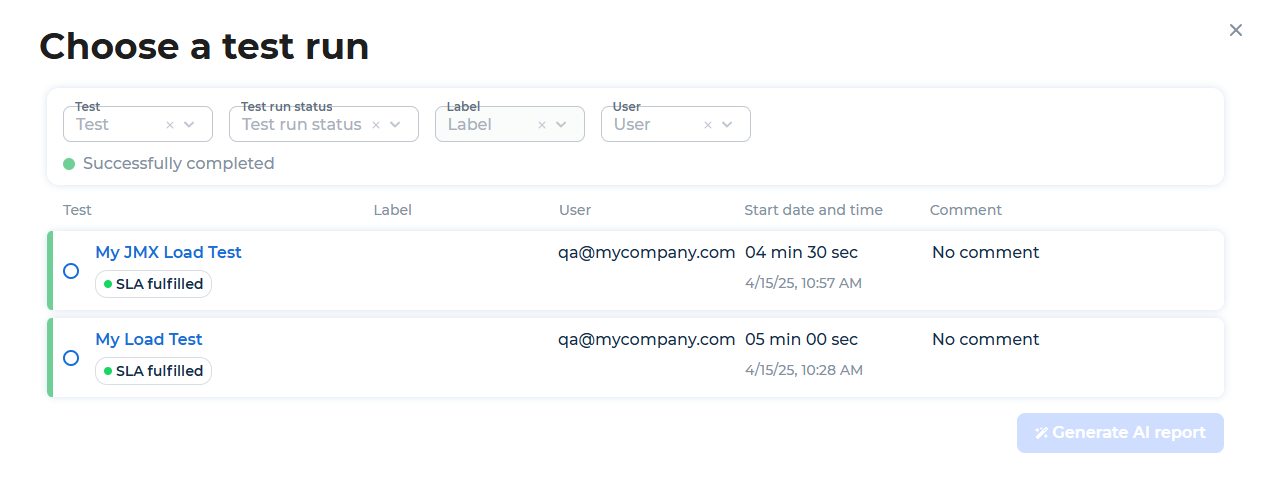
Choose the test run for which you want to generate a report. You can filter a list of the test runs by Test name, Test run status, Label, or User.
Click Generate AI report. The report is generated after some time.
Optional: Edit the generated report.
The AI report is created with the AI Report for Test Run: <Test Run ID> name.
Create a report
Go to the Reports page and click + Add new report.
In the Report name field, enter the name of the report.
Click
 and add the required content blocks to the report.
Click Save.
Report creation tools
In PFLB Platform, you can add different content blocks to the report page and customize them with tools:
- button. Appears in the left margin whenever you hover over a new line of the report. Allows you to add to the report:
Text. Regular plain text.
Heading. The heading of the report.
Image.
List. A bulleted or numbered list.
Table.
PFLB Table of contents. Report table of contents.
PFLB chart. A chart that displays metrics from one or more test runs. The chart is automatically plotted according to the specified parameters and when data is available.
PFLB table contains SLA metrics values per request, test or transaction. The table is automatically plotted according to the specified parameters and when data is available.
 Action menu. Appears in the left margin whenever you hover over a content block or new line. Contains actions:
Action
Description
Available for content blocks
Copy link to block
Copies a link to a report block
For all
Move up
Moves the content block up
For all
Delete
Deletes the content block
For all
Moves the content block down
Moves the content block down
For all
Heading 1
Sets the first level heading
Heading
Heading 2
Sets the second level heading
Heading
Heading 3
Sets the third level heading
Heading
Heading 4
Sets the fourth level heading
Heading
With border
Adds a border around an image
Image
Stretch image
Stretches an image to page width
Image
With background
Adds a background to an image
Image
Unordered
Creates a bulleted list
List
Ordered
Creates a numbered list
List
With headings
Marks a row as a header row (shaded with bold text)
Table, PFLB table
Without headings
Unmarks a row as a header row
Table, PFLB table
Refresh
Refreshes a report table of contents
PFLB Table of contents
Chart params
Opens the PFLB chart settings
PFLB chart
Table params
Opens the PFLB table settings
PFLB table
/commands. To quickly add content to the report, type/and any type of block.
Text editing
For the Text, Heading, List, Table, PFLB table blocks, you can change the text style:
Highlight any text. The editing menu appears:

Click on the one of the buttons:
 makes the text bold.
 makes the text italic.
 underlines the text.
 highlights the text.
You can convert the Text, Heading, List blocks into each other. For example, to convert text into another element, follow these steps:
Highlight the Text block. The menu appears:
Click
 and select Heading or List.
Insert an external link
To insert an external link into the Text, Heading, List, Table*, and **PFLB table blocks, follow these steps:
Highlight any text. The editing menu appears:
Click
 .
.Enter the URL and press Enter.
To follow an external link, hold down Ctrl and click the link.
To delete an external link, highlight the text and click  .
.
Insert a cross-link
To insert a cross-link to a report block, follow these steps:
Hover over a block. The
button appears.Click
and select Copy link to block.Highlight the text you want to convert to a link in one of the following blocks: Text, Heading, List, Table, or PFLB table. The menu appears:
Click
and insert the copied link to the block.Press Enter.
To insert a cross-link to some text in a report block, follow these steps:
Highlight some text in one of the blocks: Text, Heading, List, Table, or PFLB table. The menu appears:
Click
 and enter the block ID:
Copy the block ID and press Enter. The anchor is emphasized with a dotted line.
Highlight the text you want to convert to a link in one of the following blocks: Text, Heading, List, Table, or PFLB table. The menu appears:
Click
and insert the copied ID.Press Enter.
To follow a cross-link, click the link.
To delete the anchor, highlight the text and click  .
.
To delete the cross-link, highlight the text and click .
Insert a report table of contents
Table of contents is built based on the headings in the report.
To add the table of contents, follow these steps:
Hover over a new line. The
button appears in the left margin.Click
and select PFLB Table of contents.
After adding new headings, update the table of contents:
Hover over the PFLB Table of contents.
Click
and select Refresh.
Create a PFLB chart
PFLB chart is a chart for comparing metrics of several test runs.
You can add different types of graphs to the report:
Load Profile. Displays the actual and planned number of virtual users.
System Metrics. Displays data on the system metrics of the testing system, such as CPU, disk and RAM utilization.
Test Metrics. Displays average response time, number of requests, hits, errors per second, 95% response time.
Transaction Metrics. Displays average transaction time, 95% response time, number of transactions and errors per second.
To add the PFLB chart to the report, follow these steps:
Hover over a new line. The
button appears in the left margin.Click
and select PFLB chart.Click
 . The settings of the PFLB chart open.
Click + Add new measure. The chart settings open:

Select the test run ID. To find the test run ID, follow these steps:
Go to the Test runs page.
Select the test run. You can find the test run ID in the address bar:

Select the chart type and configure it:
Load Profile

Select the metric type:
Actual, number of vusers
Planned, number of vusers
Select the aggregation interval.
System Metric

Note
To display data in a graph with system metrics before running a test, follow these steps:
Enter the host name of the testing system.
Select the metric type:
CPU utilization in percent, %
CPU utilization per CPU percent, %
Disk total in megabytes, Mb
Disk utilization in megabytes, Mb
Disk utilization in percent, %
Ram total in megabytes, Mb
Ram utilization in megabytes, Mb
Ram utilization in percent, %
System load average, %
Select the aggregation interval.
Test Metric

Select the metric type:
Average response time, seconds. Average system response time to a request or transaction.
Error per second, eps. Errors are calculated only when executing all requests, excluding transactions.
Hits per second, hps. Number of system hits during each second of the test.
95% response time, seconds. The value which is greater than 95% of response time for the test.
Requests per second, rps. Number of requests sent per second.
Select the aggregation interval.
Transaction Metric

Select the transaction and group.
Select the metric type:
Average transaction time, seconds. Average system response time to transaction.
95% transaction time, seconds. The value which is greater than 95% of response time for the transaction.
Transaction errors per second, teps. Errors are calculated only when executing a transaction, excluding requests.
Transactions per second, tps. The number of transactions sent per second.
Select the aggregation interval.
Click Apply.
Optional: Add captions to the axes of the graph.
The PFLB chart example:

If needed, change the values on which the graphs are based:
Expand the common settings for the chart:

Select the values for the left and right Y-axis from the drop-down lists.
Note
If, when changing the value for the left or right Y-axis, the unit of measurement on which the graphs were based has changed, then open the settings of the necessary graphs and select the axis.
To delete the chart, click  .
.
Create a PFLB table
PFLB table contains SLA metrics values per request, test or transaction.
To add PFLB table to the report, follow these steps:
Hover over a new line. The
button appears in the left margin.Click
and select PFLB table.Click
. The settings of the PFLB table open.Select the test run ID. To find the test run ID, follow these steps:
Go to the Test runs page.
Select the test run. You can find the test run ID in the address bar:
Select the table type:
Click Apply.
Optional: Edit the column headings.
The PFLB table example:

See also
Insert an image
To add the image to the report, follow these steps:
Hover over a new line. The
button appears in the left margin.Click
and select Image.Select the file of the image.
Optional: In the Caption field, add captions to the image.
Edit a table
To add a column, click to the right of the table or click  above the column and select the menu item:
Add column to left
Add column to right
To add a row, click below the table or click to the left of the row and select the menu item:
Add row above
Add row below
To delete a column or row, click and select Delete column or Delete row.
Paste data from spreadsheet editors
You can paste data from a spreadsheet editor, such as Microsoft Excel, into your report. We recommend that you copy a table with no more than 10 columns.
Note the following limitations when copying data:
Only text data is copied. Formulas, functions, and cross-references are not supported in report editor.
Text and cell background colors aren’t supported.
Merged cells aren’t supported.
Edit the report
Go to the Reports page and click
 for the required report.
Add or edit the report blocks.
Click Save.
Add labels to the report
Labels allow you to specify important information and highlight the report in the list.
To add labels, follow these steps:
Go to the Reports page:

For the required report, click No labels + or + next to the label already added.
Enter the name of the label and click
 .
.
Export a report as PDF
Go to the Reports page and click
for the required report.Use a keyboard shortcut:
Windows and Linux: Ctrl+P
Mac: ⌘+P
In the window that appears, select the Save as PDF printer and change your preferred print settings.
Click Save.