
AI-Driven Website Load Testing: a step-by-step guide for QA engineers using Claude and PFLB’s MCP server
 By Yuri KovalovYuri Kovalov · Founder and CEO, PFLB. An MBA and Stanford University-certified technical entrepreneur with over 20 years in performance testing. Founded Performance Lab in 2008, a performance testing company with over 150 engineers, and PFLB in 2022., August 19, 2026
 Reviewed by Vik KuvshinovVik Kuvshinov · Senior Product Manager, PFLB. Engineering manager with over 20 years in performance testing; former HP Enterprise Architect specializing in LoadRunner-based solutions.
Black Friday is a few weeks out. Marketing says 1,200 shoppers will be on the site at once. Nobody on the team has ever written a load test.
Until recently, that last sentence would have been the end of the story: you either hired a performance engineer or crossed your fingers. What has changed is that AI now covers the two skills that kept load testing out of reach for most QA teams — turning functional test cases into a working JMeter script, and reading the results afterwards. You still make the decisions. The machine does the parts that used to take years to learn.
This article walks through one complete, honest experiment from start to finish: a real store, a real requirement, a real 95-minute test with 2,200 virtual users, and a real answer to the question “are we ready?” (spoiler: not yet — and we can show you exactly why). Read it once, and you will be able to run the same test on your own staging site this week.
The short version
- The task: get bench.pflb.us ready for a Black Friday peak of 1,200 concurrent shoppers. On hand: four functional test cases and access to staging. Nothing else.
- AI built the whole test from the case files: recorded the flows, correlated the tokens, wired in the data files, validated gently, and shipped three JMeter plans.
- The 95-minute staircase run — 600 → 1,200 → 2,200 → 600 users — told a four-act story: comfortable at 600, too slow to pass the requirements at 1,200, one-third errors at 2,200 — and fully recovered within three minutes of the spike ending.
- The verdict: not ready. Checkout p95 hit 3.7–5.0 s against a 3.5 s target, with the host CPU at 83%. The bottleneck is the PHP tier running out of CPU — confirmed by an AI report that correlated response times with ten Datadog metrics.
- Total effort: one working day, no load-testing specialist, no test infrastructure of our own.
The task: a Black Friday load test, and nobody who has run one
Here is the situation, and it may sound familiar. An online store. Black Friday a few weeks away. Marketing has run its forecast and put a number on the table: 1,200 shoppers on the site at the same time at the peak. Someone in the standup asks the obvious question. Will the site hold?
Nobody knows. And the team that is expected to find out is a manual QA team. What they have is what most QA teams have: four functional test cases in a tracker — browse the catalogue, search, check out as a guest, sign in and check out — and access to a staging environment. What they do not have is any of the things load testing traditionally requires. No JMeter skills. No load generators. No performance engineer.
Until recently, this is where the story would stall. Load testing has a
reputation as a specialist discipline, and the reputation is earned: the
scripting alone takes months to learn. This article is about doing it
anyway, with three tools that fit a QA team's reality. The AI coding
assistant Claude, connected to jmx-mcp, PFLB's MCP server: it runs
from a single docker compose up on a laptop and is published,
free to run, and source-available. The PFLB platform, which
supplies cloud load generators on AWS, billed per VUser-hour, so there is
nothing to own. And Datadog's free tier for watching the server
itself.
The whole exercise, from the first prompt to a reviewed report in the development team's hands, took one working day.
Where this story comes from
The task is a fictional composite, assembled from real Black Friday readiness projects PFLB has run for clients. Everything else is real and inspectable: the store is bench.pflb.us, a stock PrestaShop 8 shop (“Sunny Sprout Kids”) that PFLB keeps running on a single 8-core host for benchmarks. The test cases, the test plans, the runs, every number in this article, and the AI report at the end all come from that store, and you can check them yourself.
The requirements: what “ready” means, in numbers a load test can check
“Will the site hold?” is not a testable question. Hold what, for how long, and how slow is too slow? Before any load is generated, the team has to turn the marketing forecast into numbers a test can pass or fail. Performance engineers call these non-functional requirements. You can think of them as acceptance criteria for speed.
The honest way to set them is to start from how the site behaves when it is comfortable, and demand that it not degrade too far from that under load. So the first measurement is a gentle one: 100 users for 20 minutes, ramping up over 2 minutes. That run produced 7,605 requests with zero errors, and this picture of the store on a calm day:
A fair question at this point: measured with what? We have not built anything yet. The honest answer is that this baseline is the smallest of the three test plans the assistant builds later in this article. We show its numbers early, out of chronological order, so that the requirements and the baseline they came from read as one piece.
The chart uses a term worth pausing on: p95. A p95 of 904 milliseconds means 95% of requests finished within 0.9 seconds, and the slowest 5% took longer. Why track the slowest 5% instead of the average? Because the slowest 5% are exactly the shoppers who give up and abandon their carts. Averages actively mislead under load: later in this test, at 1,200 users, the average page still took a pleasant 0.33 seconds while the p95 had already tripled. The average said all was well. The slowest shoppers disagreed.
From the baseline, the requirements almost write themselves: allow roughly 1.5× degradation from comfortable, round to numbers a human can remember, and add a few absolute guards. Here is what the team signed off:
- 1,200 concurrent users held for at least 20 minutes.
- Pages — home, catalogue, search, cart — p95 ≤ 1.5 s (baseline 0.6–0.95 s).
- Checkout steps — address, shipping, and so on — p95 ≤ 2 s (baseline 0.4–1.05 s).
- Placing the order: p95 ≤ 3.5 s (baseline 1.3–2.1 s).
- Errors, HTTP and application: ≤ 1% (baseline: zero).
- Server CPU in steady state ≤ 85% (baseline ≈ 38% busy).
- After an overload spike: back to baseline behavior within 10 minutes.
That CPU line raises a practical question: how will we see the server's CPU at all, if all we have is staging access? This is where Datadog's free tier comes in. Its agent goes on the host, and the free plan covers 5 hosts with one day of retention, enough for a test day. No Datadog? The platform ships its own downloadable monitoring agent, and anything that can export a plain timestamp-and-value CSV works too, as the analysis section will show.
The method: three JMeter test plans and a load staircase
With the requirements written, the team hands the problem to the assistant. Not a specification — a goal. The exact prompt appears in the next section, and it says, in essence: here is our store's URL, here are our test cases and test data, marketing expects 1,200 shoppers at once, find out whether we survive. What comes back is a method. The assistant proposes three test plans: the small baseline you have already seen, a short rehearsal, and the main event, a 95-minute staircase. The team's job is not to design any of this, but to check that the plan makes business sense.
The first thing to check is who those 1,200 users are. Sending 1,200 shoppers straight to checkout would be nonsense; on a real Black Friday most visitors just browse. The shape of the crowd comes from the store's own web analytics for an ordinary day: 55% of sessions browse the catalogue, 16% search, 16% sign in and buy, 13% buy as guests. Applied to the forecast, the model looks like this:
| Business process | Share of sessions | Users at 1,200 | Users at 2,200 |
|---|---|---|---|
| Browse the catalogue | 55% | 652 | 1,195 |
| Search | 16% | 198 | 363 |
| Sign in and buy | 16% | 190 | 348 |
| Buy as a guest | 13% | 160 | 294 |
| Total | 100% | 1,200 | 2,200 |
The second column of that table is why the four functional test cases matter so much: each business process in the model is one of the recorded flows, in exactly these proportions.
The next honesty check is pacing. Real shoppers do not click continuously. The same analytics show an average session of about 7 minutes across about 10 pages — roughly 40 seconds per page. So each virtual shopper in the plan pauses 25 to 60 seconds between clicks, which testers call think time. This matters more than it looks: the same 1,200 users with 1-second pauses would be a dishonestly harsh test of a load that will never occur, and a different test altogether.
Then there is the load shape itself: one 95-minute run in four acts. Ramp up over 5 minutes to 600 users and hold for 20 minutes. Climb to 1,200 and hold for 20. Climb again to 2,200 and hold for 20. Then drop back to 600 for a final 20.
Why 600 first? Because it is half the forecast, and it is supposed to be easy. If the store struggles at half the expected crowd, the test has already produced its headline and nobody needs to wait an hour for it. The 1,200 plateau is the requirement itself. The 2,200 plateau asks the uncomfortable question every forecast deserves: what if marketing under-forecast by 80%? And the return to 600 tests something teams forget to test: whether the site recovers from an overload by itself, or stays wedged until someone restarts it. Each plateau is deliberately flat, because steady sections are the only parts of a load test you can read trustworthy numbers from.
And the rehearsal? It is a ten-minute miniature of the staircase, and its only job is to prove that the phases start and stop on schedule before real generator hours are spent on the full run. Cheap insurance before the full run.
AI test creation: building the load test from your test cases
Now the part that used to be the barrier: turning four functional test cases into a working load test. Here is the entire human contribution to that step. The MCP server is already running on a laptop; the assistant is connected to it; the prompt states the goal and nothing else.
$ claude mcp add --transport http jmx-mcp http://localhost:8090/mcp
$ claude "We need to know whether our store at https://bench.pflb.us
   survives Black Friday: marketing expects 1,200 shoppers on the site
   at once. Here is the file with our test cases (test-cases.csv) and
   our test data files (test-data/). Plan and build whatever load tests
   answer that question — and be gentle with the site along the way."
● assistant: Here is how I would answer it with three JMeter plans built
   from the same recorded flows: a 20-minute baseline at 100 users to
   measure "normal", a 95-minute staircase 600 → 1,200 → 2,200 → 600 to
   test the requirement, the headroom above it and the recovery after
   it, and a small rehearsal copy to verify the schedule cheaply first.
   Starting now — walking your test cases in a browser.
Notice what the prompt does not contain: no thread groups, no ramp-up schedules, no plan structure. The three plans are the assistant's answer, not the team's instruction.
The test cases themselves live where yours do: in a tracker, Jira in this team's case. Getting them out is a standard CSV export, one file. This is what the assistant received:
TCLT-101Guest browses the catalogue to a product pageHigh
Preconditions: Browser with cleared cookies; user is not signed in.
| # | Action | Data | Expected result |
|---|---|---|---|
| 1 | Open the store home page | https://bench.pflb.us/ | The home page loads with the Sunny Sprout logo, a search box, the six category links in the top menu and a grid of featured products with photos and USD prices |
| 2 | In the top menu, click the "Girls" category | The category page opens with the heading "Girls" and a grid of products; every card shows a photo, a name and a price | |
| 3 | Click the product "Meadow Twirl Dress" in the grid | The product page opens: name, price in USD, stock note, quantity selector and an enabled "Add to cart" button are visible |
TCLT-102Guest finds a product through searchHigh
Preconditions: User is not signed in.
| # | Action | Data | Expected result |
|---|---|---|---|
| 1 | Open the store home page | https://bench.pflb.us/ | The home page loads with the search box "Search our catalog" in the header |
| 2 | Click into the search box, type a term from the test data and press Enter | terms: data/search-terms.csv (e.g. rainbow) | The results page opens with the searched term in the heading and at least one matching product card with photo and price |
| 3 | Click the first product in the results | The product page of that item opens with its name, price and an enabled "Add to cart" button |
TCLT-103Guest buys a product without an accountCritical
Preconditions: User is not signed in; the cart is empty (no counter on the cart icon).
| # | Action | Data | Expected result |
|---|---|---|---|
| 1 | Open a product page from the test data | products: data/products.csv | The product page shows the name, price and an enabled "Add to cart" button |
| 2 | Click "Add to cart" | A dialog confirms the product was added, with "Continue shopping" and "Proceed to checkout" buttons; the cart icon in the header now shows 1 | |
| 3 | Click "Proceed to checkout" in the dialog | The cart page opens; the line item matches the chosen product, quantity 1, and the total equals the product price plus the displayed shipping | |
| 4 | On the cart page click "Proceed to checkout" | Checkout opens at the "Personal Information" step with the guest form (first name, last name, e-mail) visible | |
| 5 | Fill first name, last name and e-mail, tick the consent checkboxes, click "Continue" | any valid e-mail address not registered in the shop | The step collapses with a green check and the "Addresses" step expands with empty address fields |
| 6 | Fill address, city, state and ZIP, click "Continue" | e.g. 12 Sunny Lane, Dover, Delaware, 19901 | The "Shipping Method" step expands and shows at least one carrier with a delivery price |
| 7 | Keep the preselected carrier, click "Continue" | The "Payment" step expands and lists the available payment methods | |
| 8 | Select "Pay by Cash on Delivery", tick the terms of service checkbox, click "Place order" | The confirmation page opens with the heading "Your order is confirmed", an order reference code and the ordered item listed |
TCLT-104Registered customer signs in and buys a productCritical
Preconditions: A customer account from the test data exists; user is signed out; the cart is empty.
| # | Action | Data | Expected result |
|---|---|---|---|
| 1 | Open the sign-in page via the "Sign in" link in the header | https://bench.pflb.us/login | The sign-in form opens with e-mail and password fields and a "Sign in" button |
| 2 | Enter the e-mail of a test account | accounts: data/users.csv | The e-mail is shown in the field |
| 3 | Enter the password of the same account and click "Sign in" | The store returns to the shop; the header now greets the customer by first and last name instead of "Sign in" | |
| 4 | Open a product page from the test data and click "Add to cart" | e.g. "Bunny Snuggle Toy" from data/products.csv | The confirmation dialog appears and the cart icon shows 1 |
| 5 | Proceed to checkout through the cart page | Checkout opens; the "Personal Information" step is already completed with the signed-in account and the "Addresses" step is expanded | |
| 6 | Fill or reuse the address, keep the carrier, select "Pay by Cash on Delivery", accept the terms, click "Place order" | The confirmation page shows "Your order is confirmed" with an order reference; the order later appears in the account's order history |
Alongside the cases, the team prepared three small data files, the same
kind of fixtures a QA team makes for any test cycle.
users.csv holds 20 test accounts, email and password, created
on staging by QA the normal way. search-terms.csv holds 10
phrases real customers type. products.csv holds 16
product-page URLs so the load spreads across the catalogue. Why 20
accounts rather than one? Because each virtual shopper must sign in as a
different user; a thousand shoppers on one account would let the site
serve everything from cache, and you would be testing the cache, not the
store. The assistant wires these files into the plans so that each virtual
shopper draws its own row. All three are downloadable in the Artifacts
block at the end of this article.
Then the assistant goes to work, and this is where the years-to-learn part happens without the team. It walks all four test cases against the live store with a real browser and records what actually crosses the wire: 47 requests in total. Forty-seven, for four short cases? Yes, because one “page” is never one request. Opening a category page also fetches the menus, the product tiles, the mini-cart. A load test that skipped those would be testing a store nobody visits.
The hardest part of the recording is invisible in the result, so it deserves a paragraph. Modern sites stamp every session and every form with security tokens: one-time values the server generates and expects back. Replay a recorded token and the server rejects you. A working plan must extract a fresh token on every pass and substitute it into the next request. This is called correlation, and it is the classic skill barrier of load testing. The assistant handled it, including one genuinely obscure PrestaShop subtlety: the checkout token is regenerated after the personal-information step, so the extractor has to sit after that step, not before it.
● recorded all four flows against the live store — 47 requests in
   all (one "page" is many requests: menus, product tiles, the
   mini-cart), every dynamic value identified
● session cookies and per-form security tokens correlated: the plan
   extracts a fresh token on every pass instead of replaying the
   recorded one — including the PrestaShop subtlety where the checkout
   token is regenerated after the personal-information step
● test data wired in: sign-in accounts, search terms and product URLs
   now come from your CSV files, so no two virtual shoppers collide
Recorded is not the same as trusted. Before any real load, the assistant validates the plans against the live store in a short ladder, each rung slightly heavier. “Users per flow” here means per recorded flow: at the top rung, 8 users on each of the four flows, 32 virtual shoppers in all.
| Rung | Hold | Samples | Failed | What it taught |
|---|---|---|---|---|
| 1 user per flow | 60 s | 114 | 0 | Every flow works end to end; every extracted token is fresh |
| 3 users per flow | 90 s | 413 | 0 | Flows survive running in parallel; carts and sessions don’t collide |
| 8 users per flow | 120 s | 1,362 | 0 | Data files rotate correctly; the plan is safe to scale |
● validate_jmx (1 user/flow, 60 s)  →  114 samples, 0 failed
● validate_jmx (3 users/flow, 90 s)  →  413 samples, 0 failed
● validate_jmx (8 users/flow, 120 s) →  1,362 samples, 0 failed
● every extractor anchored to live tokens, not recorded literals;
   6 CSV data files wired in and rotating
Three rungs, 1,889 requests, zero failures. A fact worth saying plainly: through all of this, nobody on the team opened a JMX file. One more property matters later: all three plans are generated from the same recorded flows, so their numbers are comparable by construction.
The load test itself: 95 minutes, four acts
A laptop cannot pretend to be 2,200 people; that is what the platform's cloud generators are for. After the ten-minute rehearsal confirmed the schedule behaves, one more request to the assistant sends the real thing up.
$ claude "The staircase plan is validated. Upload it to the PFLB
   platform with its data files and start the run."
● assistant: Uploaded — the platform created the test and returned its
   page: platform.pflb.us/account/tests/…  Starting the run now.
● run accepted: 2,200 virtual users at peak, AWS cloud generator
● 13:32 UTC — load begins; watch it live on the run page
● 15:07 UTC — the platform stops the run right on schedule: 95 min sharp
The platform creates the test, returns a link to its run page, and from 13:32 UTC the team is simply watching live charts: a blue staircase of users climbing exactly as planned, green bars of requests, response-time lines that will soon get interesting. At 15:07 UTC the platform stops the run on its own, 95 minutes sharp. Nobody babysits a timer.
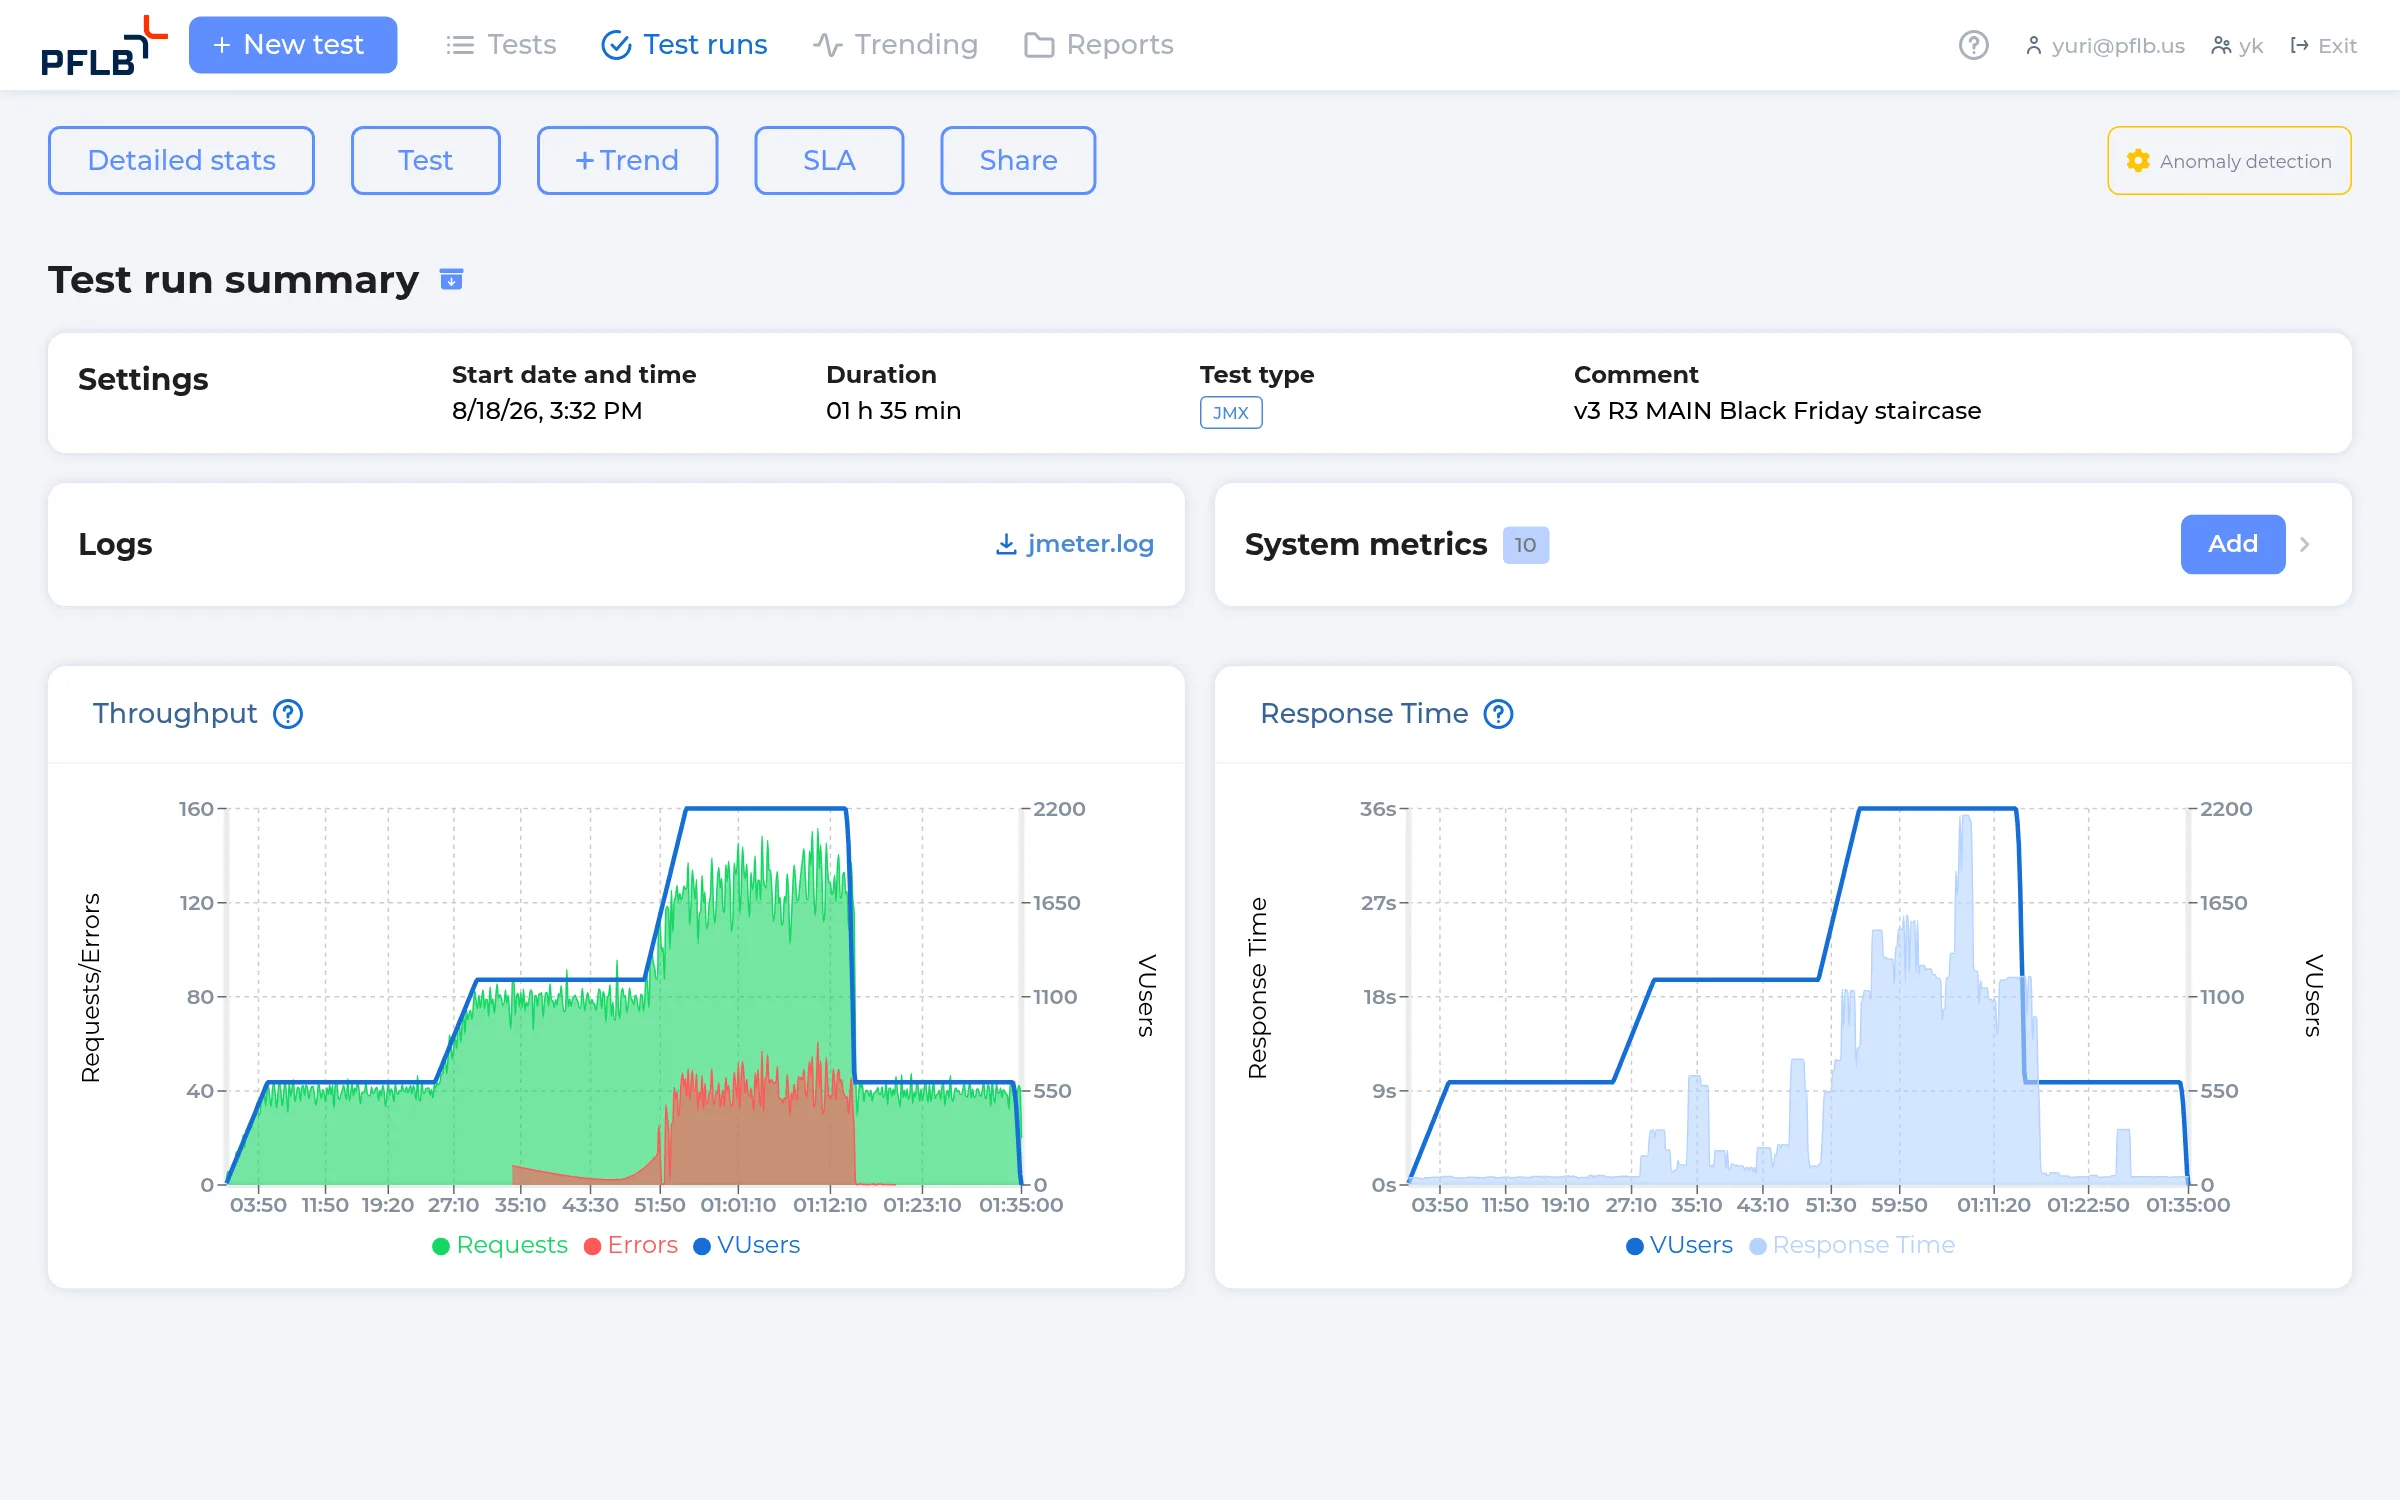
Act one, 600 users. Quiet. Response times sit at their baseline values, errors are zero, host CPU idles around 47%. Half of Black Friday costs this store almost nothing.
Act two, 1,200 users. The requirement itself. Errors stay excellent at 0.11%, and if error rate were the only gauge, you would call it a pass and go home. But the response times lift. Pages touch 1.5 seconds, right at their limit. Placing an order stretches to 3.7 to 5.0 seconds against a 3.5-second target. Host CPU reaches 83%. The site is not failing; it is queueing. Every request now waits in line for a nearly saturated CPU, and the wait is the slowdown.
Act three, 2,200 users. The queue becomes a collapse. A third of all requests — 32.6% — come back as HTTP 500 errors, and p95 response times pass 20 seconds. On the server, the load average hits 158. Load average is the length of the queue of processes waiting for CPU time; a healthy number is about one per core, which on this 8-core host means 8. At 158, a request spends most of its life not being processed, just waiting for its turn. One vivid detail says it best: our own monitoring probe on that host could no longer complete its database queries during the collapse. The watcher was queueing behind the watched.
Act four, back to 600. The most quietly reassuring twenty minutes of the day. Within about 10 seconds of the load dropping, the errors stop. Within about 3 minutes, response times are fully back to baseline. No restarts, no stuck processes, nothing wedged. Of all seven requirements, recovery is the one this store passes most convincingly.
The results: response times and error rates, phase by phase
Charts tell the story; the steady-state numbers make it precise. Each column below is one 20-minute plateau of the same run, measured the same way, from the same recorded flows.
| Steady state, 20 min | 600 users | 1,200 users | 2,200 users | 600 again |
|---|---|---|---|---|
| Requests served | 47,550 | 94,198 | 151,897 | 40,217 |
| Errors | 0% | 0.11% | 32.6% | 0.04% |
| Home page p95 | 0.84 s | 1.50 s | 13.8 s | 0.94 s |
| Search results p95 | 0.61 s | 1.50 s | 13.7 s | 0.60 s |
| Checkout address p95 | 0.61 s | 1.65 s | 12.2 s | 0.62 s |
| Place order, guest, p95 | 1.25 s | 3.70 s | 23.0 s | 1.22 s |
| Place order, account, p95 | 1.63 s | 4.95 s | 35.2 s | 2.33 s |
| Host CPU busy | ~47% | ~83% | 99.8% | ~45% |
Read the 1,200 column top to bottom and the pattern is unmistakable. At exactly the forecast load, the store serves pages on the limit and takes orders over it. The money moment, placing the order, is the slowest operation on the site and the first to break, because checkout does the most work per click.
Notice also what the 1,200 column does not show: errors. At 0.11%, every smoke check, every uptime monitor, every quick manual click through the site would report green. This is a quiet failure. On the real Black Friday it would not surface as an incident; it would surface three weeks later as a chart of abandoned carts.
The 2,200 column shows something different in kind, not just in degree: a hard throughput ceiling. Through that plateau the store sustained roughly 85 successful requests per second, and no more. Past the ceiling, extra demand does not slow things down further; it converts directly into errors, one for every three requests.
Finding the bottleneck: root cause analysis in the AI report
The test is done, and here the exercise changes audience. Everything so far lived in a chat with an assistant and a run page the QA team watched. But the people who must now act on the findings, the development team, were not in that chat and should not have to be. They need a document: findings, evidence, recommendations, behind a link anyone can open. Not a war story retold at standup. This is what the platform's AI report is for.
The server-side picture goes in first. During the run, Datadog's agent had been collecting host CPU, load average, memory, per-container CPU for the PHP tier and MySQL, and MySQL internals: running threads, row-lock waits, connections, slow queries. After the run, the assistant exported ten of those series from the Datadog API into plain timestamp-and-value CSV files, and the team attached them on the test run page — System metrics, Add, a short form per file. Ten files, a few minutes. This is also why teams without Datadog are not stuck: any monitoring that can produce a timestamp-and-value CSV plugs into the same slot.
Then one click, and about three and a half minutes later, the report exists.
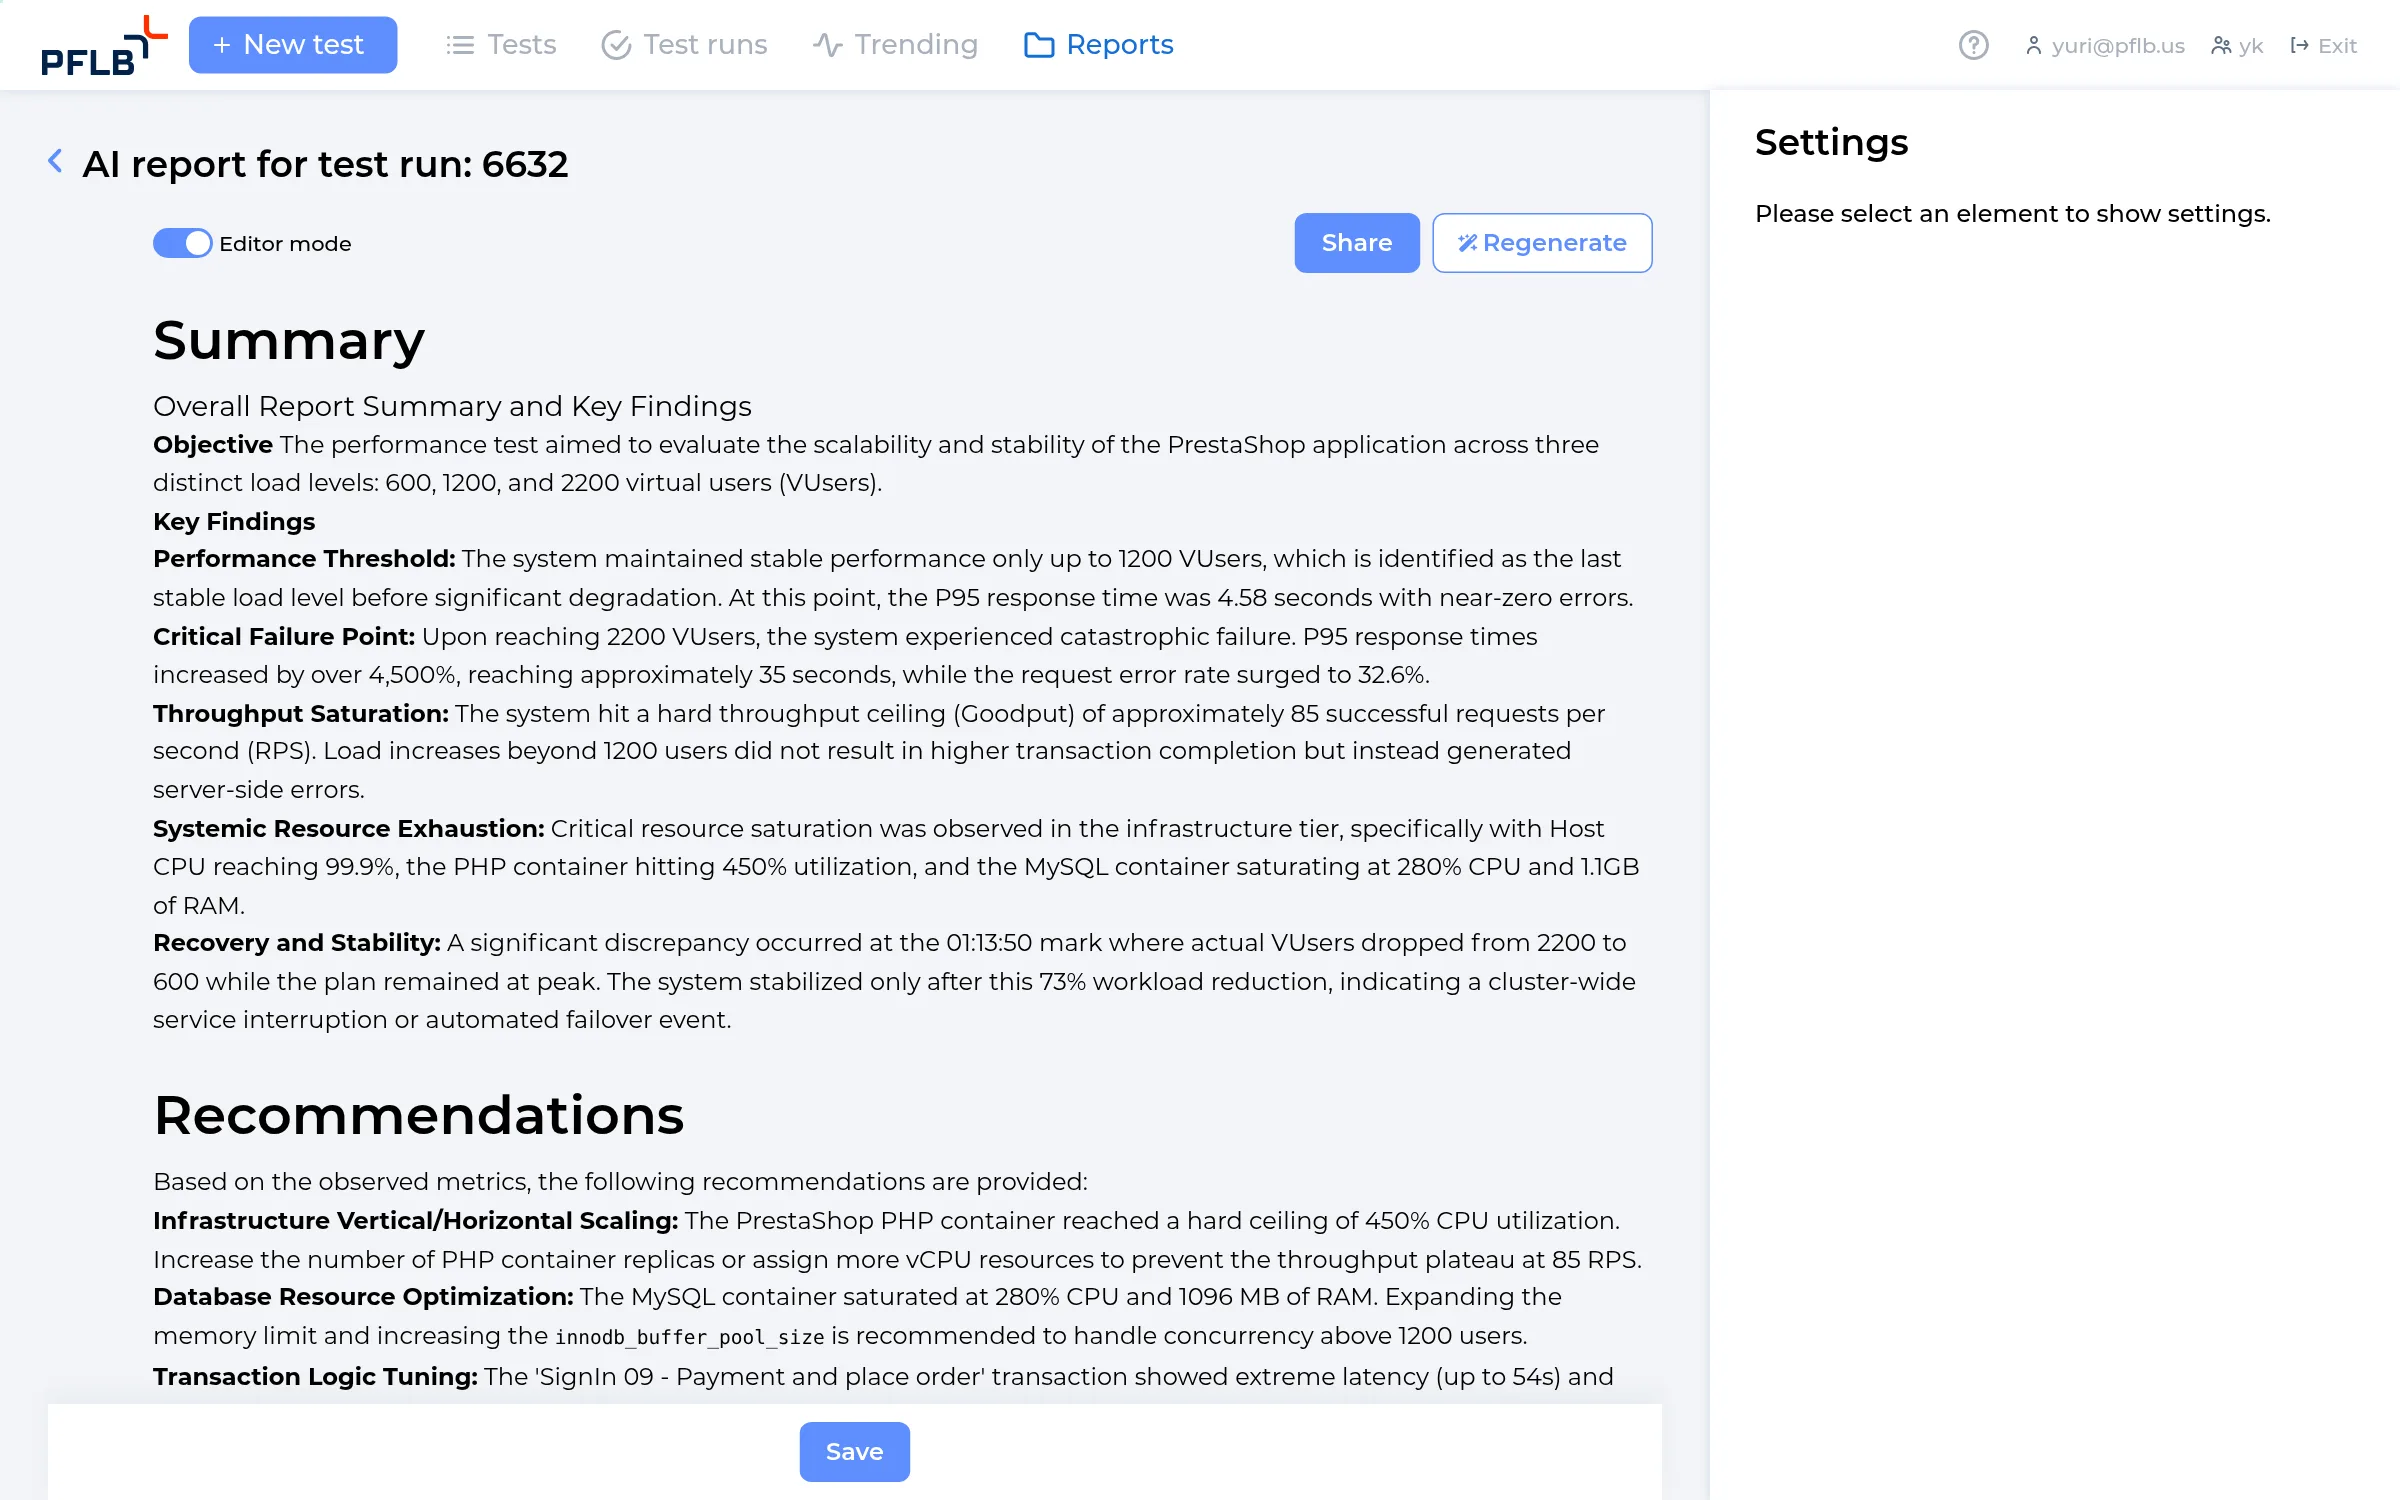
Its findings, in brief. The last stable level was 1,200 users; at 2,200 the failure is catastrophic, with p95 around 35 seconds and 32.6% errors, against a hard ceiling of about 85 successful requests per second. The resources tell the why: host CPU at 99.9%; the PHP application container pinned at its 450% ceiling, meaning 4.5 of the 8 cores; the MySQL container at 280% CPU and about 1.1 GB of RAM. And one crucial negative finding: the database itself never queued. Running threads peaked at 11 and row-lock waits stayed at zero throughout.
The most interesting page is the correlation study across the ten imported series. The place-order response time tracks host CPU with a correlation of 0.73, and tracks load average at 0.95. How do you read that? A correlation of 1.0 would mean two curves move perfectly in step. At 0.95, when the CPU queue grows, checkout slows, almost beat for beat. The report's own wording: host queue depth is the primary driver of payment latency.
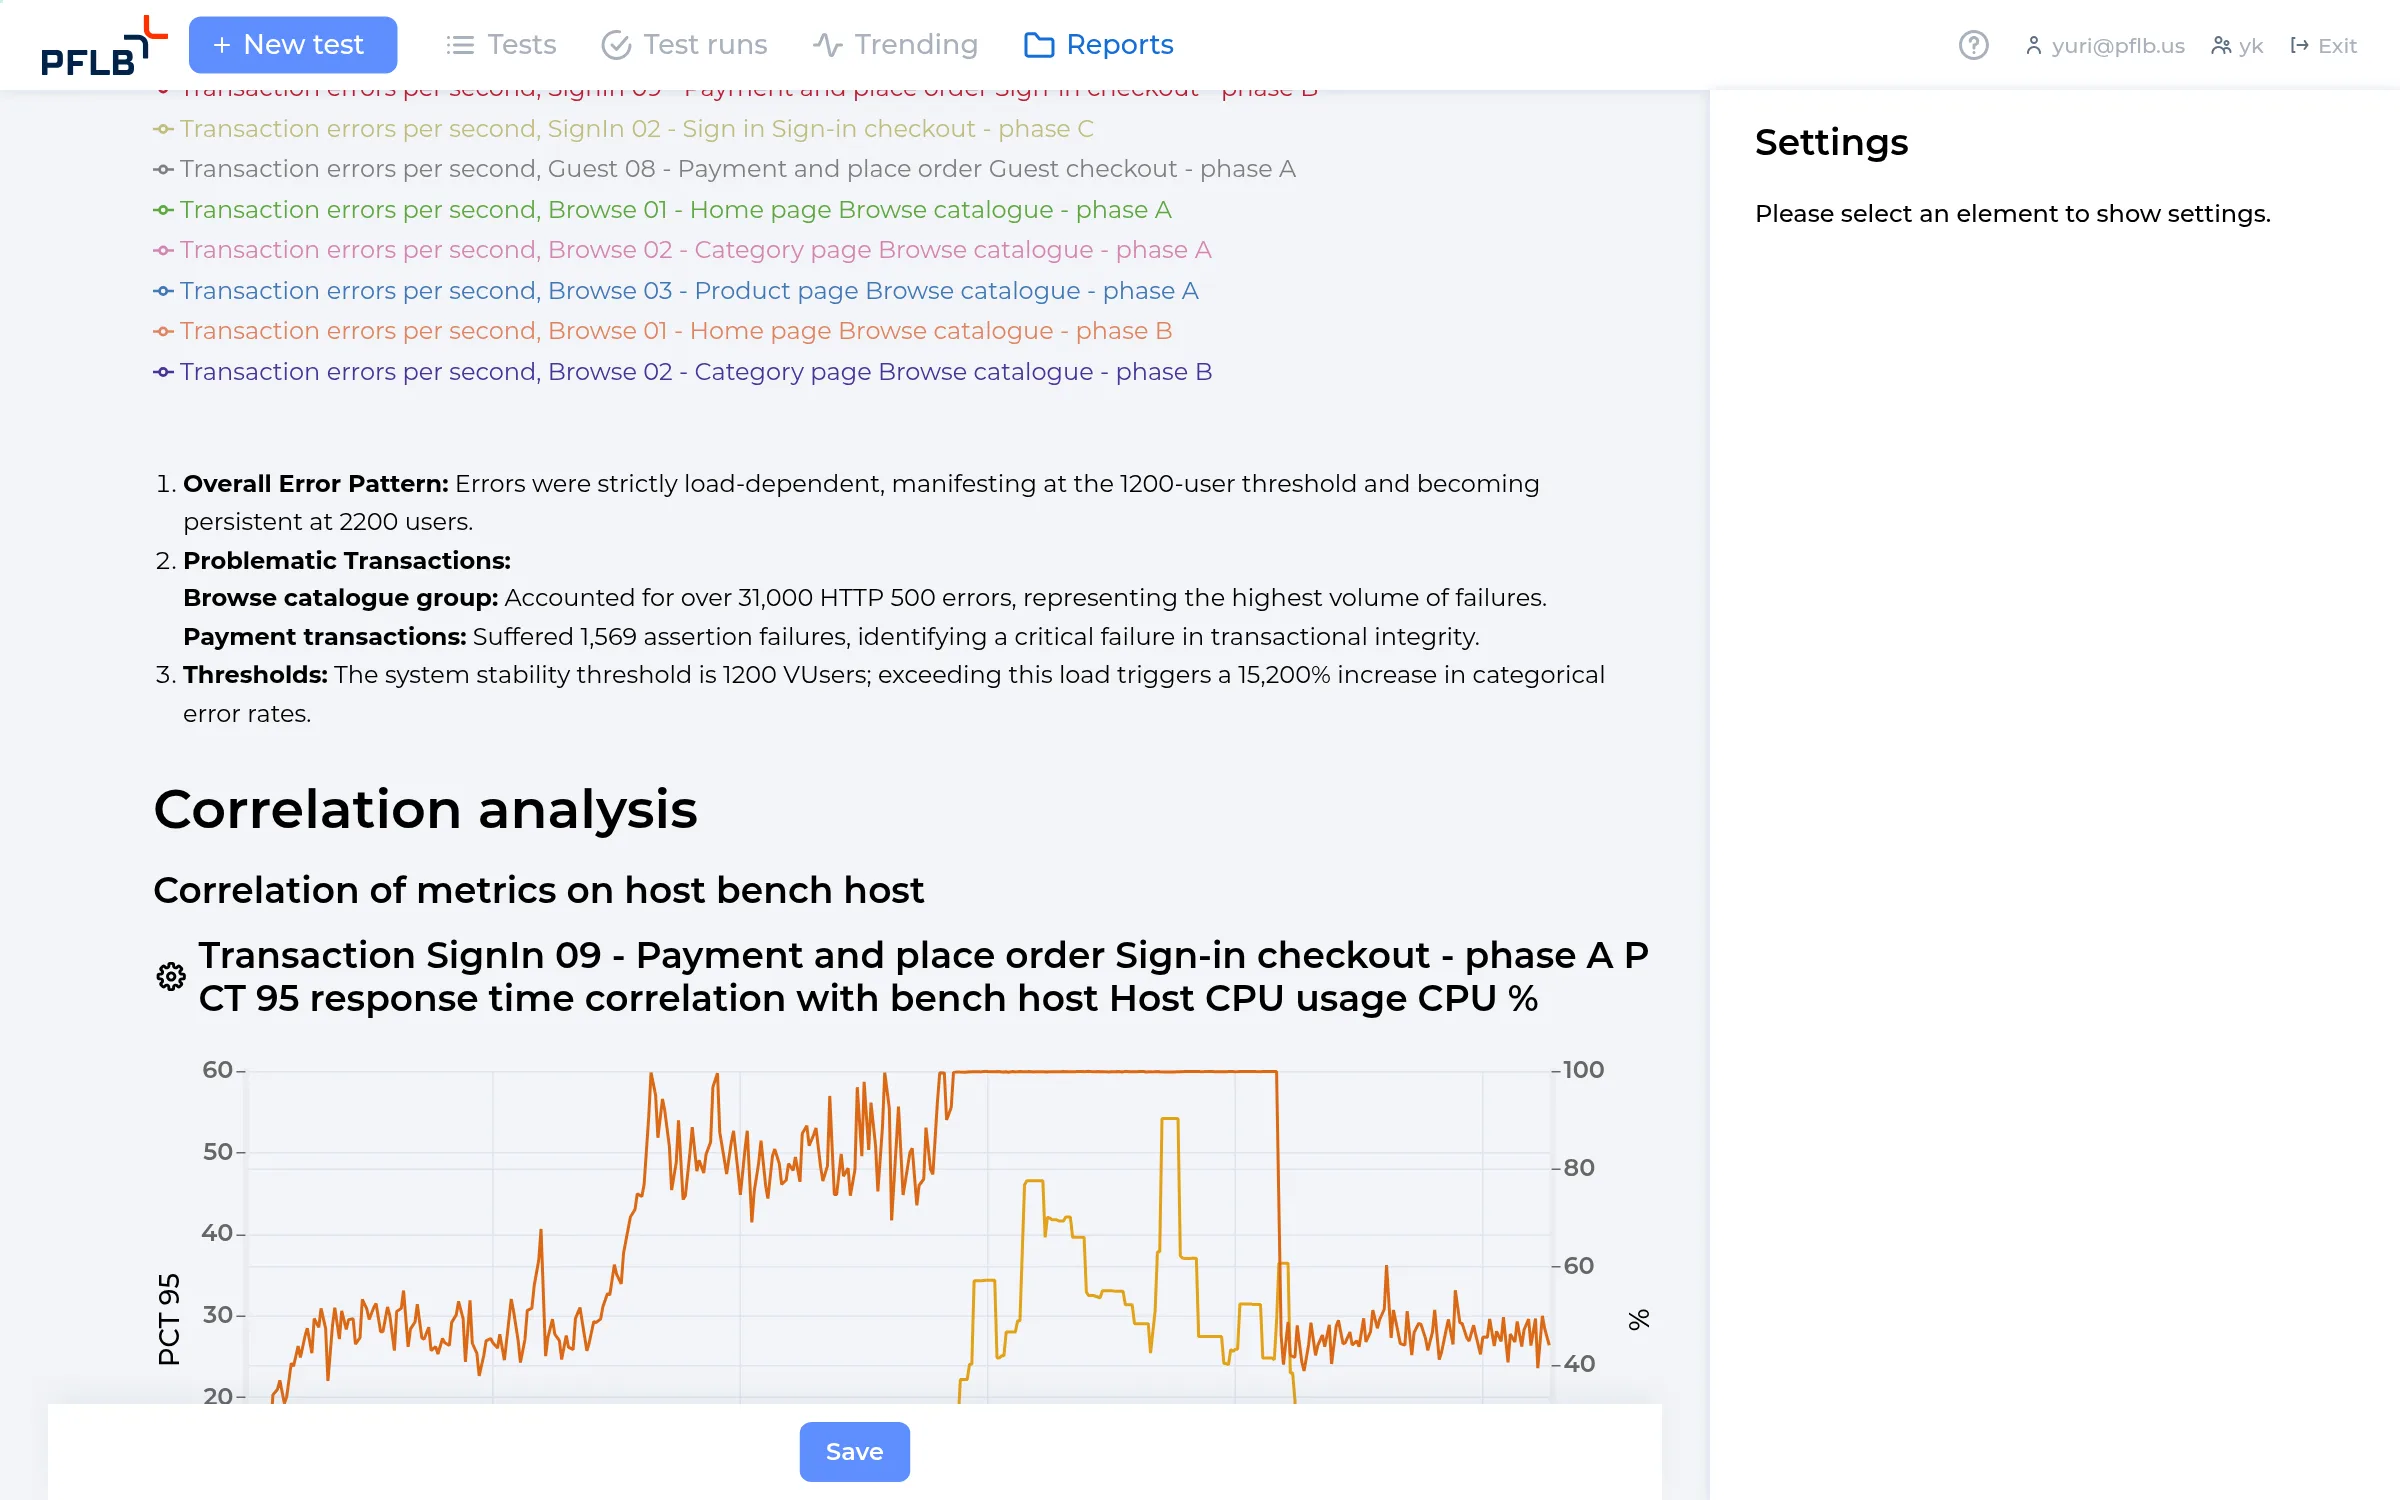
All of which condenses to one sentence: the bottleneck is CPU capacity of the PHP application tier; every page is computed from scratch, and checkout, the heaviest flow, suffers first.
The report's second key property, after shareability, is that it is editable, and it earned its keep the same day. The AI wrote the analysis in 3.5 minutes; the QA engineer then reviewed it against the data, the way you would review a strong analyst's draft. Two of its interpretations did not survive the check. It read the planned final ramp-down as an outage, and it floated a database row-locking hypothesis even though the imported lock-wait series is flat zero. Both were corrected directly in the report editor, in minutes, and the reviewed version is what development received. The public guest link you can open right now is that reviewed version. Generate, review, share: the review step is not a workaround, it is the workflow.
A debate from our own team
While preparing this article we argued about this exact feature. One side: if an AI assistant ran the whole test, why do we need a separate AI report at all? Just ask the assistant. The other side: a long test produces so much data that any AI reading it will drown and start hallucinating. Both turned out to be half-right. The raw run really would drown anyone, human or machine: hundreds of thousands of measurements. That is why neither the report nor a good assistant reads data raw; both work from aggregates and check hypotheses against the series. The real difference is the output. A chat analysis dies with the session. The report is a permanent, shareable, editable document. That is worth generating.
The verdict: is the store ready for Black Friday?
So, does the store survive Black Friday? No. And the reason is worth stating carefully, because it is not the reason a smoke test would find. The store does not crash at the forecast load. It fails the requirement that matters most: at exactly 1,200 users, paying slows to 3.7 to 5.0 seconds against the 3.5-second target, with the CPU at 83% and no headroom left. And if the forecast is under by 80%, one in every three clicks becomes an error.
| Requirement | Measured at 1,200 users | Verdict |
|---|---|---|
| 1,200 users held ≥ 20 min | Held, full plateau | Pass |
| Pages p95 ≤ 1.5 s | 1.50 s | On the line |
| Checkout steps p95 ≤ 2 s | 1.65 s | Pass |
| Place order p95 ≤ 3.5 s | 3.70 s guest / 4.95 s account | Fail |
| Errors ≤ 1% | 0.11% | Pass |
| Host CPU ≤ 85% | 83% | On the line |
| Recovery ≤ 10 min | ~3 min | Pass |
Because the diagnosis is specific, the fix list is specific, in order of leverage. First, more CPU for the PHP tier: more cores, or a second application container. Second, cache the pages that are recomputed identically for every visitor; the correlation evidence says computation, not data, is what the store runs out of. The report adds a third, smaller item: MySQL buffer-pool tuning. Then re-run the same test and watch the same rows of the same table. This is why comparable plans matter: “place order p95 at 1,200 users” is a number that either improves or does not. Specific beats “optimize performance” every time. And if nobody on the team has the bandwidth for the re-run, this is exactly the work PFLB’s performance testing service does for clients.
Everything used in this article — the test plans, the test cases, the data files, the metric exports — is in the Artifacts block just below, so you can retrace any step.
The store was never the point. The point is what a manual QA team was able to answer in one working day, with evidence: what survives, where it breaks, why it breaks, what to fix first, and whether it recovers on its own. The parts of load testing that used to take years to learn — building a correlated script, running a correlation analysis across ten metric series — were done by AI. The parts that remained human are the parts QA teams are already good at: deciding what “ready” means, and checking an analysis against the data before signing it.
Your staging site, your four test cases, a forecast someone in marketing already has. Why not this week?
Artifacts: test plans, test data and metric exports
Everything the article claims is checkable. The runs were recorded on August 18, 2026, the AI report on August 19; software: jmx-mcp at the commit current with this article, Apache JMeter 5.6.3, PrestaShop 8, Datadog Agent 7.
Download what we used: loadtest.jmx — the 95-minute staircase plan the assistant built; baseline.jmx — the 100-user baseline plan; test-cases.zip — the four test cases, cards and CSV export; test-data.zip — users.csv, search-terms.csv, products.csv and friends; datadog-metrics.zip — the ten metric CSVs imported into the run; transcript-plan-building.jsonl — the full assistant session that built the plans.
Choosing a tool for this workflow: our comparison of 18 load testing tools for 2026 rates every vendor on the same AI action scale, A0 to A3.
- The AI report on the staircase run — public guest link · https://platform.pflb.us/shared/reports/68d6326e-27c0-48b9-a30e-23df0348b007 · PFLB Platform, generated August 19, 2026
- jmx-mcp — the MCP server used in this article · built by PFLB; the repository opens with the public release
- The test store · https://bench.pflb.us/ · a stock PrestaShop 8 on a single 8-core host — see the staging disclosure above
- Datadog free tier — infrastructure monitoring · https://www.datadoghq.com/pricing/ · up to 5 hosts, 1-day retention; enough for a test day
- Little’s law — how user counts come from analytics · https://en.wikipedia.org/wiki/Little%27s_law · the one formula in this article
- Apache JMeter · https://jmeter.apache.org/ · the engine underneath: stock thread groups only, no plugins
Talk to a
performance engineer
Bring the plan this method produced, or the system it should target. A PFLB engineer will review the scenario coverage, the workload model and the correlation, and tell you what a full-scale run would take.
- Scenario and workload review before any spend
- Full-scale runs from managed cloud generators
- A report your team can act on
Frequently asked questions about AI load testing
What is AI load testing, and how does it differ from traditional load testing?
Traditional performance testing puts the whole burden of test creation on a specialist: someone records the flows, writes and debugs the test scripts, and keeps them working as the application changes. Traditional testing methods assume that person exists, and that manual effort is the reason most teams never start. AI driven performance testing moves that work to an assistant: it reads your functional test cases, records the flows itself, writes the JMeter plan and fixes it when a run fails. What it does not change is the physics — the load is still generated by the same engines, and the numbers mean exactly what they meant before. The engines are the same performance testing tools the industry already trusts — AI tools sit on top of them rather than replacing them. AI in performance testing shortens the path to a first test; it does not invent a different kind of evidence.
Which AI load testing tools does this experiment use?
Whether the label is AI load testing or load testing AI, the parts are the same three things, and only one of them is new. Claude as the AI assistant, PFLB's MCP server as the bridge that lets it drive the platform, and JMeter as the engine that actually generates load. The MCP server is what turns a chat window into one of the AI testing tools rather than a text generator: it gives the model real verbs — record a session, upload a plan, start a run, read the results. Most AI performance testing tools on the market wrap traditional performance testing tools — the same traditional testing tools your team already runs — in a prompt box; the difference in AI powered performance testing done this way is that the AI agents get the same API a human operator uses, so anything they do you can inspect and repeat by hand.
How does AI build realistic test scenarios?
From your own material rather than from a guess. The test scenarios come out of functional test cases you already wrote, so they mimic actual user behavior instead of an idealised path; the AI records those flows in a browser against staging and keeps what went over the wire. Test data comes from your CSV files, correlation tokens are extracted from real responses, and the test parameters — ramp, duration, think time — are set from the workload model you agreed, not from a default. Complex user interactions such as a six-step checkout survive this because the recording captures them as they happen. Test environments matter here as much as the script: a plan recorded against staging assumes staging resembles production. What the AI cannot do is model load nobody has described. It has no historical performance data about your traffic unless you give it some — feed it past test data and historical data from earlier runs and it will use that; otherwise, if your traffic assumptions are wrong, realistic test scenarios built on them will be confidently wrong too.
What does the AI actually analyse after the run?
Everything the run produced, plus whatever monitoring you import. In this experiment the AI report correlated response time and error rates from the test with ten Datadog metric series covering CPU, memory and resource utilization on the host. That is pattern recognition over complex data at a speed a human cannot match: it took three and a half minutes to identify patterns across every one of those performance metrics and produce a root cause analysis pointing at the PHP tier. Vendors label this layer machine learning; whether a given product runs machine learning models, machine learning algorithms or plain statistics, the question to ask is the same — what did it correlate, and can you check it against the test results yourself? Anomaly detection is the part worth being precise about — the platform runs real time anomaly detection inside a running test, so it can detect anomalies and show you system performance and performance behavior turning bad while the load is still on, rather than in a post-mortem. What the report gives you is a draft with the correlations already done; what it cannot give you is certainty, which is why two of its claims in our run did not survive a check against the raw performance data.
Where does AI save time, and where does it not?
It collapses the two slowest parts of the testing process, and the gain in testing efficiency comes from exactly two places: building the scripts and reading the results. Faster test creation is the obvious win — hours instead of days — and faster feedback cycles follow, because a test cycle that used to need a specialist for both ends can now be run by the team that owns the release. Performance feedback that used to arrive weeks later arrives the same day, which makes continuous testing realistic for teams who could not staff it and lets testing workflows keep consistent performance checks in every release. That is where the cost efficiency actually comes from: not cheaper generators, but fewer people-days per test run. More test runs at the same budget also means wider test coverage of the flows that matter. Where it saves nothing is the physical part. Test execution still takes as long as the load profile says — our staircase was 95 minutes and no assistant can compress that — and environments still have to be prepared. Repetitive tasks disappear; the waiting does not.
Can AI replace a performance engineer?
No, and the honest version of that answer is the reason this article exists. AI systems are good at the mechanical layer of software testing: recording, scripting, correlating, summarising. Today's AI models will run those testing systems without constant human intervention, and the test outcomes will look finished either way — which is precisely the risk. They do not replace engineering judgment about what to test, what "ready" means in numbers, or whether a number you are looking at is believable. Test accuracy is not the same as report confidence: our run produced a report that was 90% right in three and a half minutes and wrong twice, and a team without someone able to spot those two claims would have shipped them as real performance issues. What performance testing makes possible is a decision; the decision still belongs to a person. The useful framing is AI and human testers on the same test: the assistant removes the barrier to entry, and a person still owns the testing strategy and the verdict.
Does the AI see my application code?
No. It works from the outside, like a tester: it gets a URL, your test cases and your test data files. It records real browser sessions against your staging site and builds the JMeter plan from what it saw on the wire.
Do I need to know JMeter?
No. You need to be able to read your own functional test cases and answer business questions: how many users, which flows, what response times are acceptable. The assistant writes and fixes the JMX; you never open it unless you want to.
What does a test like this cost?
The MCP server is free to run on your own machine (source-available license). The platform charges for generator capacity: this article’s full experiment — a rehearsal, two baselines and the 95-minute staircase — used about 1,900 VUser-hours. AI reports are billed per report on paid plans.
Can I keep my own monitoring?
Yes, and you should. We ran Datadog’s free tier alongside the platform’s agent, exported ten metric series through the Datadog API after the run, and imported them into the test run as CSV files — the AI report then used them for its correlation analysis.
Can I trust the AI report’s conclusions?
Treat it like a strong analyst whose draft you review: in our run it produced 90% of the analysis in three and a half minutes, including a correlation study across ten metrics, and made two claims that didn’t survive a check against the data. Because the report is editable, we corrected both directly in the report editor before sharing it — the public link in the Sources is the reviewed version.
Our peak is bigger than 2,200 users. Does this scale?
The method doesn’t change: the same plan runs at any size the platform’s cloud generators support — the plan is sized by your workload model, not by hand. What changes is the answer your infrastructure gives you.