Say goodbye to tedious manual reporting after load testing! With PFLB’s innovative AI-powered report generation, performance engineers can quickly turn detailed test data into comprehensive reports. This guide walks you step-by-step through setting up your test, running it, and effortlessly generating exhaustive performance analysis — so you spend less time reporting and more time optimizing.
Let’s dive in!

Generating AI Reports with PFLB Step-by-Step
Currently, the AI report feature is exclusively available to PFLB users.
To generate an AI report, you must perform your entire load test using the PFLB cloud testing platform.
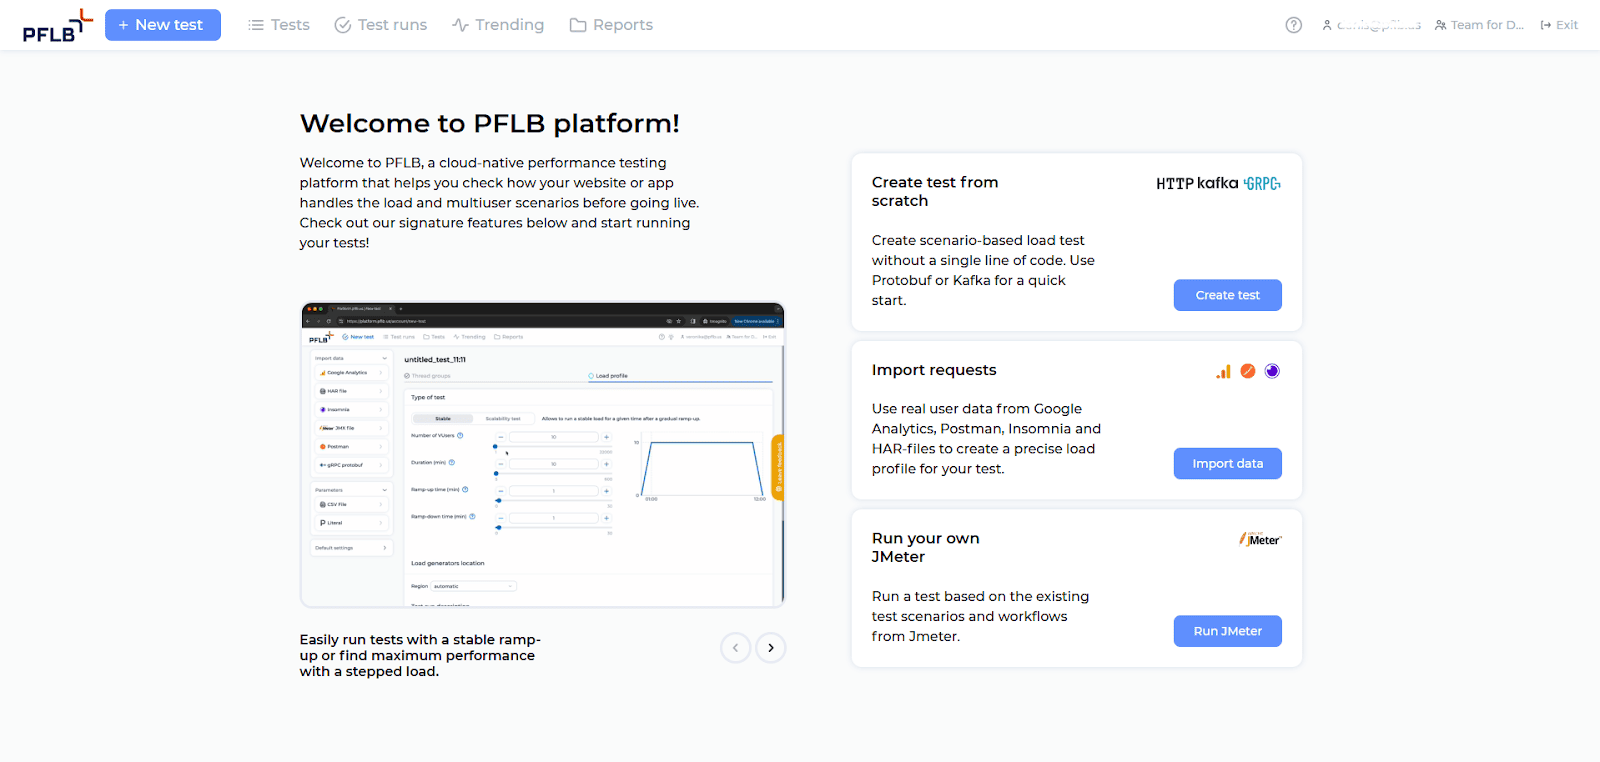
Step 1: Create a New Test
After logging into the PFLB platform, click “+ New test” in the top-left corner of your screen to start setting up your load test.
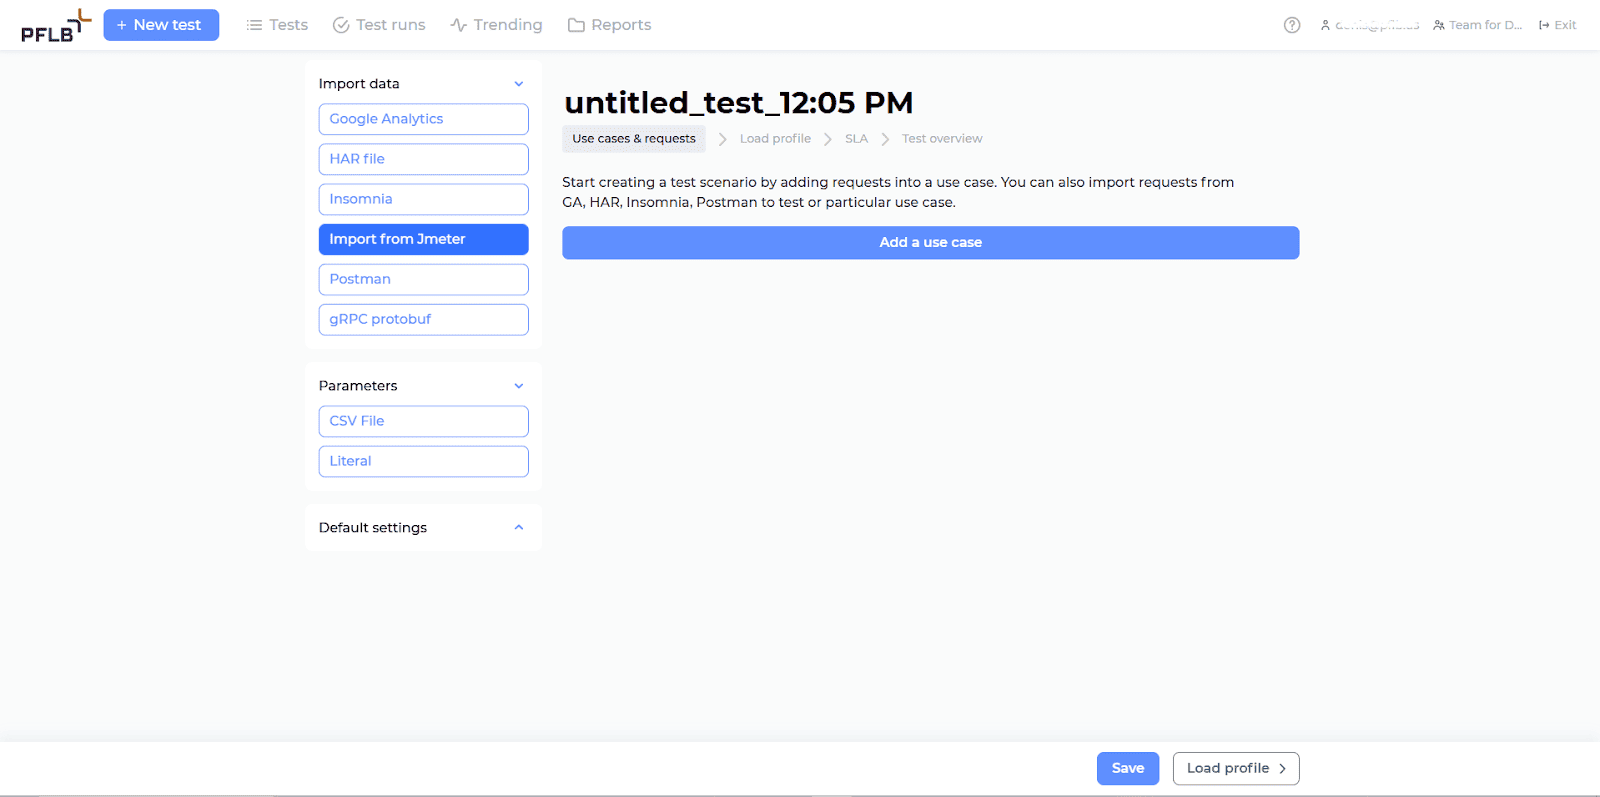
Step 2: Import Your JMeter Test Files
After creating a new test, select “Import from Jmeter” from the Import data menu on the left-hand side.
A pop-up window appears, where you should:
- Drag and drop your JMX test file into the top section.
- If necessary, drag and drop supporting files into the lower section.
- Click Upload to finalize the import.
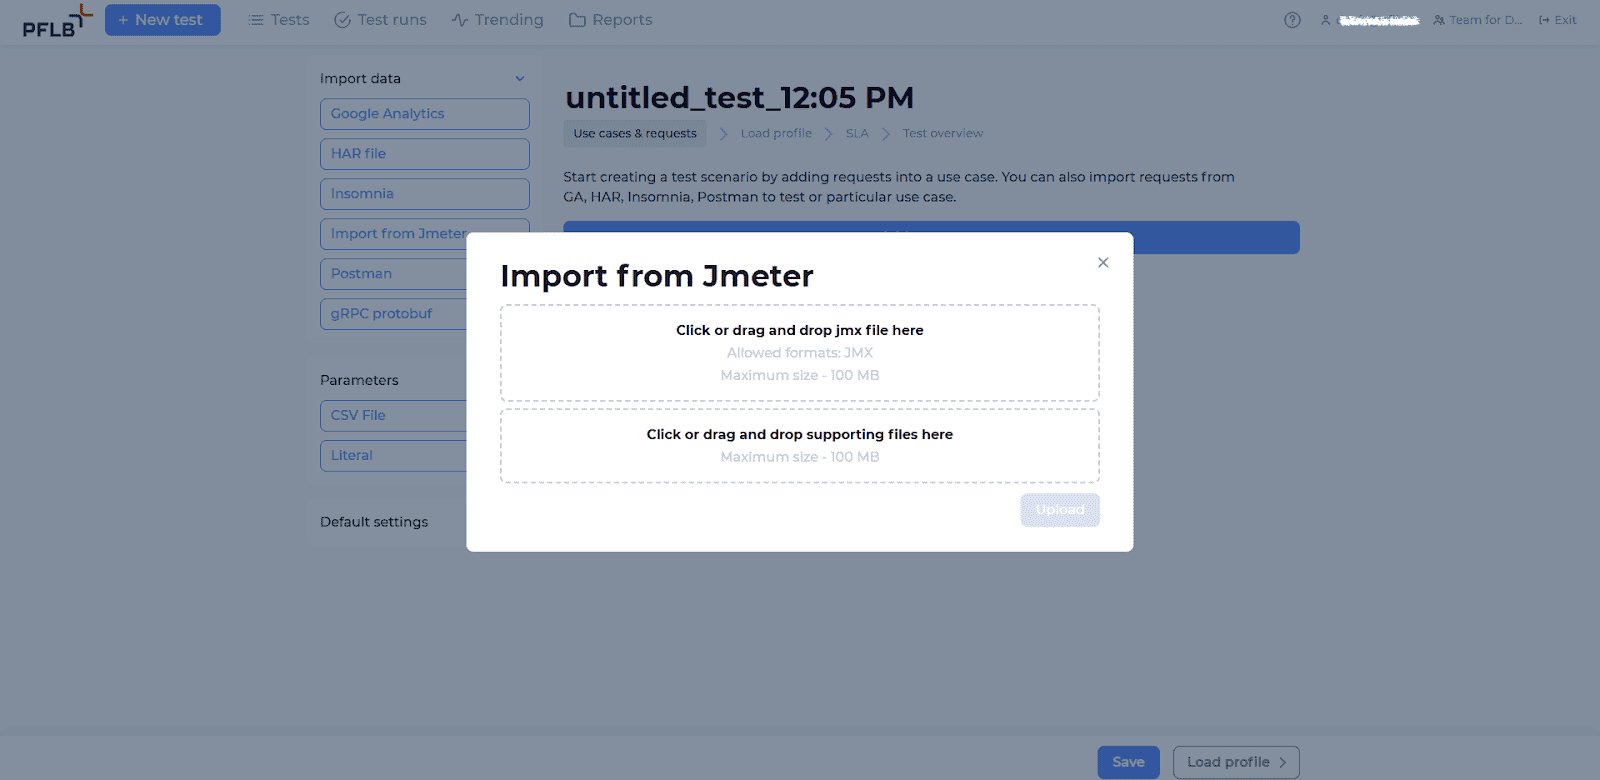
Your test scenarios from JMeter will now be ready to use in PFLB.
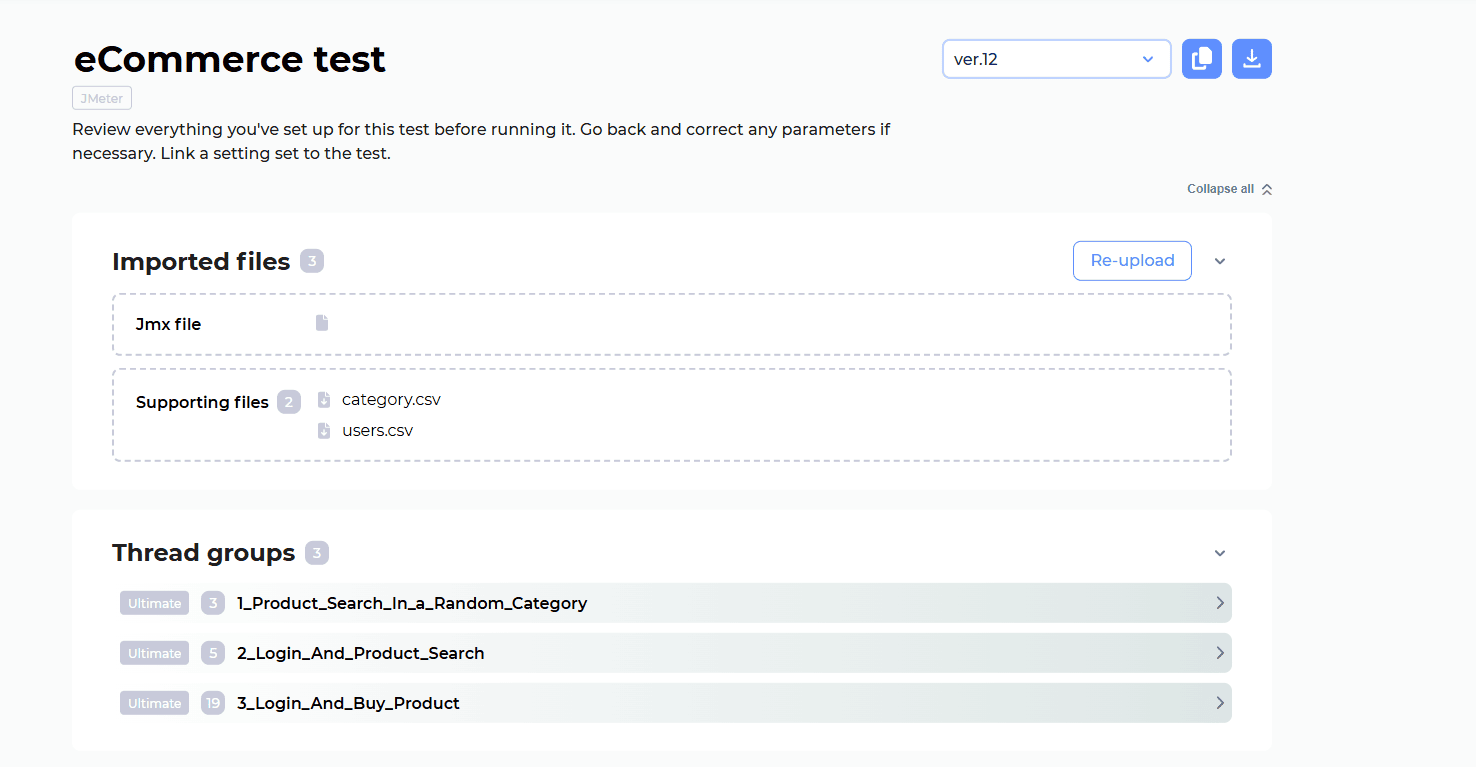
Step 3: Verify and Finalize Your Test Setup
Before running your test, you’ll need to confirm and fine-tune your configuration:
Confirm Thread Groups:
Ensure your imported thread groups from JMeter correctly represent your test scenarios.
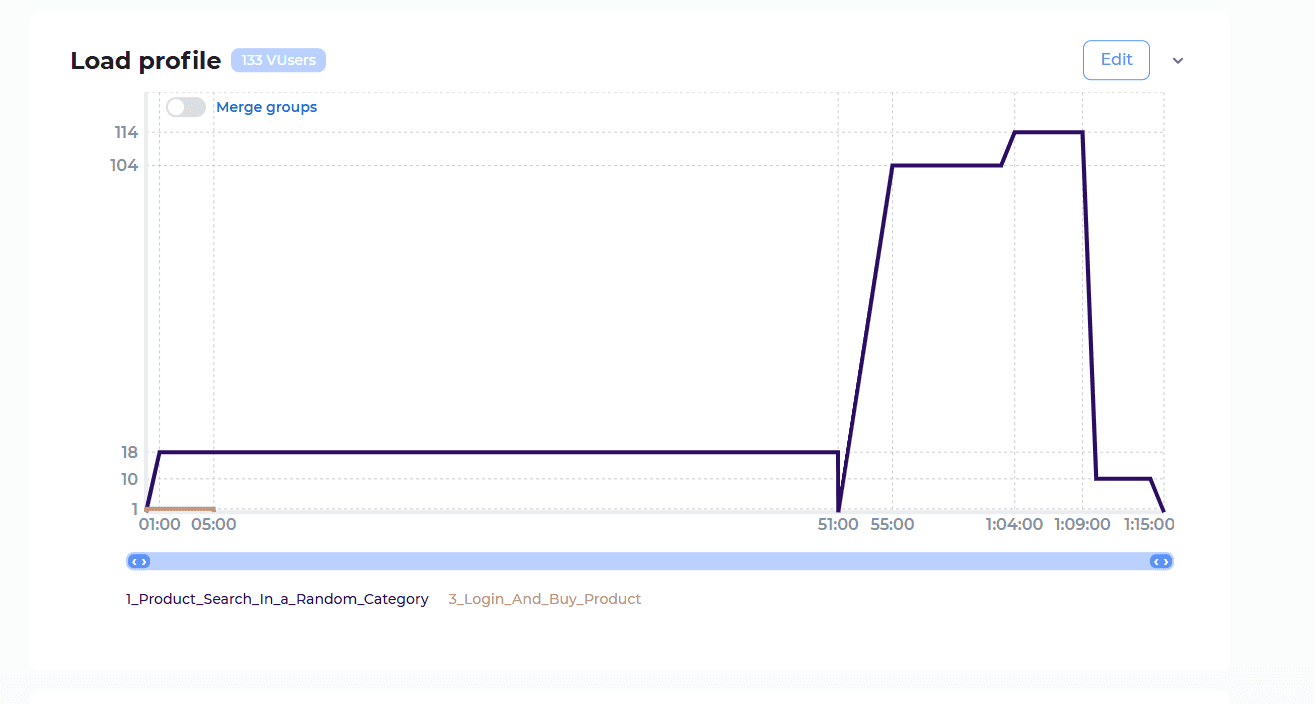
Verify Load Profile:
Review your load profile visually to ensure it accurately reflects the intended load scenarios.
Add SLA and Settings (Optional):
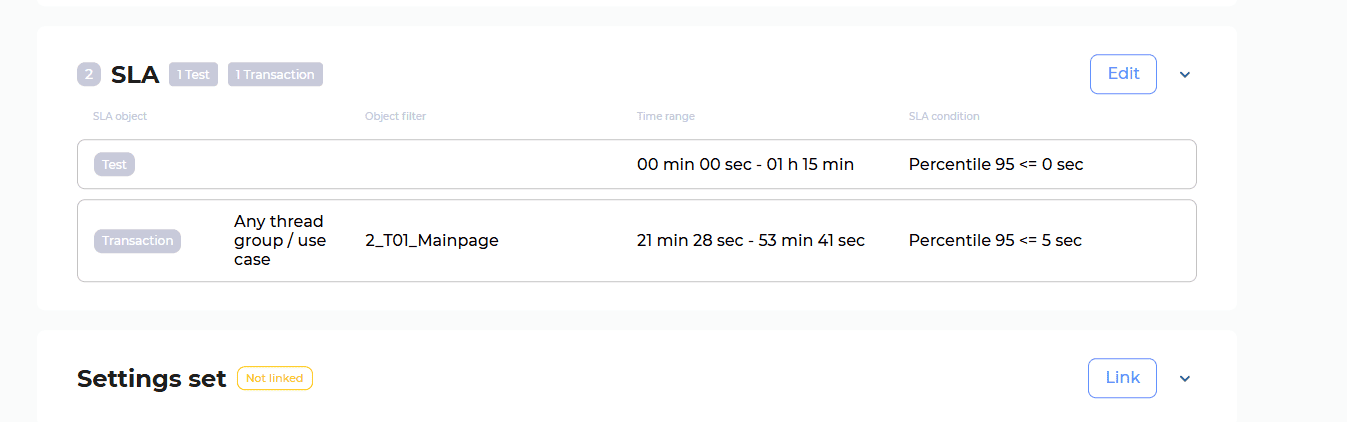
- SLA (Service Level Agreements):
Define performance criteria, such as response time limits, for specific transactions or the overall test. - Settings Sets:
Link predefined settings to your test scenario to simplify management and maintain consistency across tests.
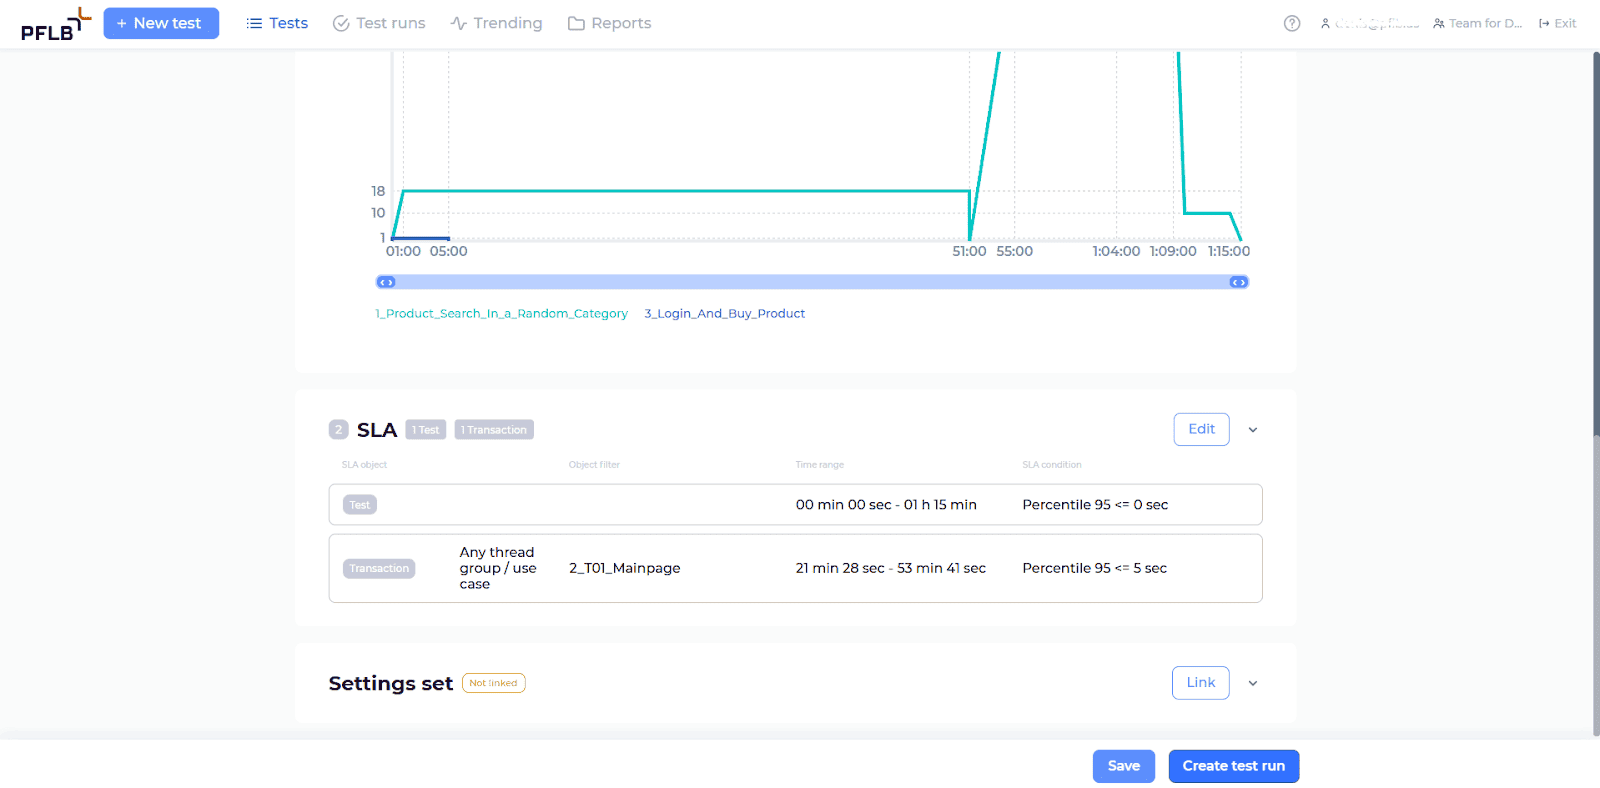
Once satisfied, you’re ready to run your performance test in PFLB.
Step 4: Launch and Monitor Your Test
Click on “Create test run” at the bottom-right of the test setup page.
In the pop-up, you can optionally:
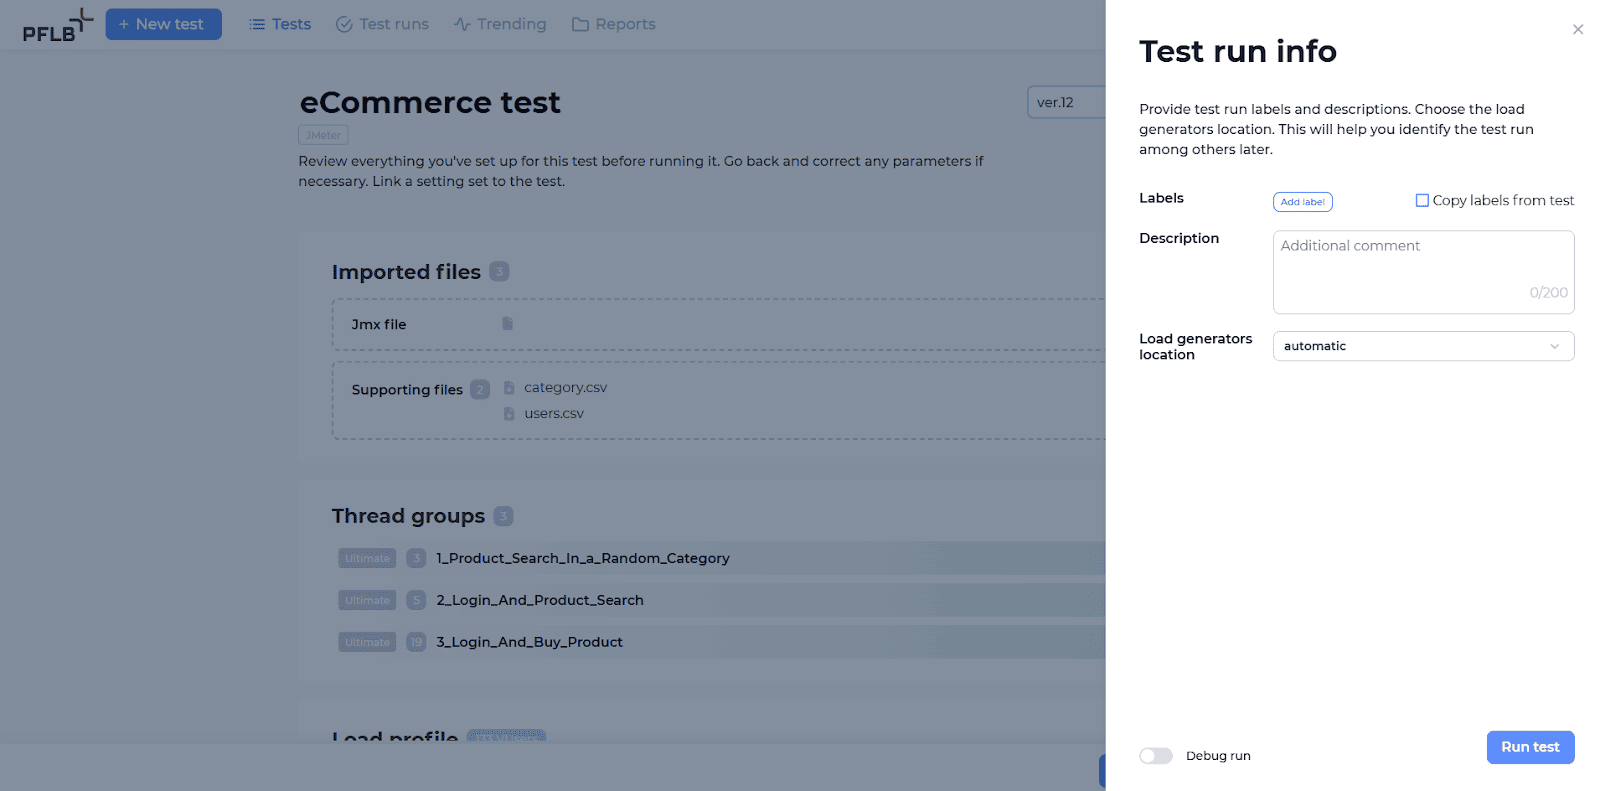
- Add labels for easier identification later.
- Specify load generator location (or leave it as automatic).
- Click “Run test” to start your test.
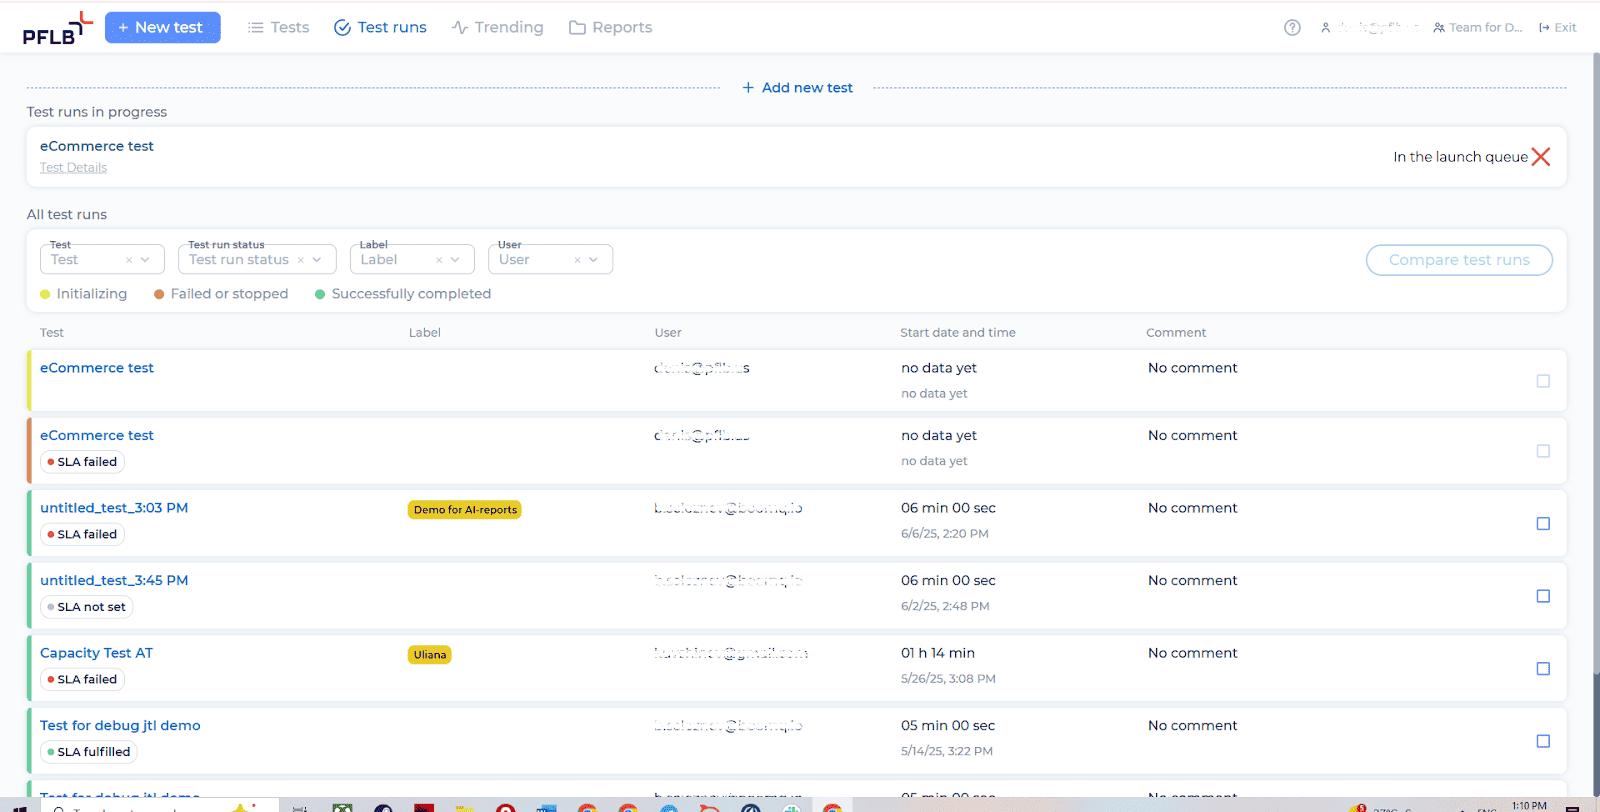
You can then track the test’s status and progress in real-time from the Test runs page.
Step 5: Generate and Access Your AI Report
Once your test run is completed, follow these steps to generate your AI-powered report:
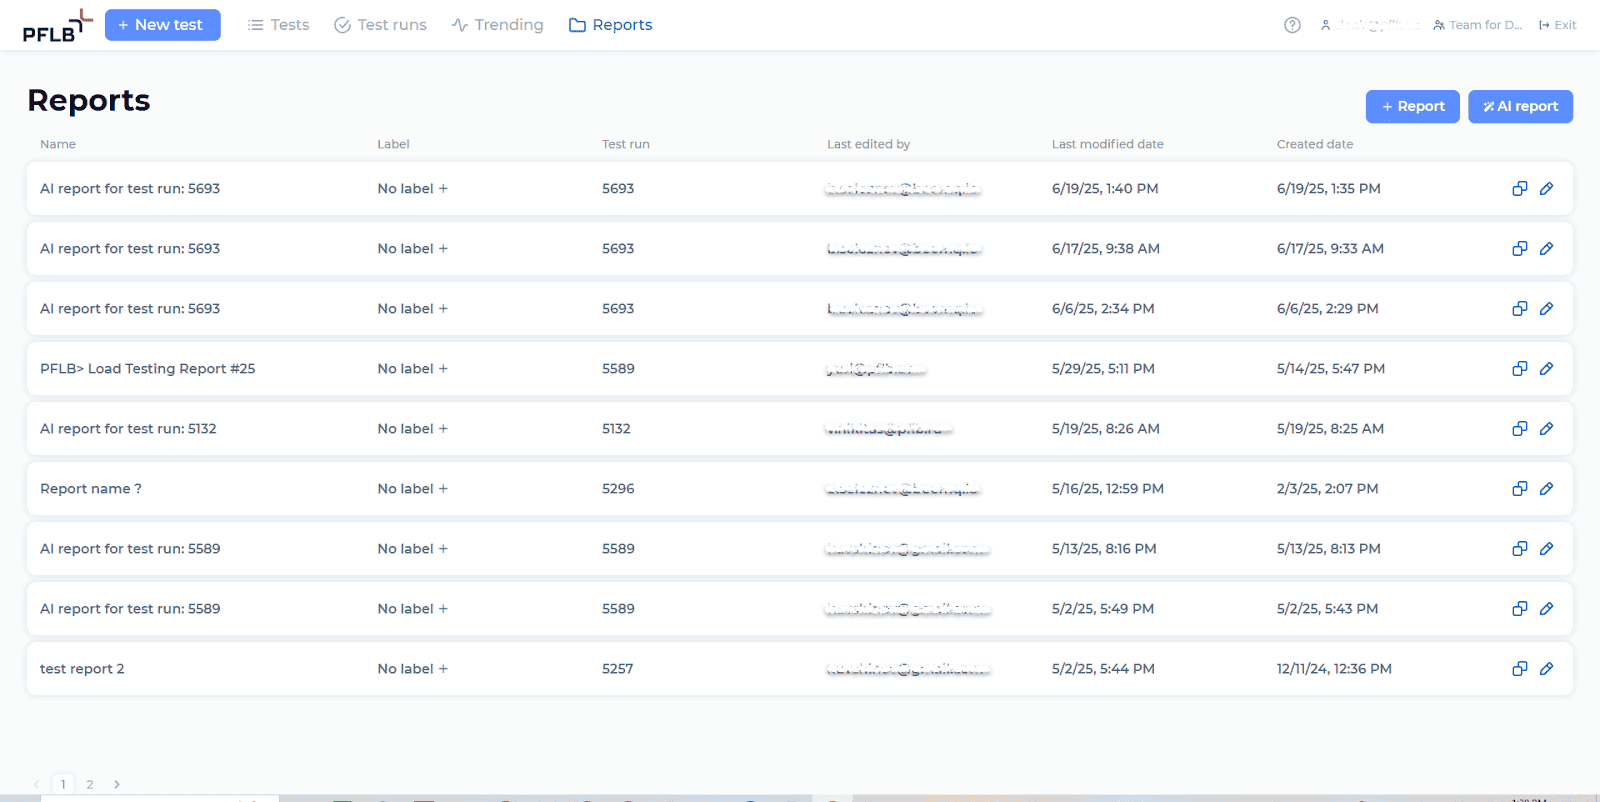
Click on the “Reports” tab at the top of your screen.
On the Reports page, click the “AI report” button.
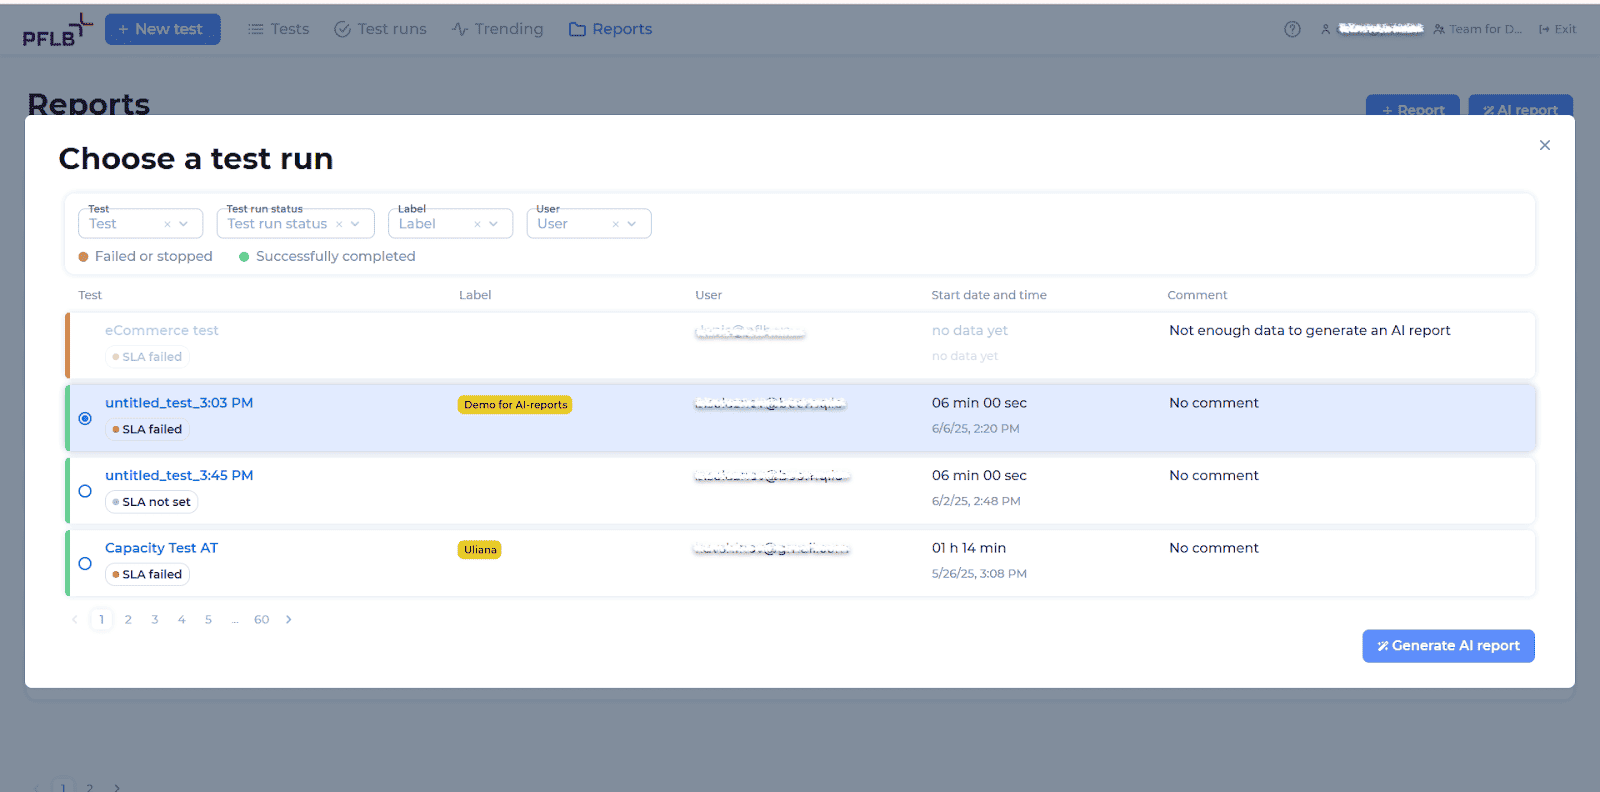
From the pop-up window, select the completed test run you want a report for, then click on “Generate AI report”.
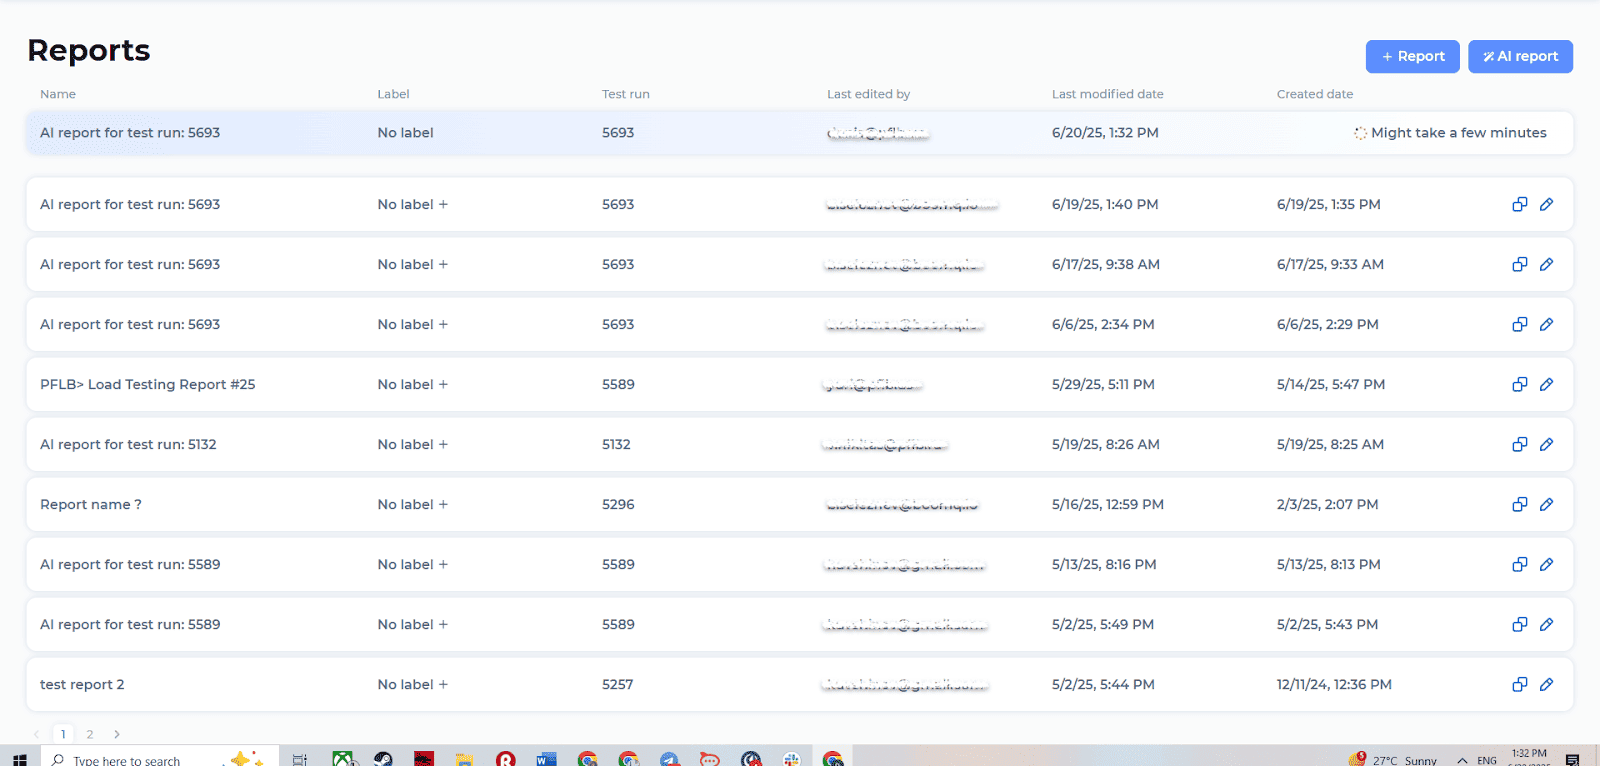
The platform will begin analyzing your test data automatically. This process may take a few minutes, during which you’ll see the status as “Might take a few minutes”.
Once your report is ready, you’ll receive a notification.Return to the “Reports” tab and find your newly created AI report in the list.
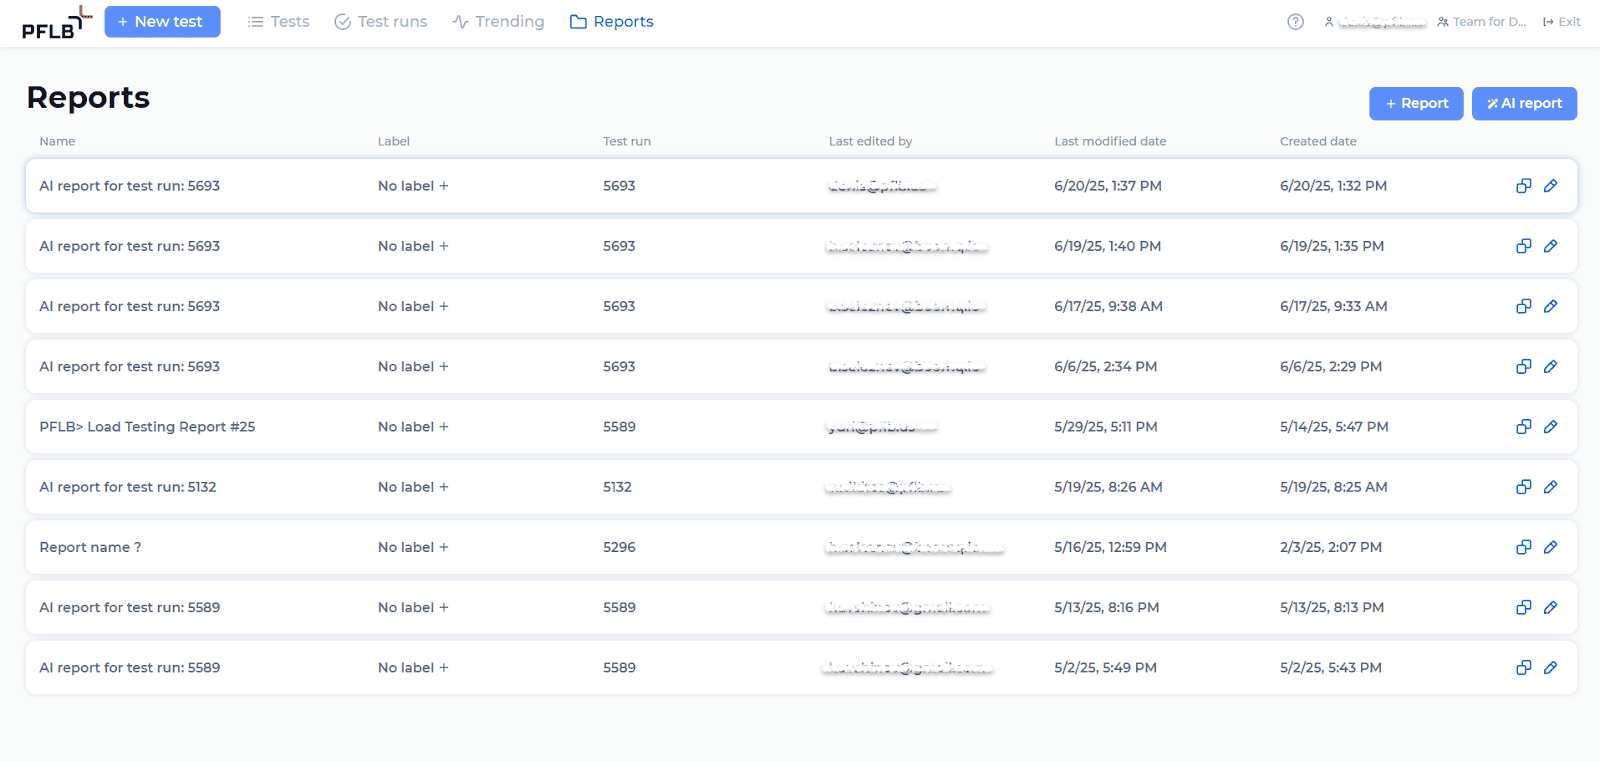
Click and open it.
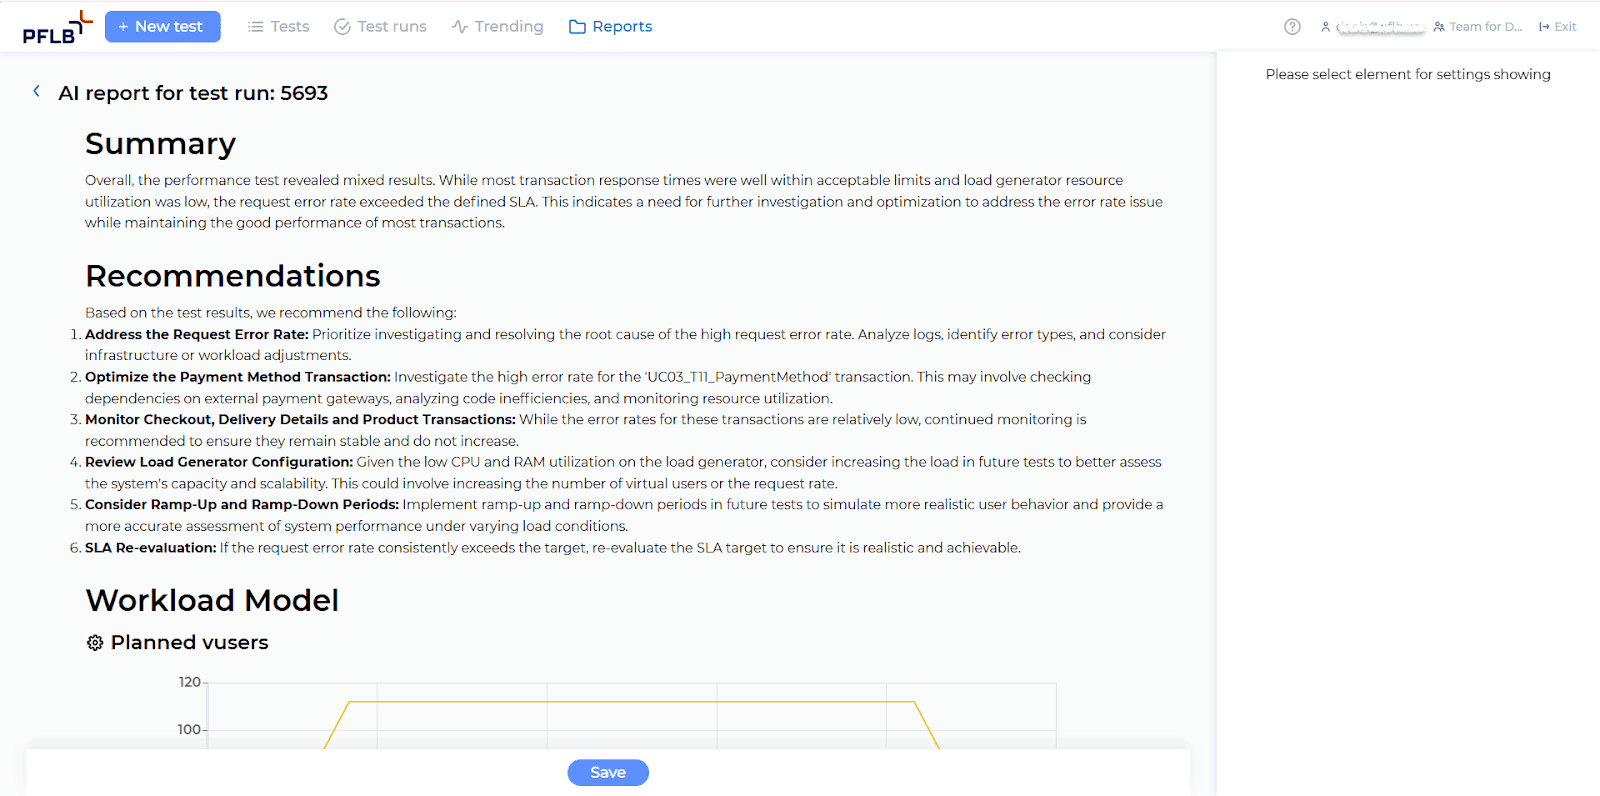
Your AI-generated performance analysis, complete with insights and recommendations, is now ready to review and share with your team. Read more about AI in Load Testing.