

At a glance
- Client: the OrioleDB team - a new storage engine built on top of PostgreSQL, aiming at improved scalability and modern storage models
- Their position: alpha status, with limited production guidance, and a need for objective evidence rather than claims
- What they needed the data for: quantifying gains and trade-offs against PostgreSQL, identifying bottlenecks that limit throughput or stability, and producing credible proof points for prospective users and investors
- Hardware, held identical for both engines: 4-core AMD EPYC, 64 GB RAM, 200 GB storage, same OS, same storage and network settings
- Workloads: TPC-C via BenchBase (New-Order, Payment, Order-Status, Delivery, Stock-Level) plus pgBench in two scenarios - read-only SELECT, and mixed INSERT + UPDATE + SELECT
- Execution: 10-minute runs, four to five iterations per scenario, with query-level statistics pulled from pg_stat_statements
- Headline finding: demonstrable strength in read performance, alongside identified bottlenecks affecting reliability and write throughput
- Reporting stance: observations documented without interpretation or prioritisation - the reports describe behaviour, they do not argue a case
Why an alpha engine commissions its own benchmark
OrioleDB is a storage engine built atop PostgreSQL with the aim of delivering improved scalability and modern storage models. It is also, at the time of this engagement, in alpha, with limited production guidance available to the people considering it.
That combination puts a project in an awkward position. The engine's own developers know where it is fast and where it is not, but their word is exactly the word that a prospective adopter - or an investor - will discount. What was missing was transparent, repeatable performance data across realistic workloads, gathered by someone with nothing riding on the result, so that the OrioleDB team could quantify performance gains and trade-offs relative to PostgreSQL, find the bottlenecks limiting throughput or stability under load, and put credible proof points in front of the people evaluating them.
The team went looking for an independent partner with a track record in impartial performance testing, and found PFLB through its published case studies. Three properties decided it: complete impartiality - engineers who favour no vendor or technology, with conclusions based entirely on measured data; a structured, repeatable methodology designed so any stakeholder can reproduce the results; and clear reporting that highlights strengths and weaknesses and leaves the reader with something straightforward to act on.
Scope of work
PFLB engineers planned and executed synthetic benchmarks as a performance benchmarking engagement, using two widely adopted tools:
- TPC-C simulation via BenchBase. This workload models a mixed transactional system with New-Order, Payment, Order-Status, Delivery and Stock-Level transactions. It exercises both read and write paths and is a standard for relational databases.
- pgBench, in two scenarios: a read-only workload (SELECT queries) and a mixed read-write workload (INSERT + UPDATE + SELECT). These micro-benchmarks isolate query-processing performance from the rest of the picture.
Both databases were deployed on identical virtual machines: 4-core AMD EPYC processors, 64 GB RAM, 200 GB of storage. Equal hardware is what makes the comparison mean anything - any difference the tests found has to come from the engines, not the environment.
Methodology
Environment. Consistent cloud-based infrastructure on virtual machines, with each DBMS instance on the same operating system, storage and network settings. Monitoring agents collected system-level metrics - CPU usage, RAM consumption, I/O throughput - and Docker-specific metrics where applicable.
Tools.
- BenchBase - a multi-threaded load generator capable of producing variable rates and transactional mixes, recording per-transaction latency and throughput.
- pgBench - the standard PostgreSQL benchmarking tool, running custom transaction scripts repeatedly and reporting transactions per second.
Execution.
- TPC-C tests ran for 10 minutes after the initial data loads, with four to five iterations per scenario for statistical validity - PFLB's standard practice on benchmark work.
- pgBench tests also ran for 10 minutes, with separate runs for the read-only and read-write scripts, each emulating multiple concurrent sessions.
- Throughout, engineers monitored CPU, memory, disk I/O and TPS on both systems, and collected query-level statistics from pg_stat_statements to surface long-running SQL statements.
What the reporting phase was designed to do - and not do
The reporting phase was built to document and structure the observations gathered during benchmarking, without interpreting the results or prioritising outcomes. The aim was to capture how each database behaves across different operational dimensions under controlled, repeatable conditions, and leave the judgement to the reader.
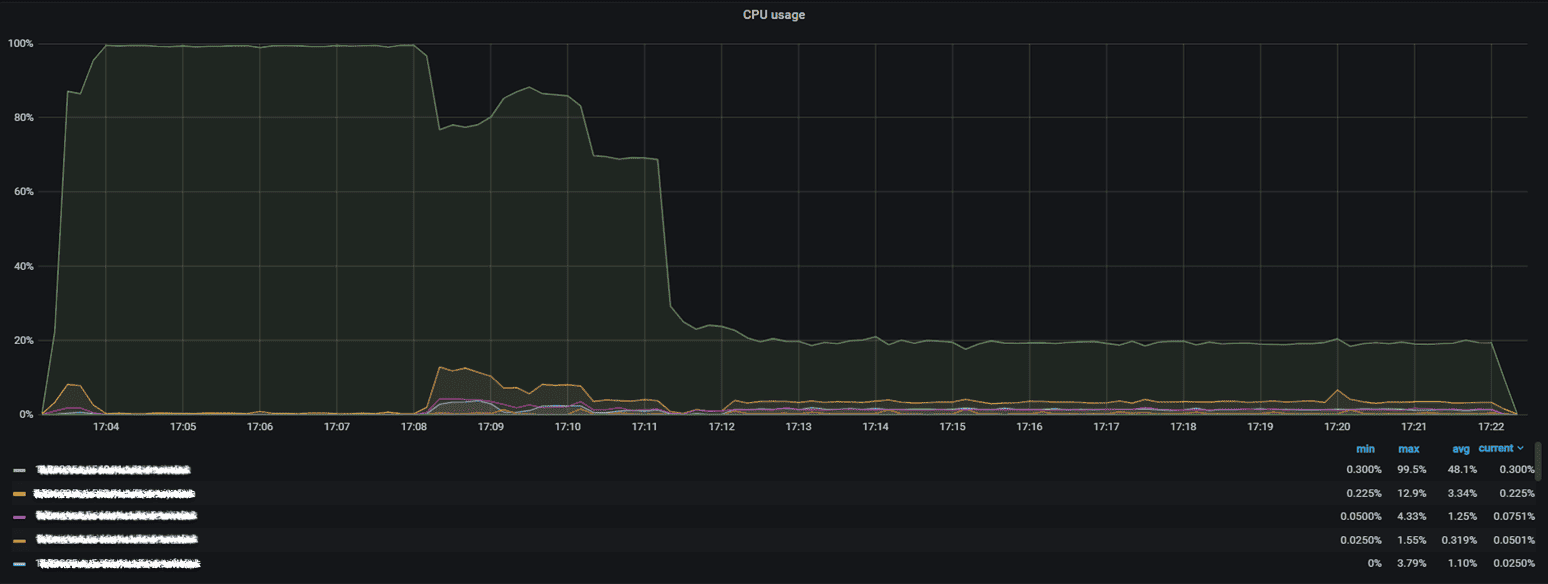
CPU under the first benchmark scenario: OrioleDB against vanilla PostgreSQL.
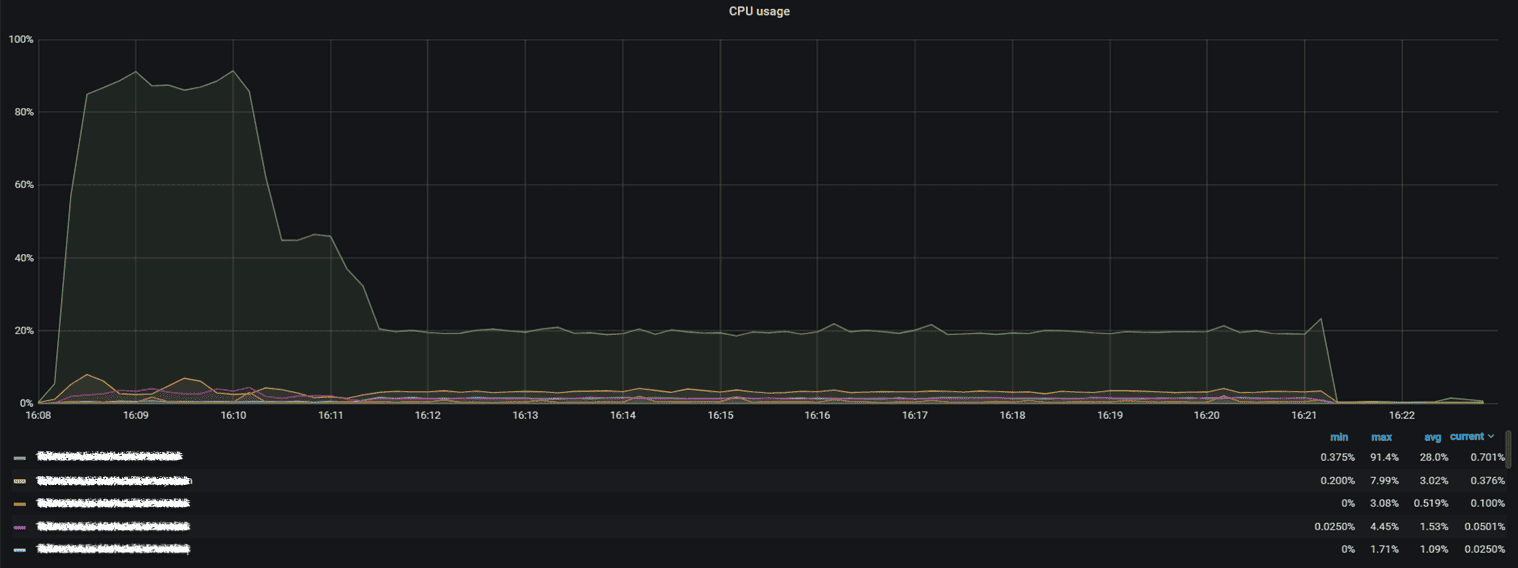
CPU under the second benchmark scenario.
The evaluation covered five dimensions:
- Stability and recovery behaviour - how each database responds to sustained load, error conditions and recovery scenarios, including responsiveness during stress, restart behaviour and recovery workflows triggered during benchmarking.
- CPU utilisation during critical phases - tracked throughout, with particular attention to intensive periods such as initial data population and sustained transactional execution.
- Database initialisation and load processes - the time and system behaviour involved in populating benchmark datasets, so bulk write activity during setup could be understood separately from steady-state work.
- Transaction throughput after initialisation - steady-state transaction processing once datasets were fully loaded, measured independently of initialisation overhead.
- Read-only and mixed workload execution - kept as separate scenarios, so behaviour under different access patterns could be distinguished rather than averaged.
Monitoring ran consistently across both systems and every benchmark phase, capturing CPU and memory utilisation, load averages, context switches and disk I/O activity.
Unified reporting consolidated all of it into reports and comparison tables summarising transaction throughput, query execution characteristics and resource utilisation trends. The structure was deliberately built so stakeholders could independently review system behaviour, configurations and execution contexts without embedded interpretation or bias.
Results
- Clear performance benchmarks against PostgreSQL across multiple workloads - transactional, read-only and mixed - on identical hardware.
- Bottlenecks identified that affect reliability and write throughput, giving the OrioleDB team a concrete input into engineering priorities rather than a general sense that something needed work.
- Evidence of strengths, notably better read performance, in a form usable in marketing and investor communications precisely because it came from an unaffiliated party.
- Actionable recommendations for configuration tuning and further testing, drawn from PFLB's performance-engineering practice.
- As with PFLB's Chainguard Docker container benchmark, the client left with unbiased data to inform product decisions - able to keep improving the engine while articulating its advantages to the wider PostgreSQL community.
Questions this engagement answers
How do you produce benchmark evidence a sceptical reader will accept?
By removing every variable except the one under test and publishing the method: identical 4-core EPYC / 64 GB / 200 GB virtual machines, the same OS and storage and network settings, standard tools (BenchBase, pgBench), standard workloads (TPC-C, read-only and mixed pgBench), 10-minute runs, four to five iterations per scenario.
Should a benchmark report tell you what to conclude?
Not this one. The reporting phase was explicitly designed to document observations without interpreting results or prioritising outcomes - the value to an alpha-stage project is a record of behaviour that stakeholders can review themselves, including the parts that are unflattering.
What does a benchmark find that a single test run does not?
Behaviour across phases. Here the evaluation deliberately separated initialisation and bulk loading from steady-state transaction processing, and read-only from mixed workloads - which is how the write-path bottlenecks and the read-performance strength ended up as separate, usable findings rather than one blended average.
Why four to five iterations?
Because a single run of a database benchmark is a sample, not a measurement. Repeating each scenario is what makes the difference between the two engines attributable to the engines.
Benchmarking a database, an engine or a runtime?
If you need performance evidence that will be read by people who have every reason to doubt it - prospective users, investors, an engineering team choosing between you and the incumbent - the method has to be reproducible and the reporting has to survive contact with your weaknesses.