


At a glance
- System type: Oracle Siebel CRM - widely used by banks for its ready-made configurations (CallCenter, Finance, Loyalty Management)
- Scale of the problem: the circuit has 20+ integrations, so testing all of it is not an option - choosing what to test is the first engineering decision
- Traffic profile: opening one arbitrary page generates 90+ requests, and element identifiers change between releases
- The awkward part: the load profile often does not exist - on this engagement business analysts never provided one, so it was reconstructed from production logs
- What made it possible: several months of production logs, SQL analysis of the most frequent events, and Siebel Tools to map elements, tables, fields and relationships
- Emulation: third-party integrations (CDI, 3CRD, CFT, Maxoptra, MFMS) replaced by Java emulators; a bank stub for MFMS configured through Postman
Deciding what to test
Siebel is too large to test end to end, so the scope was drawn around what actually generates load: daytime and nighttime user traffic flow.
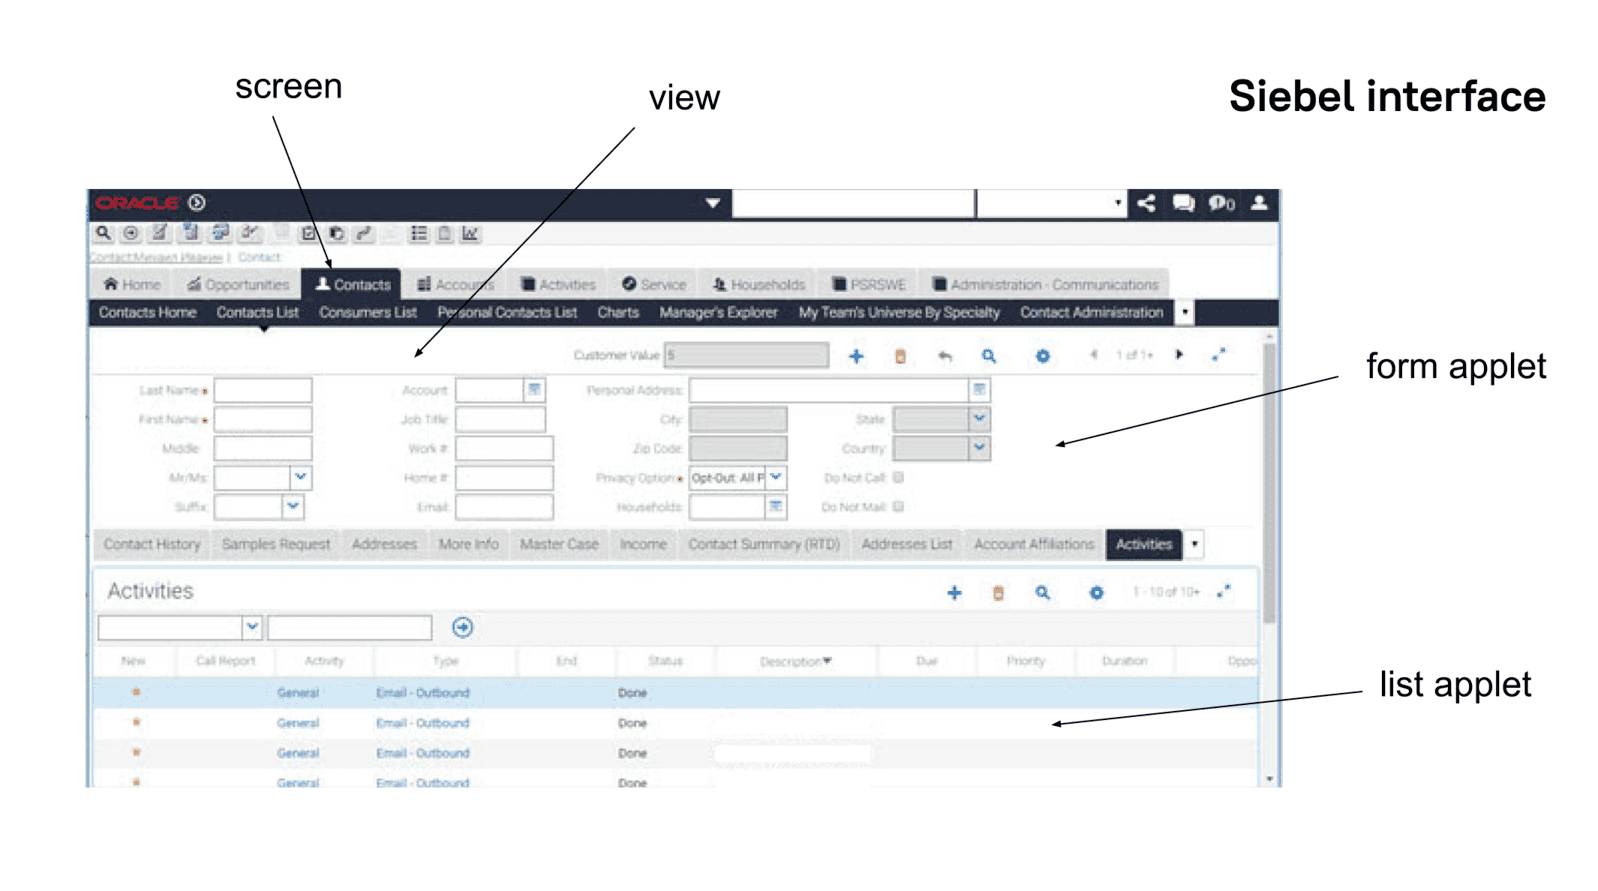
The Siebel CRM interface a load script has to reproduce.
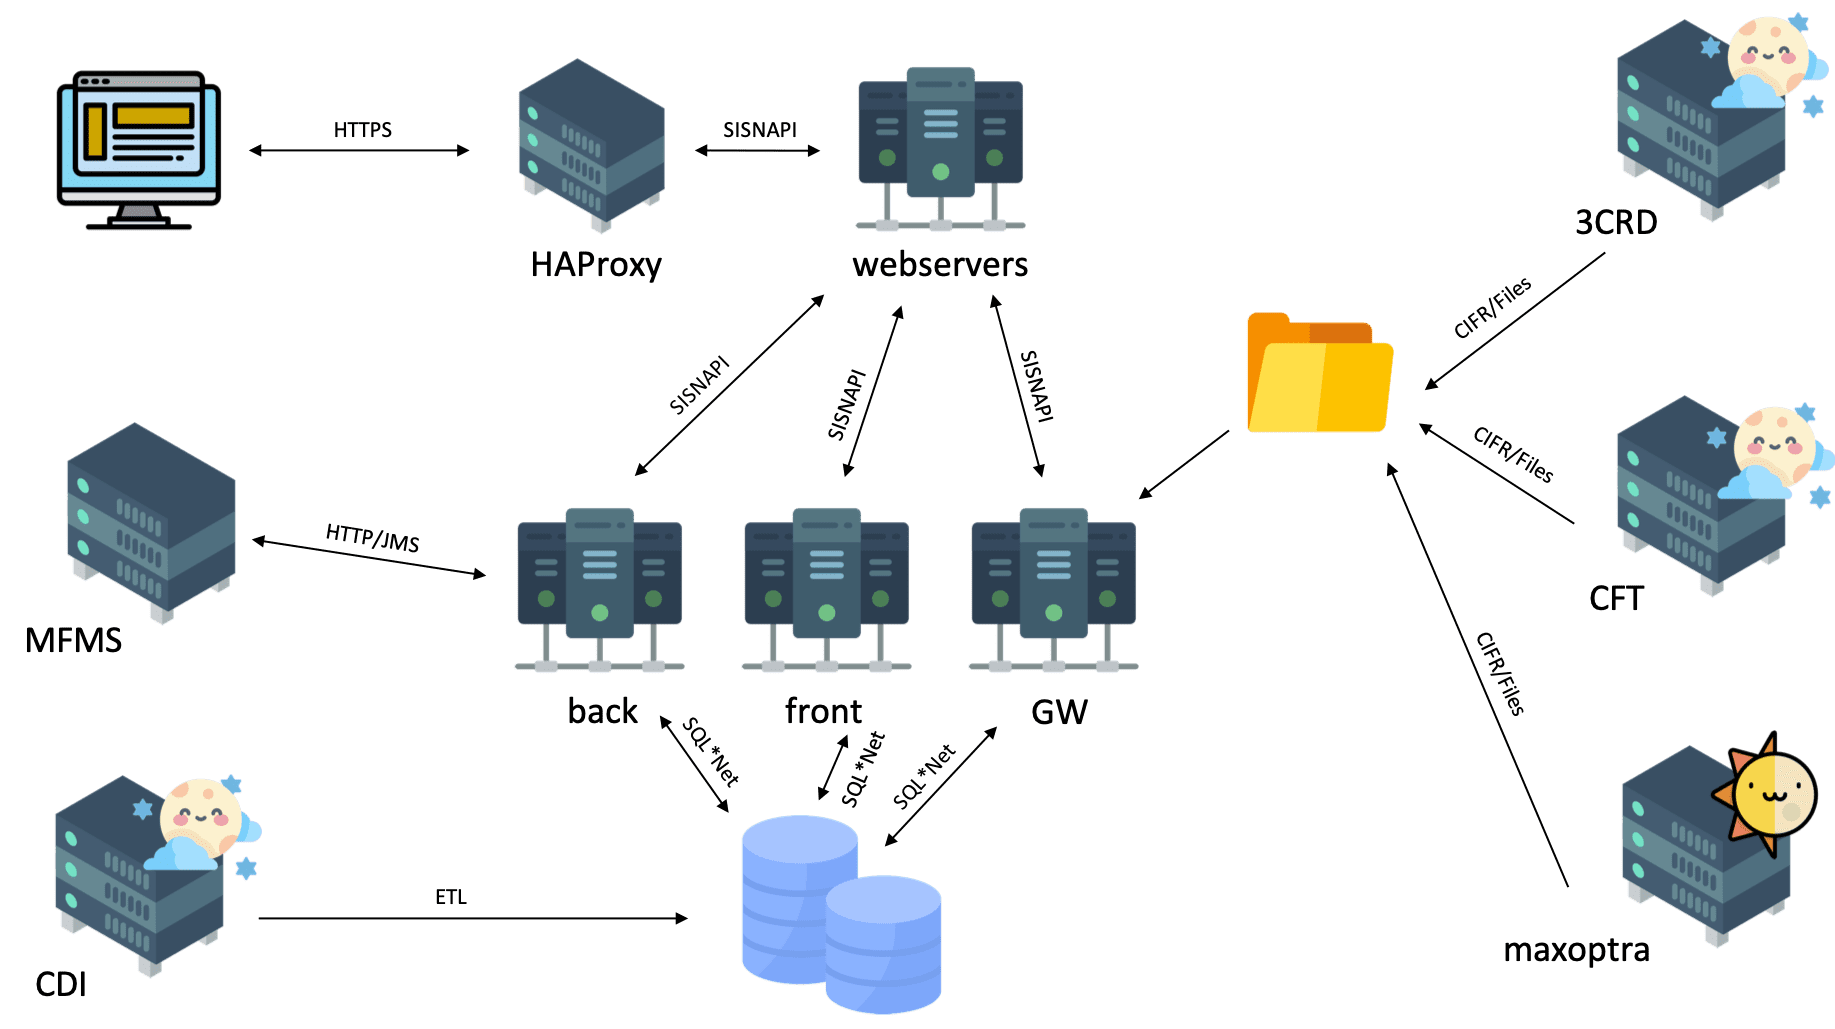
The part of the Siebel system selected for testing.
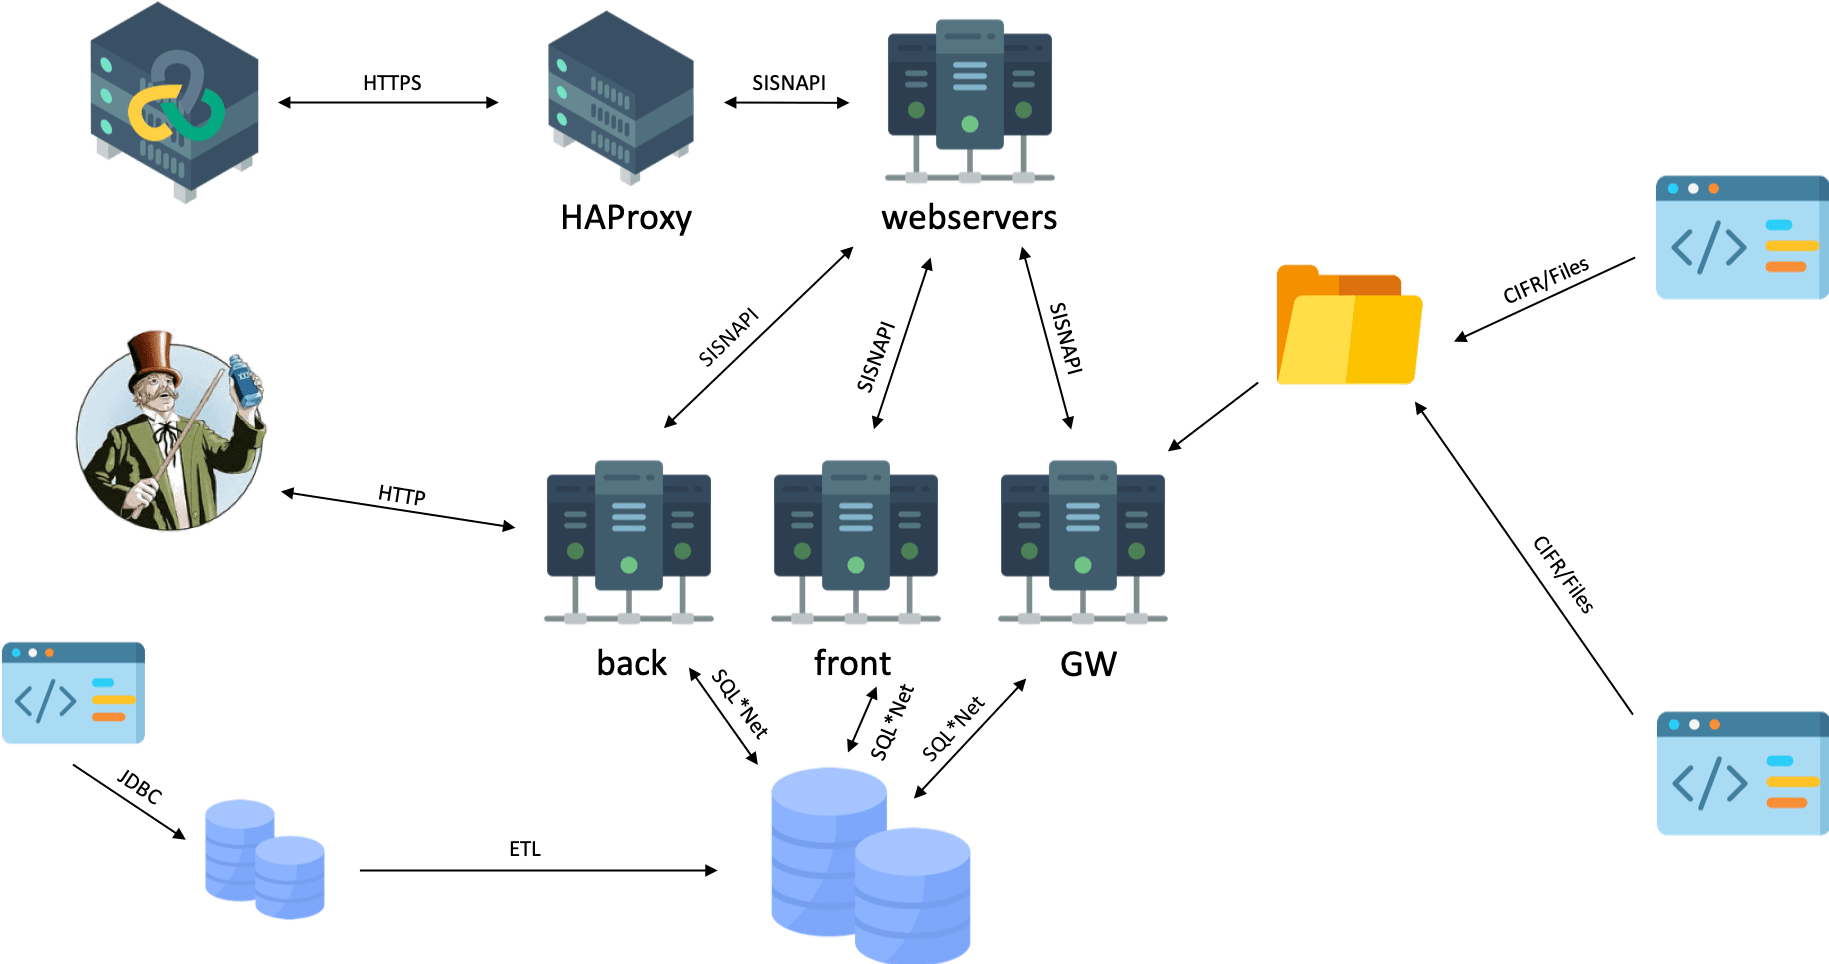
The testing solution, with emulators standing in for the integrations.
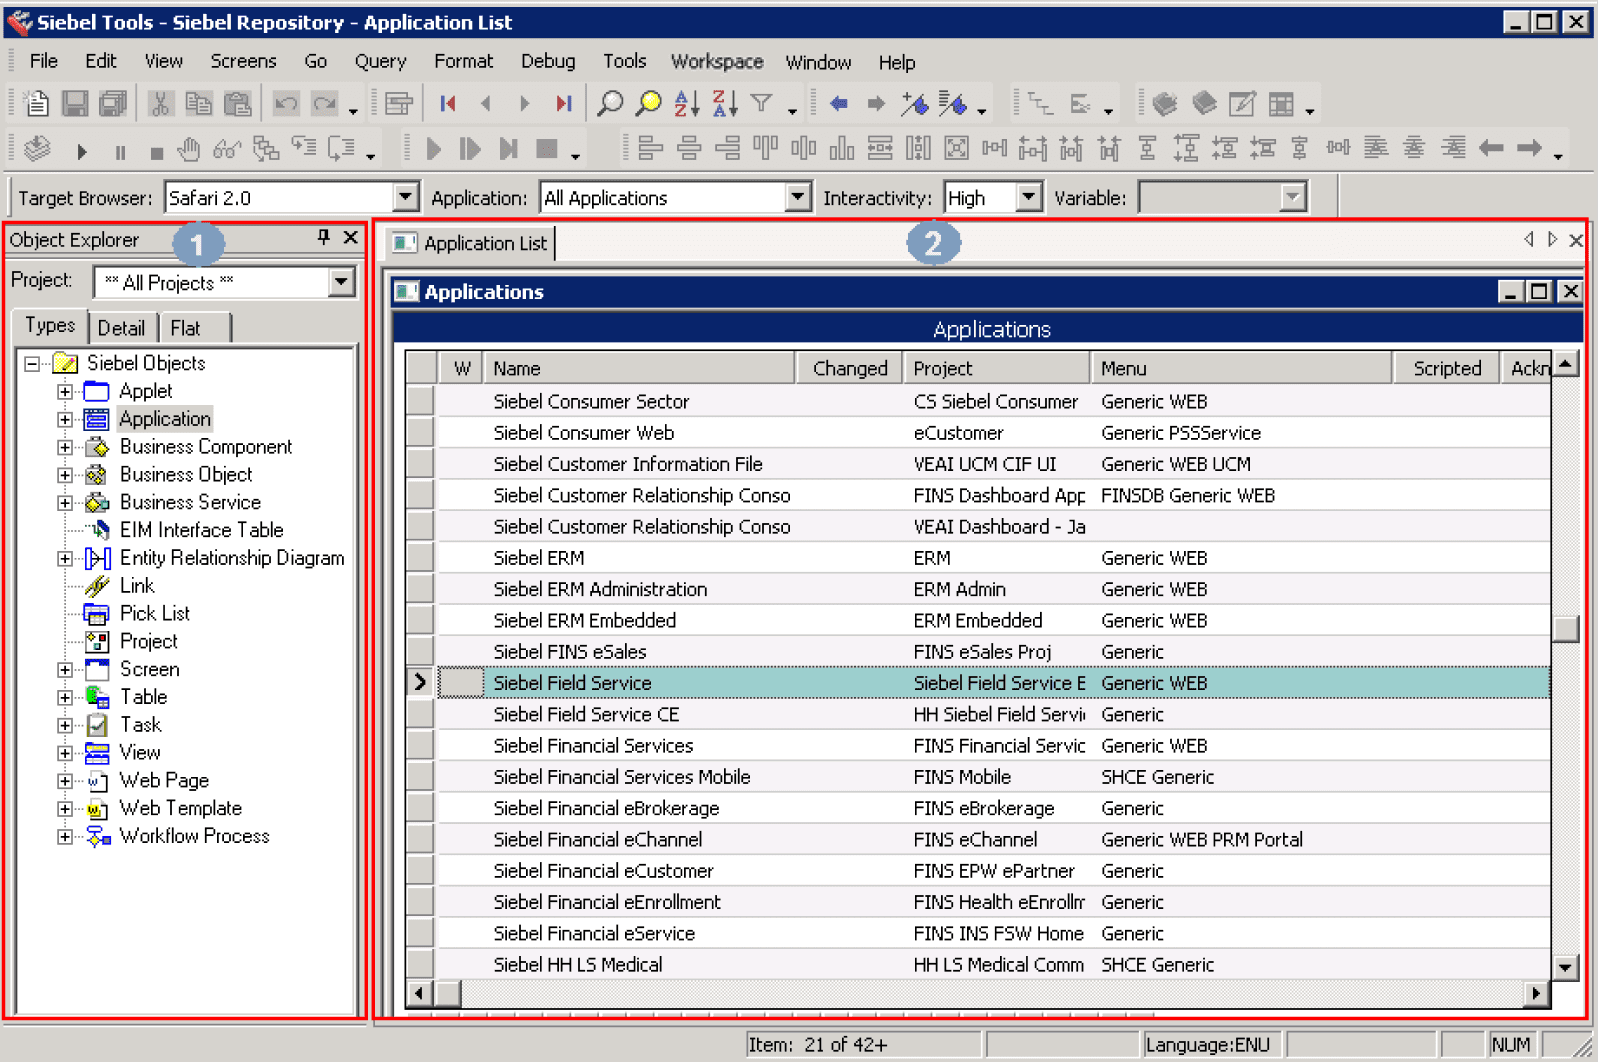
Siebel Tools: the application list a tester works through to find the objects a script has to address.
The path is straightforward - traffic reaches the web servers through a load balancer (HAProxy), then goes to application servers split into front, back and gateway roles, with the back servers also handling batch operations, all against an Oracle database.
The integrations were then added deliberately, because none of them were optional: CDI with multiple large tables, 3CRD and CFT (similar to CDI but smaller), Maxoptra for activity updates, and MFMS for messaging users. Each was replaced by a Java emulator of roughly similar structure; MFMS got a visible bank stub configured with Postman.
Reconstructing a load profile from nothing
Nighttime profile - the straightforward one. Take data from production, look at the uploads, find the 90th percentile, load the historical data, verify it behaves correctly.
Daytime profile - the real work. Production logs collected over several months were analysed with SQL to find which events happened most often and which applets people actually interacted with. Element names partly indicate where they sit in the interface, which helps turn raw events into usable scenarios. Where that was not enough, Siebel Tools provided the missing map: elements, tables, database fields and the relationships between them. Events were then ordered into business processes by their percentage of execution.
What the logs revealed that the documentation denied
The empirical approach produced an uncomfortable finding: real users performed operations the configuration said were impossible.
The customer's Siebel configuration stated that reports and documentation were not produced from the system. In practice, staff used Siebel to work with overdue debtors and found it convenient to export lists of those customers for calling. The bank's own experts did not know this was happening and initially denied it.
The tests were adjusted to match observed reality rather than the documented design - which is the entire argument for building profiles from logs rather than from interviews.
Practical rules for Siebel scripts
Field notes from doing this repeatedly:
- Enable conversion of page contents to UTF-8 before recording starts.
- Do not apply LoadRunner's automatic correlation that appears right after recording stops.
- Remove redundant field identifiers (`s_1_1_1_0` style) when they are empty or carry no meaningful uniqueness.
- Check every field you rely on - identical-looking functionality can invoke different events.
- SWE count - the click counter - must be incremented sequentially across iterations; it is not optional.
- `timestamp` is optional.
The recurring pain after each release is changing field ID values (of the `6*1-3RN2-9010*` kind), which is what makes automated recording and parameterisation worth the investment on any long-running Siebel engagement.
Testing results
- The daytime profile passed. Maximum performance came out above the agreed threshold and the system proved reliable under the load a normal working day produces.
- The night-time profile is where it broke. That window carries the technical operations - huge uploads, database integrations, back-server work - and the first run showed everything running slowly.
- The disk subsystem was the bottleneck, measured: request processing time reached 8 seconds, request execution time reached 910 ms, and the disk queue length reached 184.
- The documentation was wrong about the hardware. It recorded HDDs in production; production actually ran SSDs. Nobody had considered that the difference would matter to the result - which is exactly why a test environment is agreed against reality, not against a document.
Questions this engagement answers
Can you load test a whole Siebel installation?
No - with 20+ integrations the first decision is scope. Testing user traffic flow with emulated integrations gives usable answers; attempting the full circuit gives none.
What if there is no load profile and nobody will give you one?
Rebuild it from production logs. Several months of data, SQL over the most frequent events, and Siebel Tools to resolve which interface elements those events touch.
Why not trust the documented configuration?
Because users do things the configuration says they cannot. On this engagement the discovery was staff exporting debtor lists from a system documented as not producing reports.
Why does Siebel break scripts so often?
Element identifiers change between releases and a single page view generates 90+ requests, so manual correlation is both large and fragile - see the engagement where we automated it.
Facing a Siebel engagement?
The methodology above is not theoretical - it came from a bank credit approval system that ended up 2.5× faster with proven headroom for 10,000 users.