

At a glance
- Client: one of the largest banking systems in the world
- System under test: the customer cross-product profile (CCP) module of the bank's business support and development platform - the service that assembles a full picture of a client's products from every external subsystem
- Load: 15,000 TPS standard, 20,000–30,000 TPS in maximum-performance mode with all functions active
- Target response: 0.5 seconds from the request entering the enterprise service bus to the response returning to it
- Scale of the module: 16 application servers, 3 database servers (main plus an active standby), integrations with 6 external systems
- Cadence: a new release every two weeks, each one tested before it ships
- Tools: LoadRunner for load generation; JMX → Kafka → Druid → Grafana for monitoring
Why a platform this size is hard to test
The difficulty was never a single slow query. It was that nobody could hold the whole system in their head:
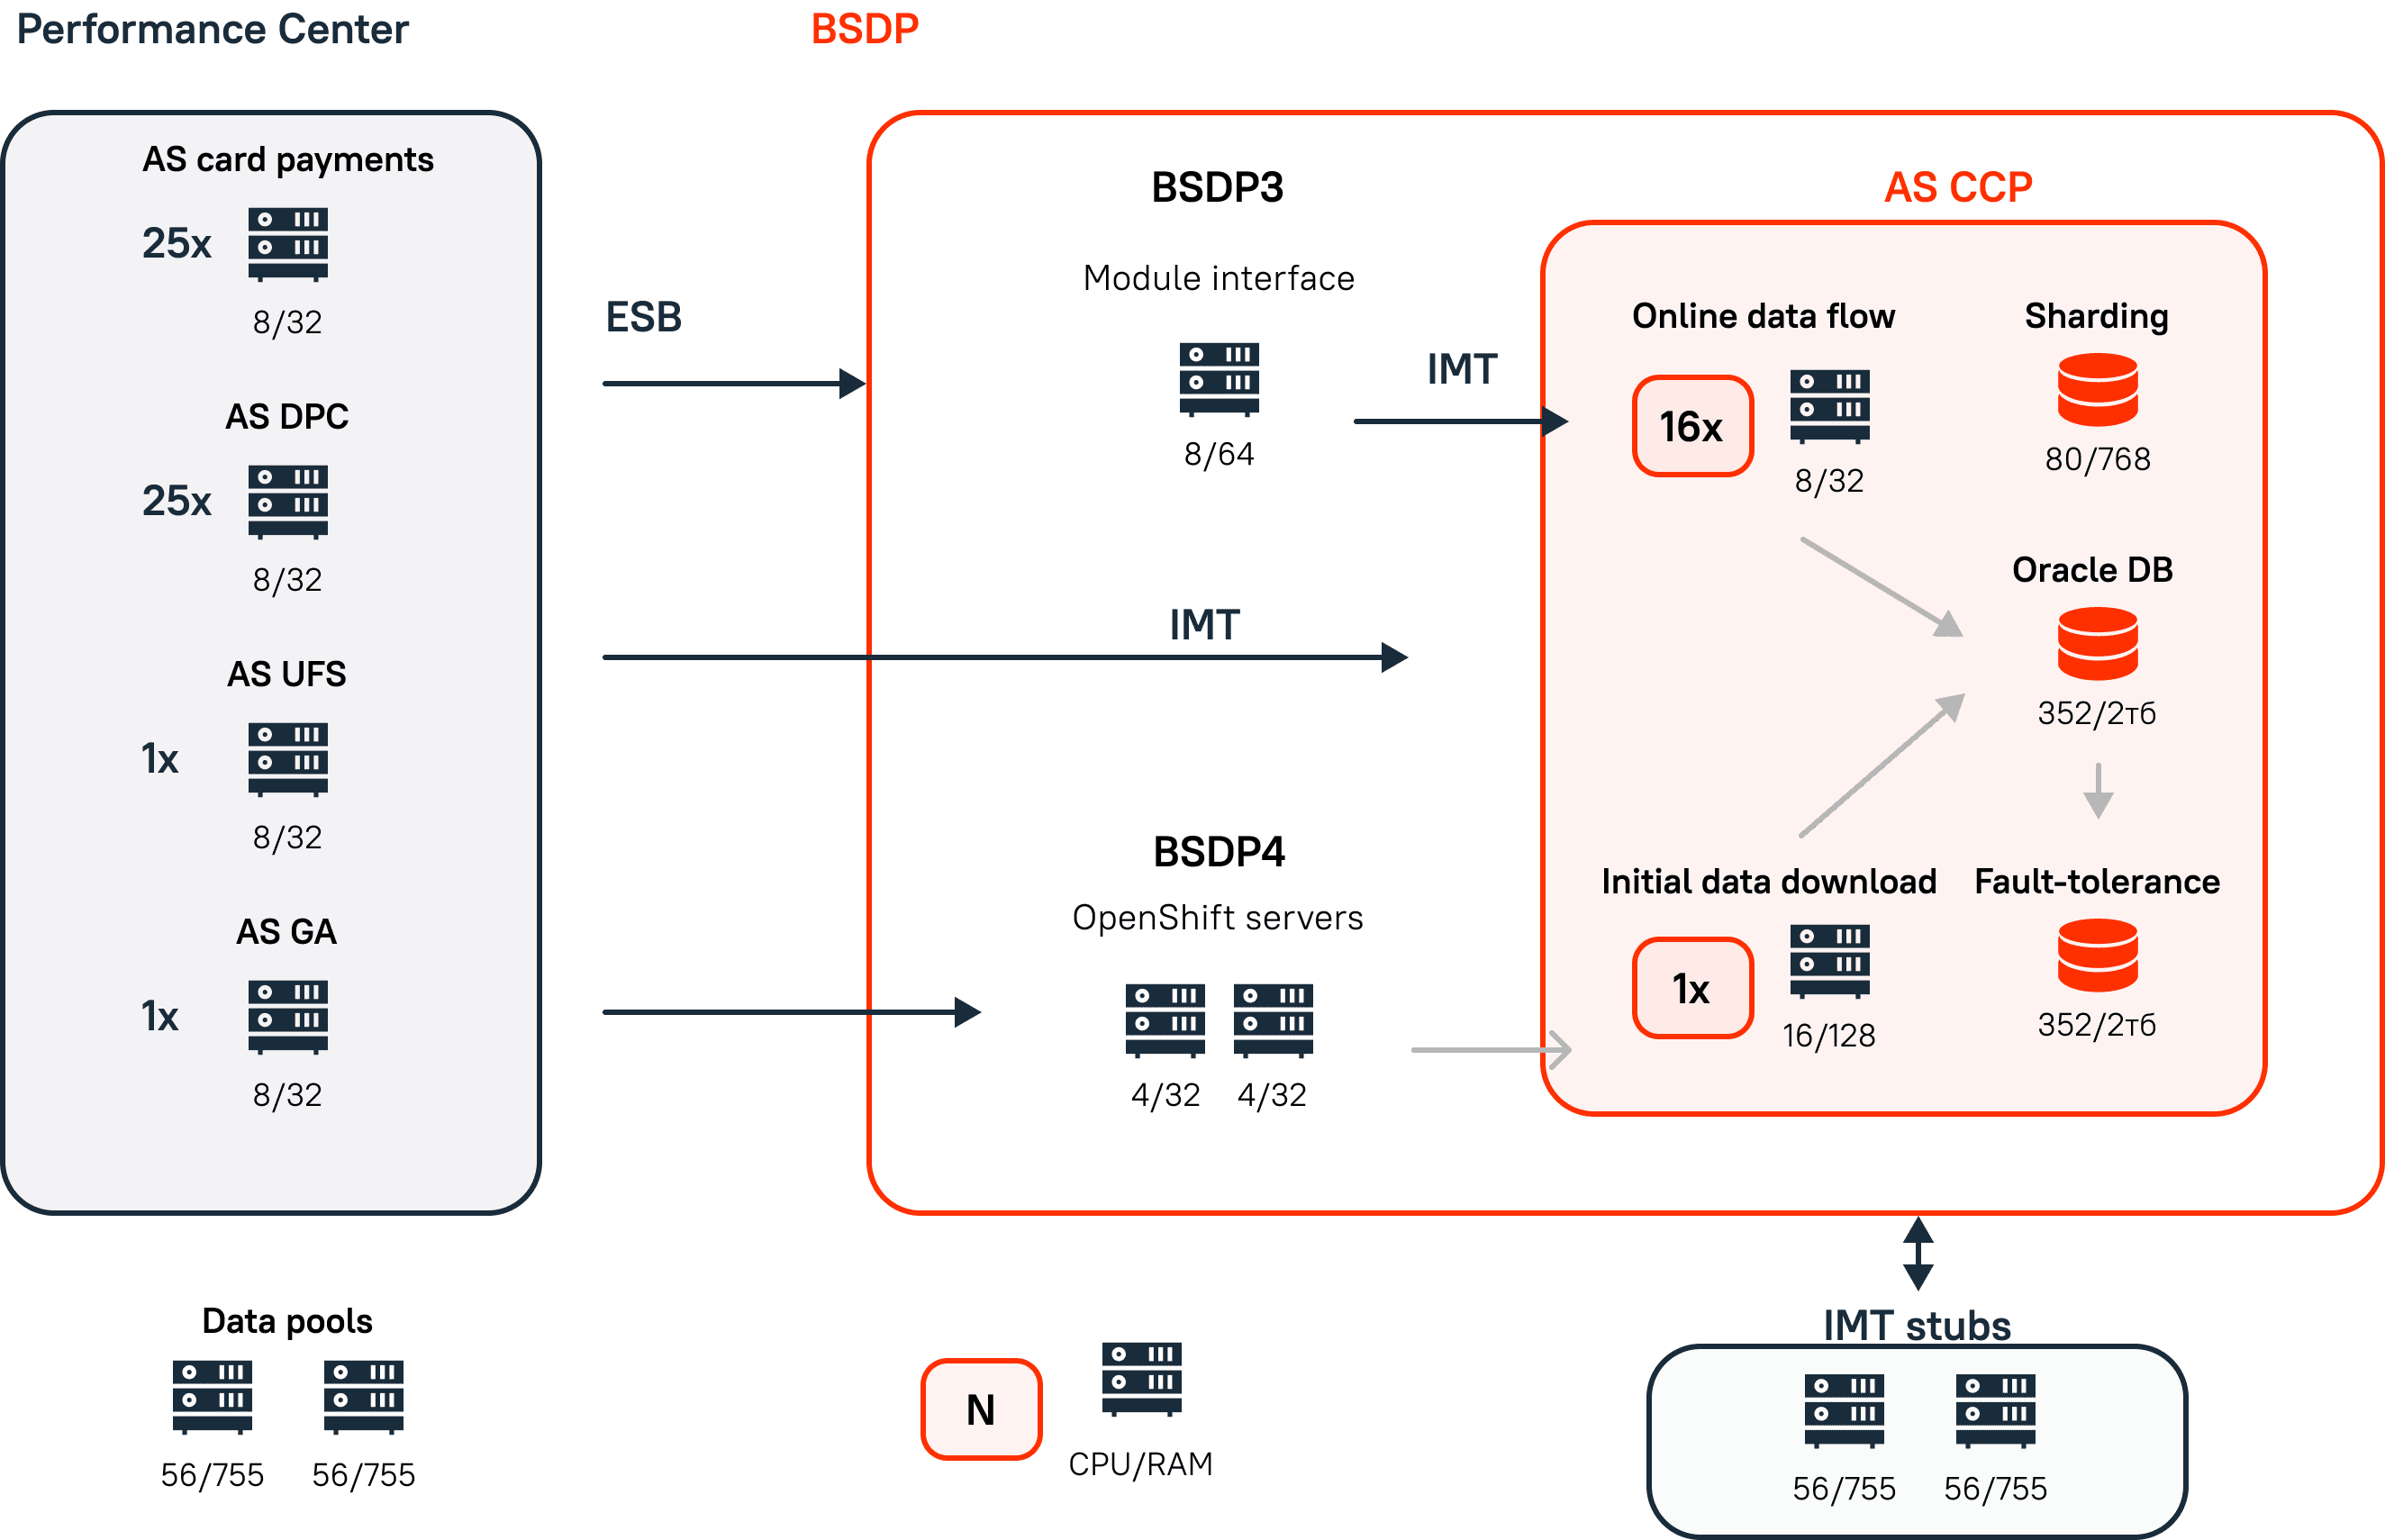
Figure 1. Configuration of the performance testing environment.
- the platform is massive and integrates with a large number of other bank systems
- it is built and maintained by many teams, scattered organisationally and geographically
- no individual had comprehensive knowledge of the system
- it spans a large number of servers, protocols and integrations
Some platform properties worked in our favour: over 100 standard ready-to-use services covering typical banking tasks, a micro-service architecture with horizontal scaling and no built-in load ceiling, and open technologies with no vendor lock-in.
What was tested, and at which level
The CCP module implements more than ten groups of functions. Performance testing targeted the most frequent and resource-intensive ones: loading data from external subsystems, synchronising data inside the module, forming the response for the consuming system, and the one-off data migration that runs when the module starts.
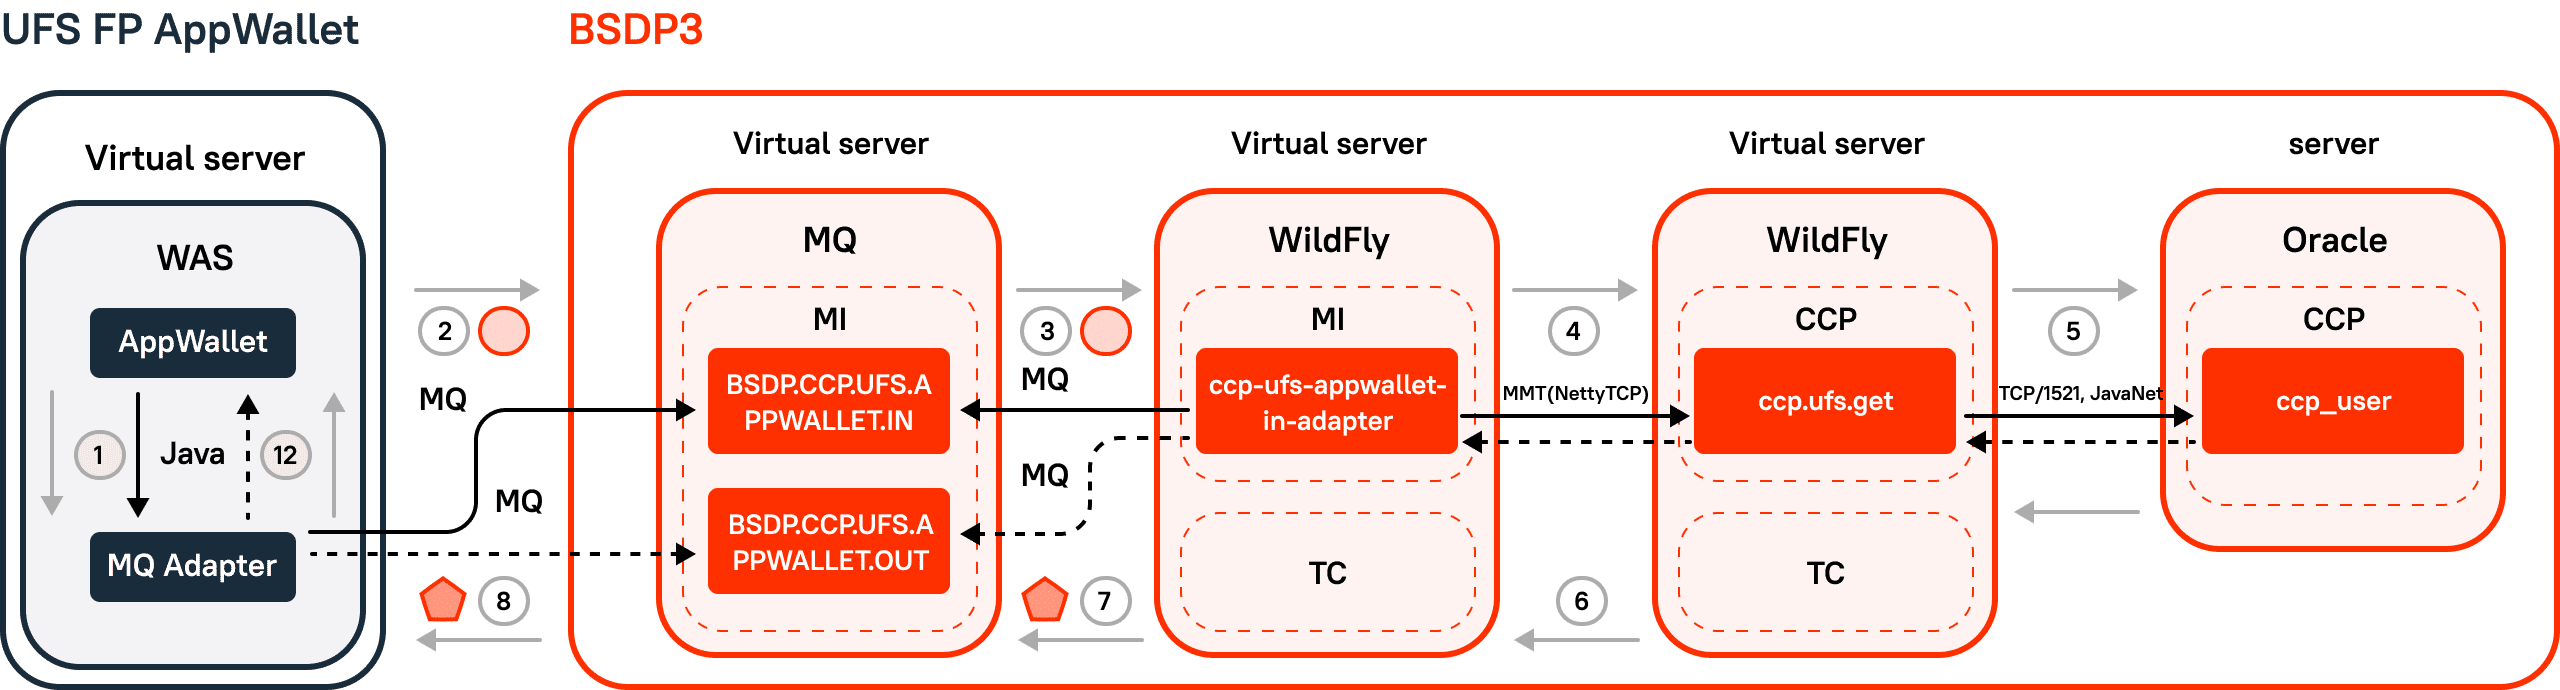
Figure 4. BSDP 3 architecture: IMT+MI.
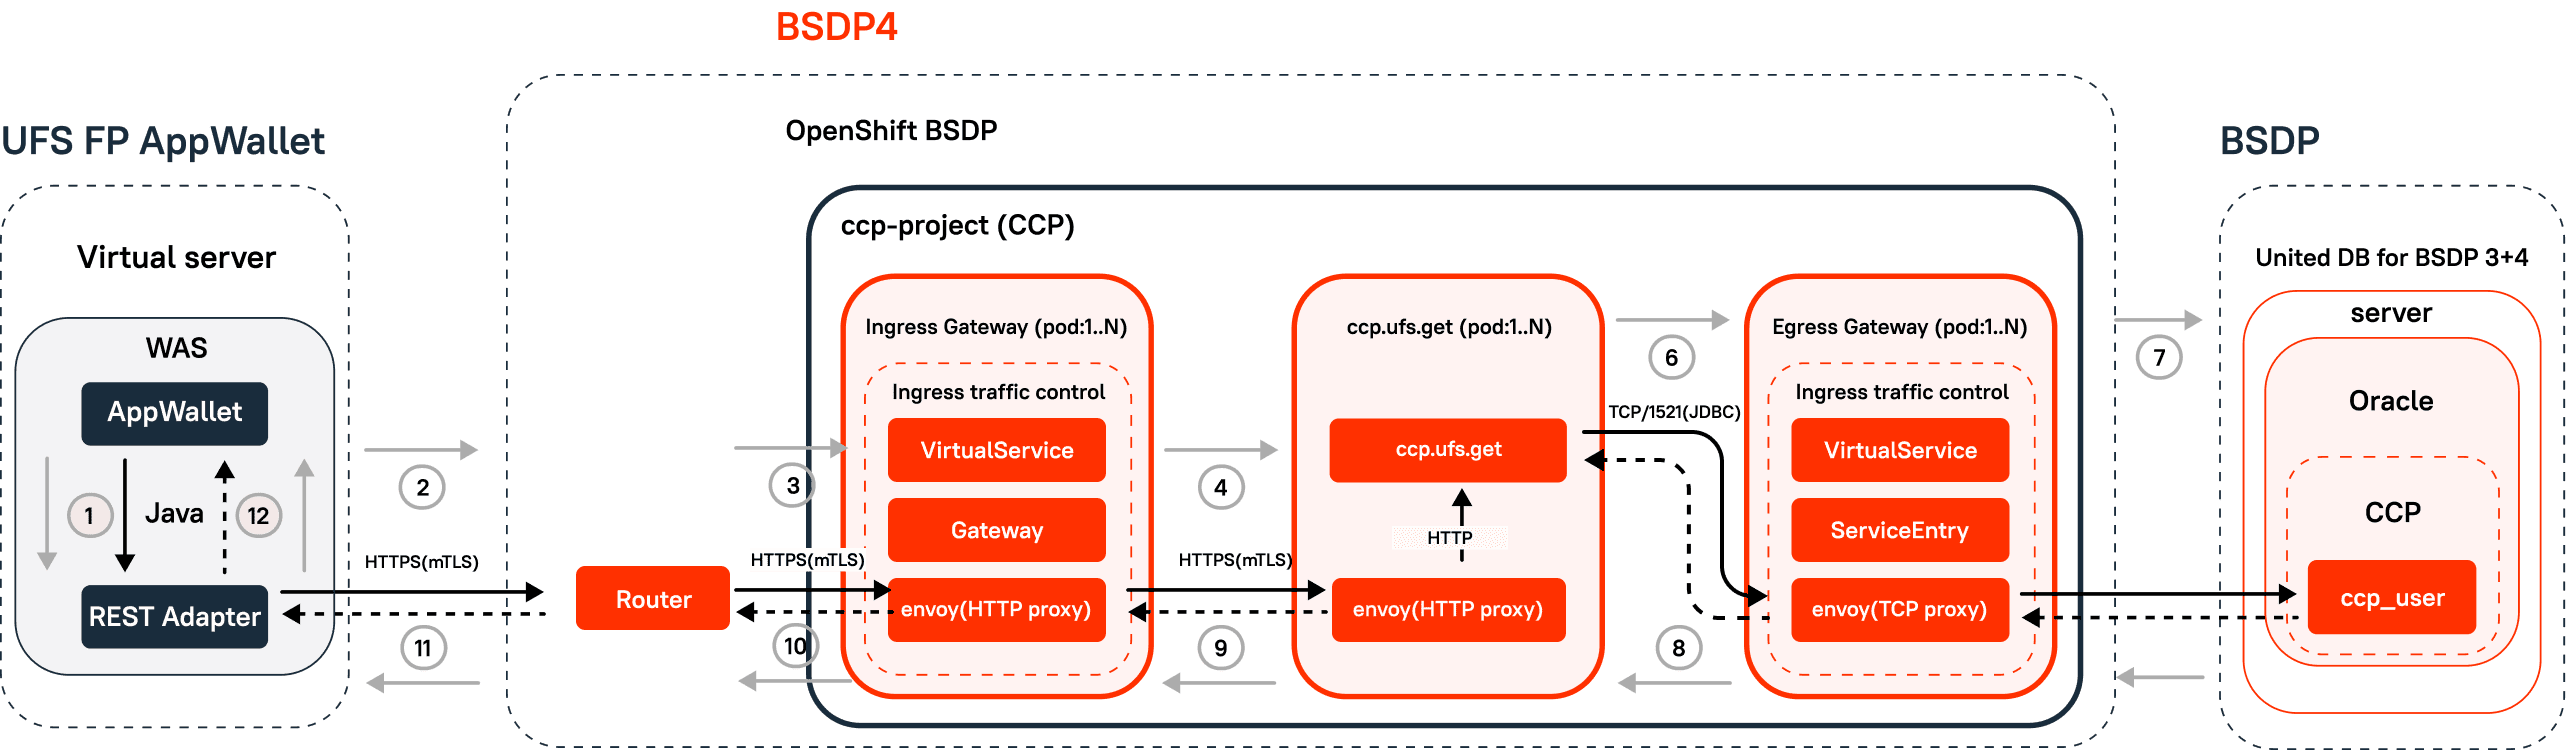
Figure 5. BSDP 4 architecture: OpenShift.
Testing ran at two architectural levels - the module level, where intermodule-transport requests are emulated to measure one module in isolation, and the integration level, where module-interface requests are emulated to measure how the interacting subsystems perform together.
Both generations of transport architecture were covered: the previous one, combining the module interface with intermodule transport, and the current OpenShift-based generation where applications run in pods, an additional pod launches once the utilisation limit is exceeded, and two arms handle load simultaneously.
The load profile was not invented - it was taken from production during the previous year's peak season, with performance targets set from real collected statistics.
The four modes a customer profile module has to survive
Each mode stresses the system differently, so each is tested:
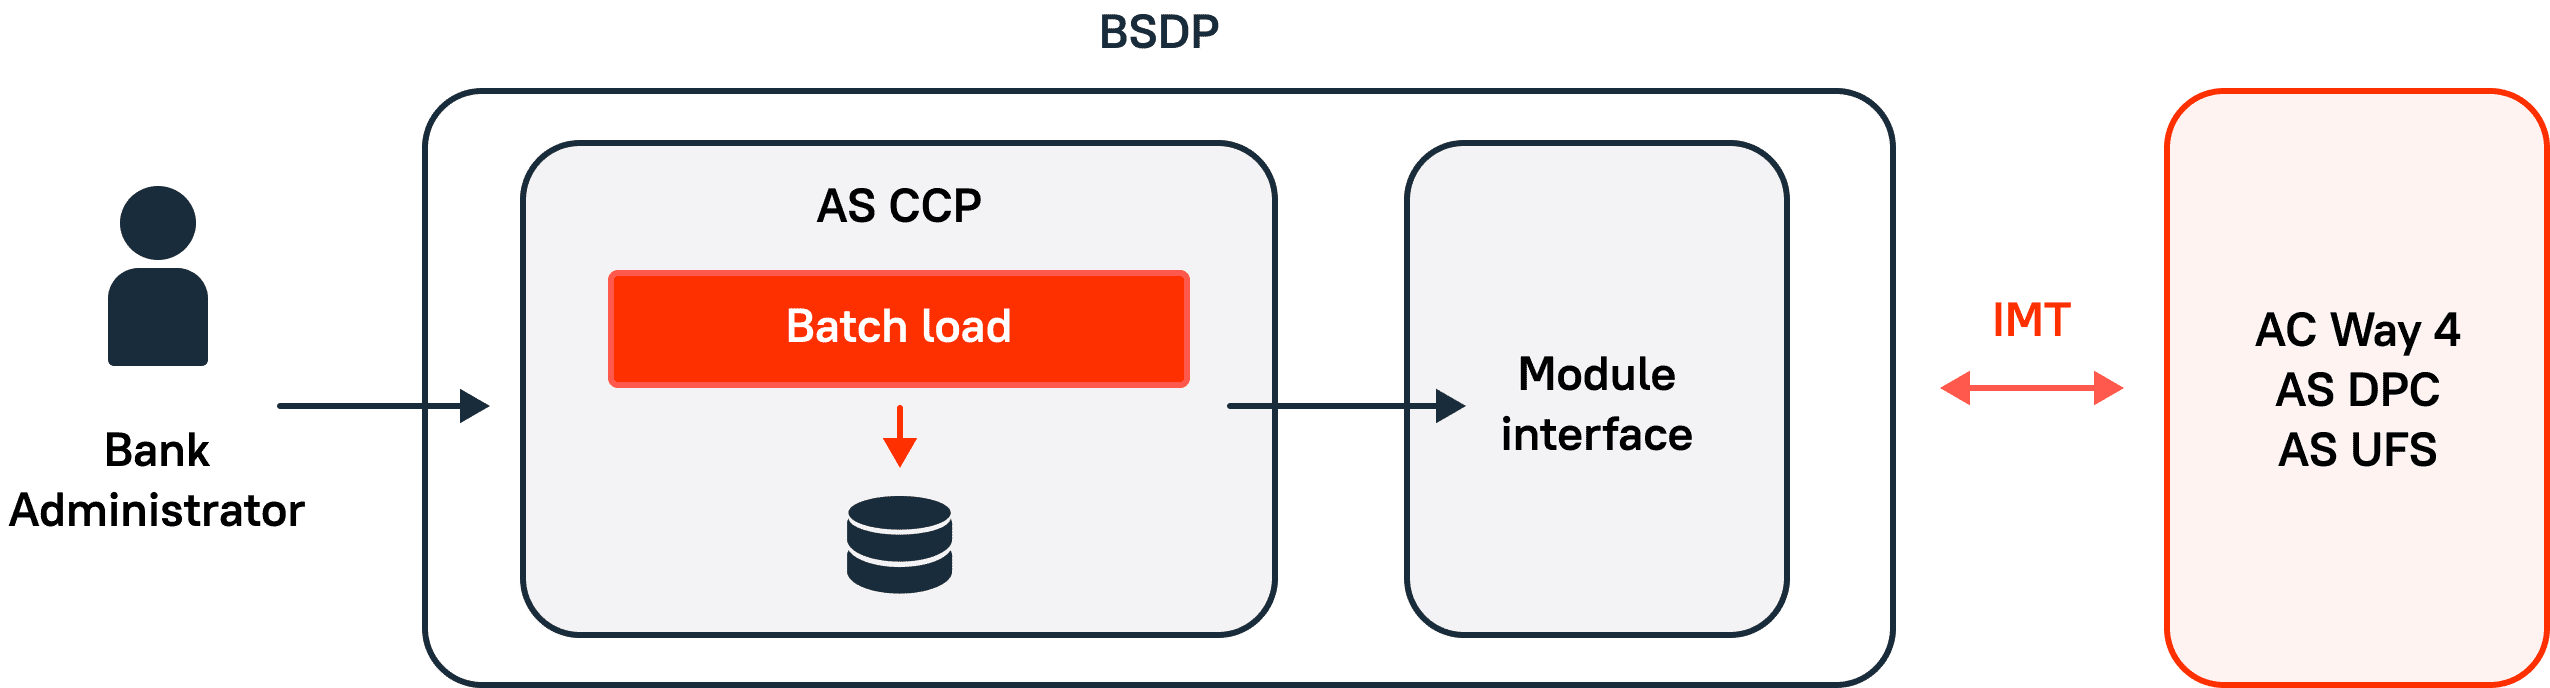
Figure 2. Initial data load into the CCP.
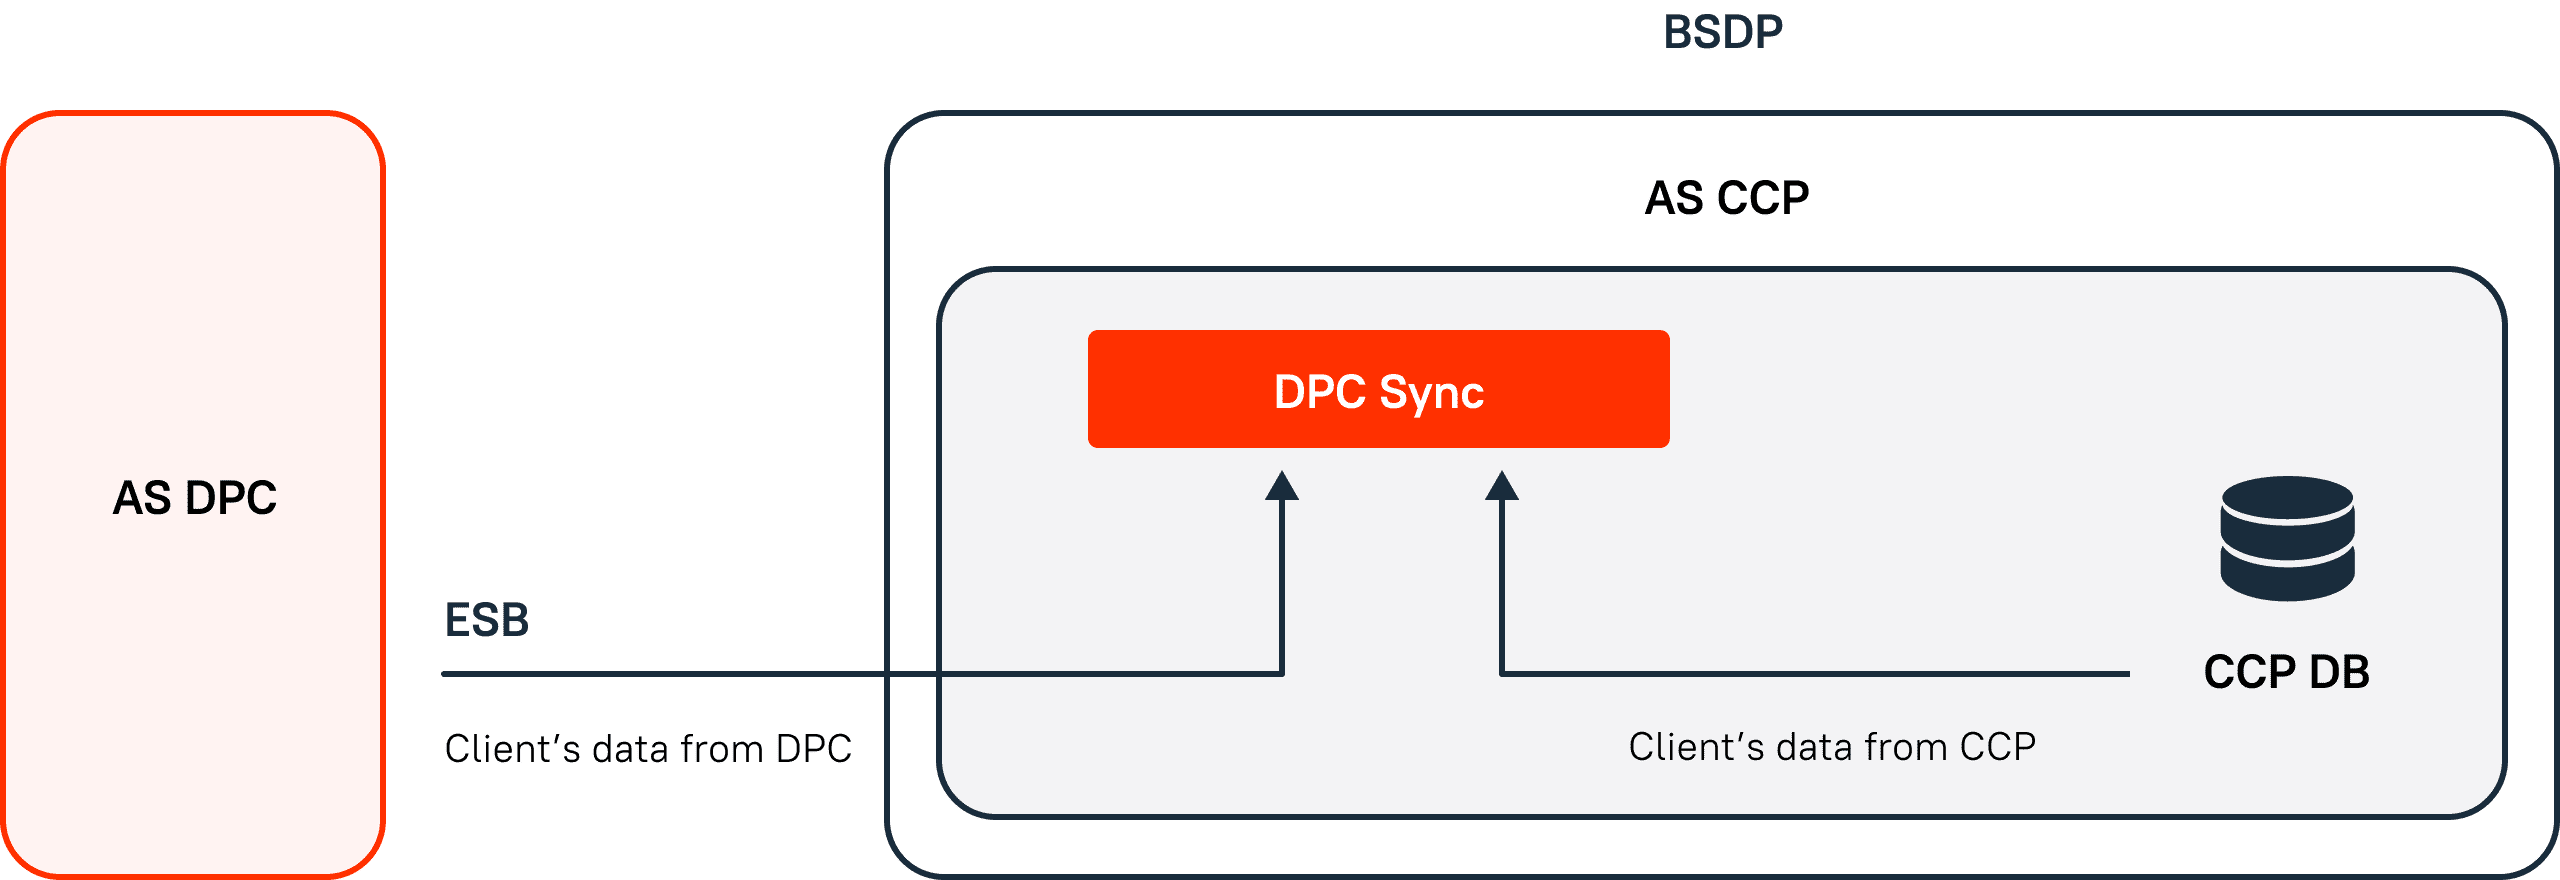
Figure 3. CCP data synchronization scheme.
- Module start - no client product data exists yet; a batch job copies it from external systems and builds the initial client file.
- Peak utilisation - external systems stream messages one at a time, updating the file built at start.
- Normal operation - the database is formed, data flows, individual records are refined.
- Data synchronisation - a mechanism checks CCP data against its sources, separately per external subsystem, running on errors, on creation, and in the background.
What we found and built
- Data pools became a bottleneck under load - their response time grows and the achievable load on the module drops with it. We built dedicated Spring applications that pre-load data from the CCP database into pools at start, so the load generator draws from prepared tables instead of competing for the database.
- Monitoring was extended from production into every test environment - system, development, integration, elevator, performance and acceptance testing - with JMX metrics aggregated by an agent, written to Kafka, read into Druid and visualised in Grafana.
- A dedicated server stubs the module's requests to external systems at the transport level, so a slow neighbour never distorts the module's own measurement.
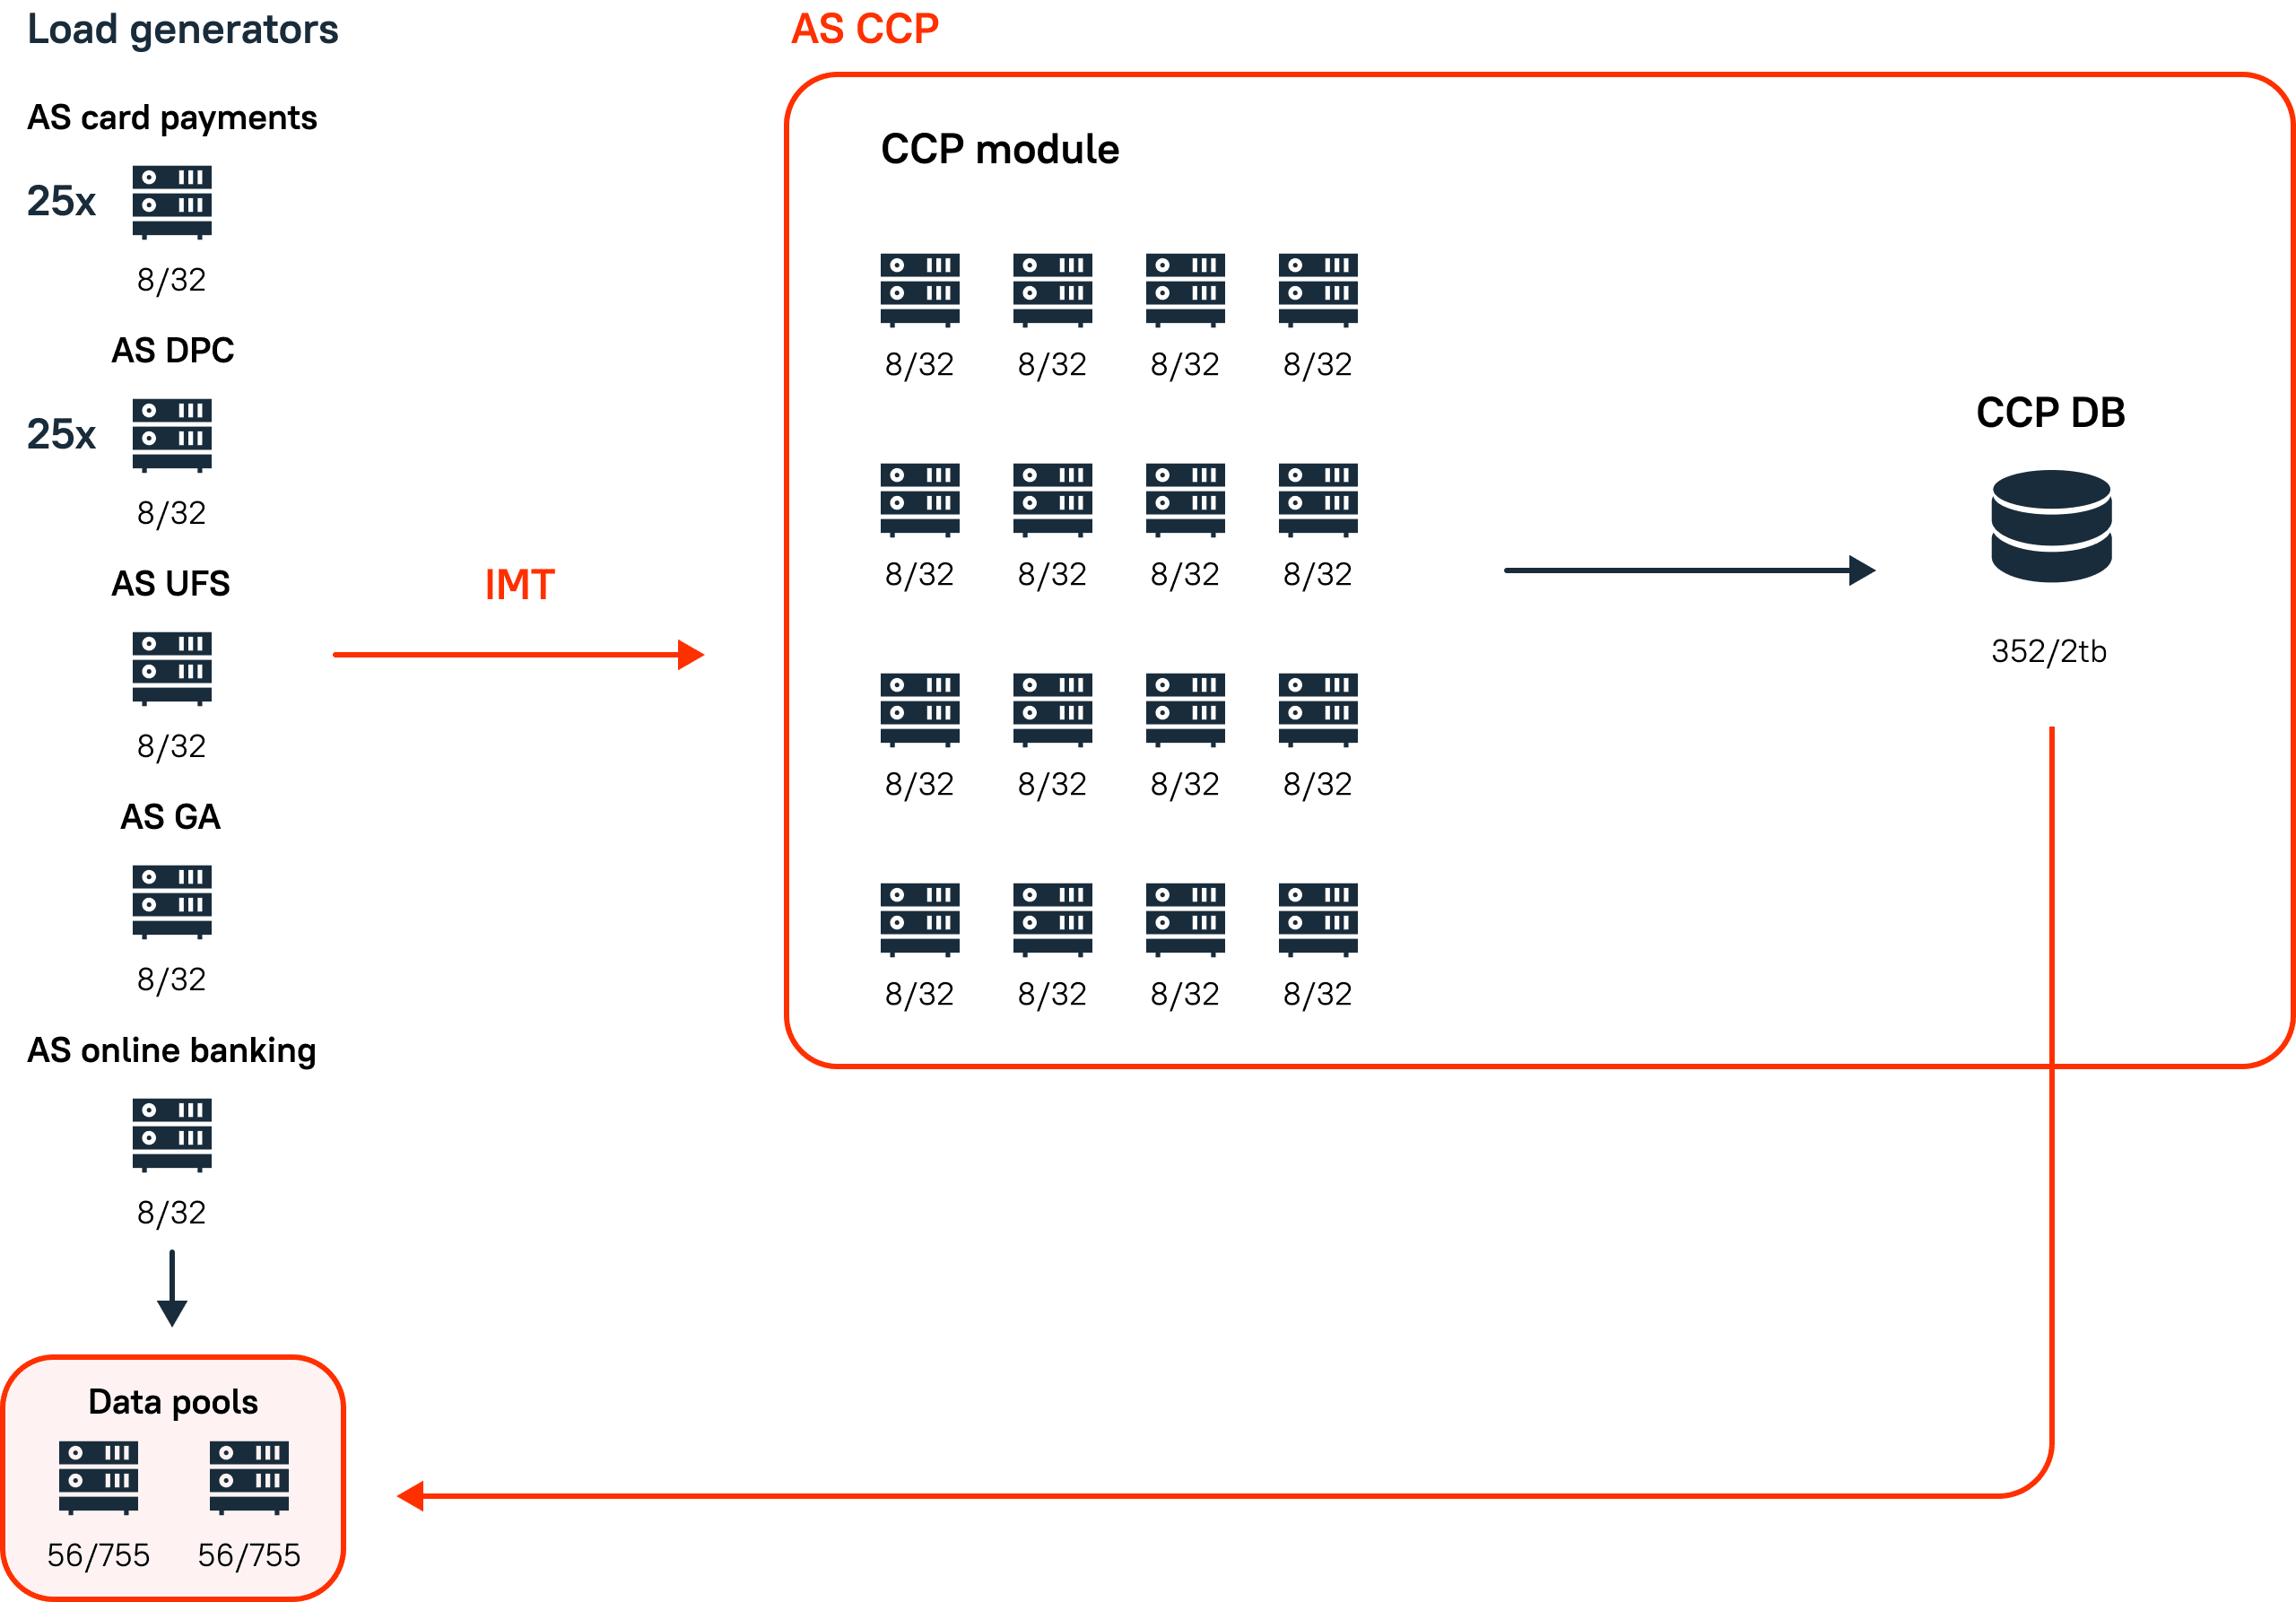
Figure 6. Data pool usage.
How the engagement runs
Each two-week release cycle repeats the same loop: collect requirements for the new functionality, implement the testing scripts, run maximum-search, stability, fault-tolerance and bottleneck tests, hunt performance defects, and deliver a report.
A release passes on three criteria: the subsystem reaches production within the agreed timeframe, no performance defects remain, and a written release report exists.
Results, including the limit
- The system was too architecturally complex to be tested completely, and the original says so. That is the honest finding, and it is the one that shapes everything else: on an estate this size the goal is coverage per release, not a single verdict.
- Testing runs on a two-week release cycle, and has done for years. Each cycle: gather requirements for the new functionality, implement the scripts, run the tests, hunt performance defects, issue the report.
- Each release is judged against three criteria - the subsystem reaches production inside its time frame, no performance defects remain, and a written release report exists.
- Part of the functionality is covered every cycle, so coverage accumulates across releases rather than being attempted at once.
- The engagement continues, alongside the core banking test automation work for the same bank.
Questions this engagement answers
Can a system too large to test completely still be tested usefully?
Yes - by testing a part of the functionality each release cycle rather than pretending full coverage is possible. Architectural complexity is a reason to scope per release, not a reason to skip testing.
What load can a core banking module be tested at?
This one runs at 15,000 TPS standard and 20,000–30,000 TPS at maximum, against a 0.5-second response target measured end to end through the enterprise service bus.
How do you test performance when nobody understands the whole system?
By emulating at two levels - module and integration - and stubbing external systems, so each measurement isolates one question instead of blending everything into a single unexplainable number.
Does moving to containers change performance testing?
It changes what you measure: with OpenShift the module scales by launching pods past a utilisation limit, so testing has to cover both the scaling behaviour and the routing path through Ingress, Egress and proxy servers.
Have a system too big to reason about?
Large platforms rarely fail in obvious places - they fail at the seams between modules, under a profile no single team has ever seen assembled. That is the measurement PFLB engineers build.