


At a glance
- Client: one of the largest retail chains, a long-standing PFLB client, running retail sales analysis on SAP BW
- The decision: which database management system to run it on - Oracle, SAP HANA or Oracle Exadata
- What was at stake: a purchase in the region of tens of millions of dollars, so the comparison had to be defensible, not indicative
- Method: load profiles built from 6 months of real report generation statistics, replicating a full business day
- The hard part: making the comparison reproducible - database caches and inconsistent background load will flatter any second test run
- Deliverable: performance evidence the client could weigh against cost to choose the platform
Why a naive comparison would have produced the wrong answer
The obvious approach - take the most frequently used reports, run them on a copy of production and on the two new platforms, compare the times - fails for two structural reasons, and both were identified before testing rather than after:
Caches. Database systems hold large caches, some multi-tiered. After the first run the data sits in memory, so a second run measures the cache rather than the platform unless startup parameters are changed.
Idle systems lie. Production is under constant load, so throughput measured on an idle bench is not the same quantity at all. Running the same tasks on an unloaded bench, or on one loaded inconsistently, produces a flattering result that cannot be compared to production behaviour at all.
The conclusion drove the whole design: the tests had to be reproducible, and the load on each bench had to replicate the production load rather than approximate it. Since the benches could not use real data, the client developed a method to make that possible.
The methodology, and why each rule exists
Requirement 1 - report frequency must be proportional to reality. Six months of report generation statistics were analysed on a test environment built to match production to select the most time-intensive reports. A large organisation runs hundreds of reports, not dozens, and their execution time depends on launch conditions. There is a subtlety that catches people out: some reports run rarely but take hours; others complete in a minute but are launched thousands of times a day. So the intensity measure was total execution time over six months, regardless of launch parameters - which correctly ranks both kinds.
Requirement 2 - the model must replicate the business day. The client's day splits into users interacting with the system during working hours and scheduled background tasks running at night. Two separate profiles were built accordingly: a day profile and a night profile, because a platform that wins on interactive reporting may lose on overnight batch.
What it cost to run, honestly
Three constraints shaped the project and are worth naming, because they are the ones that get left out of comparison write-ups:
- The client could not supply hardware with enough capacity, so the data volume had to be cut 2.5× - which added a week of work.
- A motherboard failed on one of the servers mid-project, costing more time.
- The client did not want to spend on LoadRunner, the usual tool for SAP. PFLB proposed Apache JMeter instead, which meant building a web-service wrapper for every report to apply load through. Cheaper, with restrictions that did not materially affect the outcome.
Despite all three, the pilot slipped one week.
Results
- Overall performance rose roughly 4×, with storage requirements down through compression and related technologies.
- Some user tasks accelerated 10-20×.
- And some got several times slower - the part that marketing write-ups leave out, and the reason a comparison run on your own workload beats a vendor benchmark.
- SAP HANA came out fastest of the three, with the price of that speed visible next to it.
- The client could set performance against cost and choose with the trade-off in the open.
What this produces
A comparison across three database configurations - Oracle, SAP HANA and Oracle Exadata - under load reproducing the client's real reporting behaviour, day and night, with cache effects controlled for. The client could then set performance against price and choose with the trade-off visible.
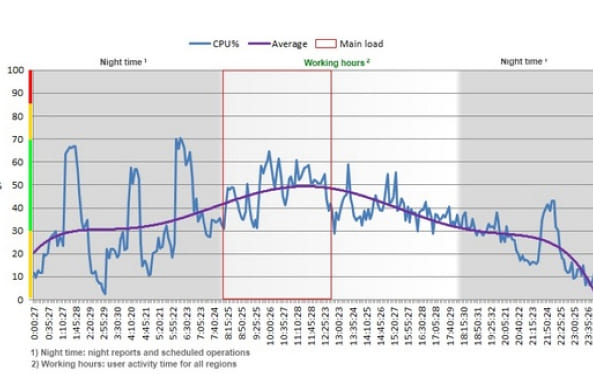
The client's real day: CPU through night-time batch reporting and the working-hours peak - the two profiles the comparison had to reproduce.
Questions this engagement answers
How do you compare database platforms fairly?
Control for cache warming, reproduce production load rather than testing on idle systems, and derive the workload from real usage statistics instead of a chosen benchmark suite.
Which reports should a comparison include?
Rank by total execution time over a long window - six months here. Frequency alone over-weights fast reports; duration alone over-weights rare heavy ones.
Why separate day and night profiles?
Because interactive analytics and overnight batch stress a database differently, and a platform can be the right choice for one and the wrong choice for the other.
Is a vendor benchmark good enough for a decision this size?
Vendor benchmarks measure vendor workloads. When tens of millions are involved, the workload that matters is yours, taken from your own statistics.
Choosing a platform on someone else's numbers?
A migration decision is only as good as the load it was tested under. Reproducing your production behaviour is the difference between a comparison and a marketing chart.
