Analyze results of testing
For the analysis of test runs in PFLB Platform are available:
The comparison dashboard. Comparison of two test runs using tables and graphs in the Grafana dashboard. For more information, see Compare tests.
Trend report. A report is created based on the results of two or more test runs and allows you to analyze the trend of changes in the parameters of the testing system. The results are displayed in tables and graphs. For more information, see Create trend reports.
For more information on how to view all test runs, see View the performed tests.
See also
View the performed tests
To view the performed tests, open the Test runs page:
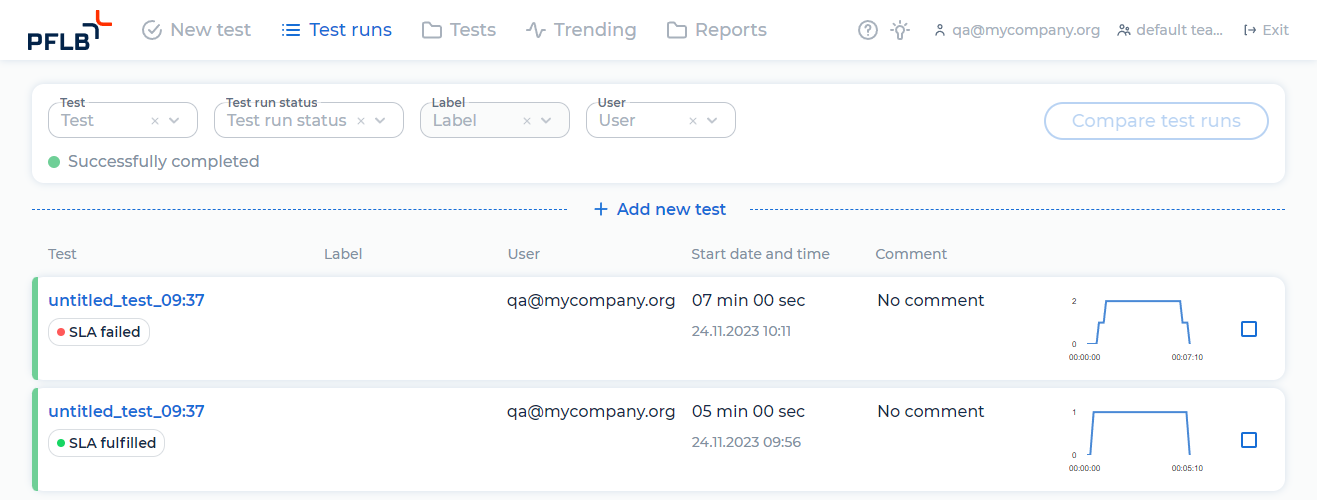
You can filter a list of the test runs by Test name, Test run status, Label, or User.
To filter the list of the test runs, follow these steps:
Click on one of the drop-down lists, for example, Test run status:
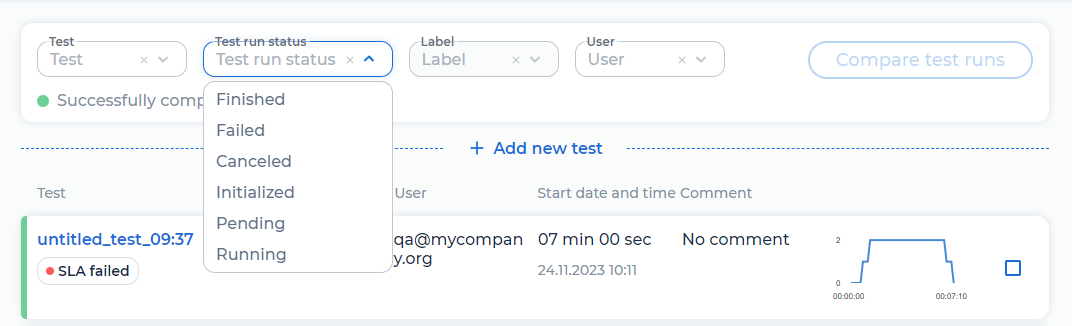
Select the values from the drop-down list.
Test run statuses
The status is displayed for each test run:
Initialized. To run the test, statistics are collected, a profile and load script are created, resources are allocated.
Pending. The current test is queued. If there are no available resources, the test will run after some time.
Running. The test is running. Load generators are sending requests.
Finished. The test was successfully completed.
Failed. The test failed or aborted due to problems on load generators or script errors. The interrupted test runs with the status In Progress are counted in the test quota. For more information, see View subscription.
Canceled. The user canceled the test. The test runs with the status In Progress aborted by the user are counted in the test quota.
SLA fulfillment statuses
The SLA fulfillment status is displayed for each test run:
SLA not set.
SLA fulfilled. The test results match SLA.
SLA failed. The test results don’t match SLA.
Compare test runs
PFLB Platform allows you to compare the results of two test runs in one Grafana dashboard.
To compare test runs, follow these steps:
Open the Test runs page.
Select the checkboxes for the two test runs.
Click Compare test runs. The Grafana dashboard opens:
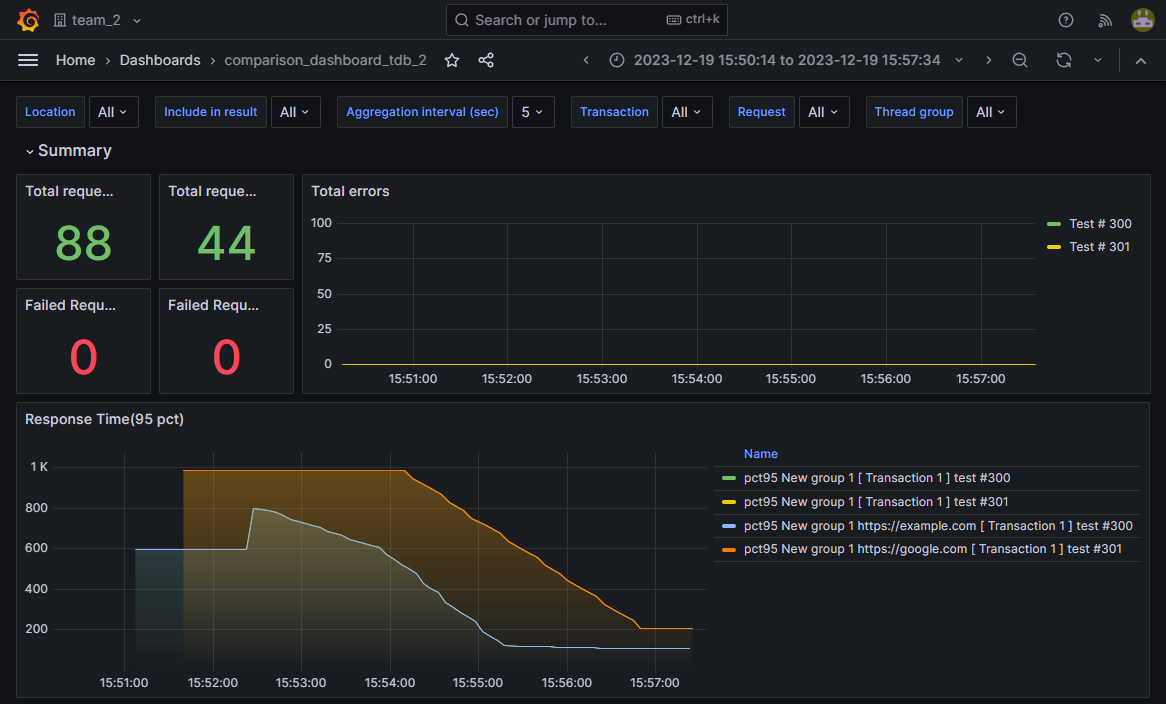
For more information about the metrics of the comparison dashboard, see Metrics.
Create trend reports
Trend report is a report that’s created based on the results of two or more load test runs and allows you to analyze the trend of changes in the parameters of the testing system. The results are displayed in tables and graphs.
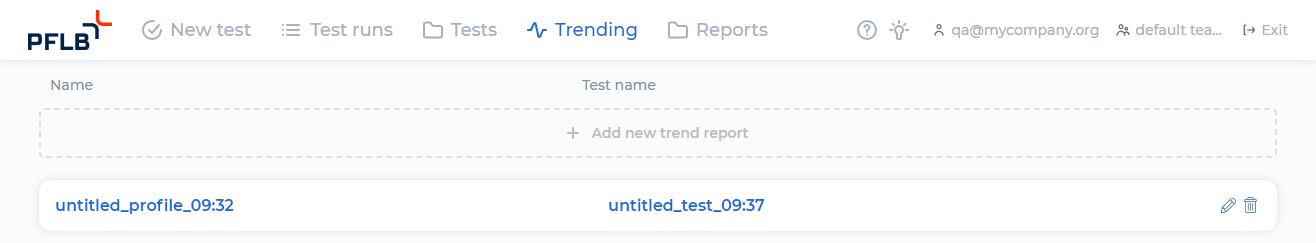
All trend reports are available in the Trending page:
To create trend reports, follow these steps:
Use one of the following methods:
On the Test runs page, open the test run and click + Trend.
Open the Trending page and click + Add new trend report.
Select tests for report using one of the following methods:
Choose the specific test and its multiple test runs:
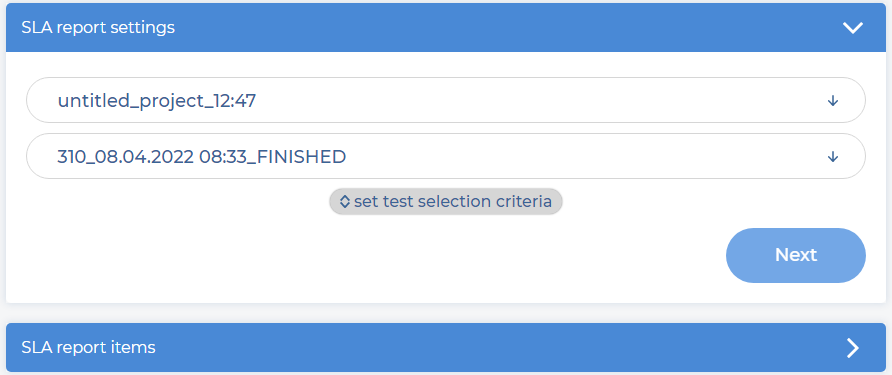
Set test selection criteria:
Select the test.
Enter the number and period for which the tests were run: recent weeks, recent months, or enter the number of recent runs: recent runs.
Optional: Select the test run labels.
Select the test run status:
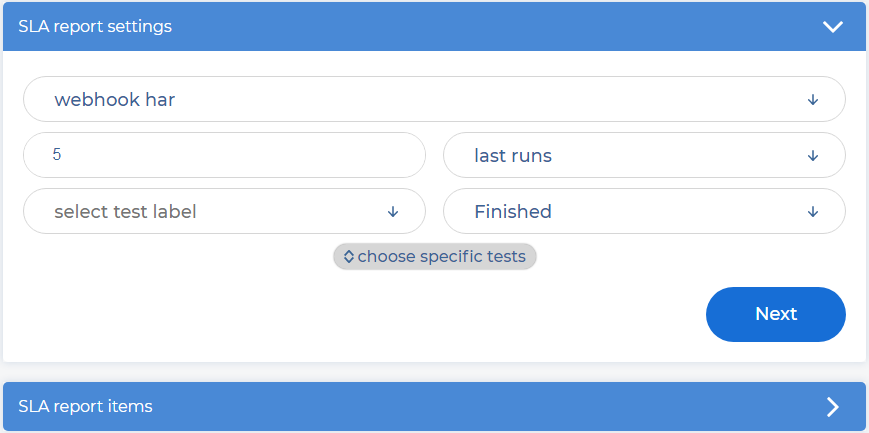
Click Next. The SLA report items pane opens:
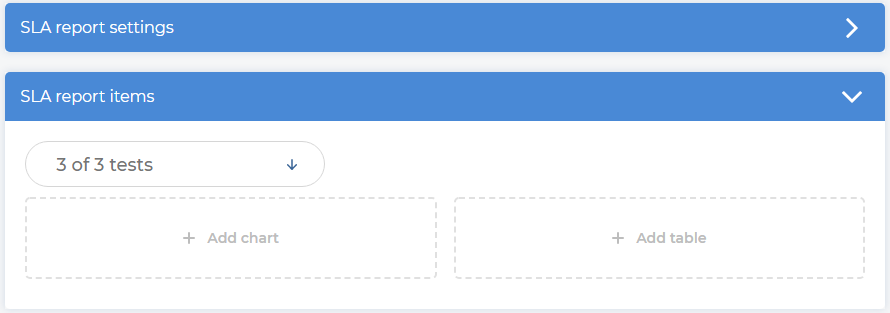
Click Add chart and select SLA. You can display several SLAs on one chart. The chart is normalized automatically.
Click Add table and select SLA. You can display several SLAs in one table.
Note
You can add an unlimited number of graphs and tables to the trend report.
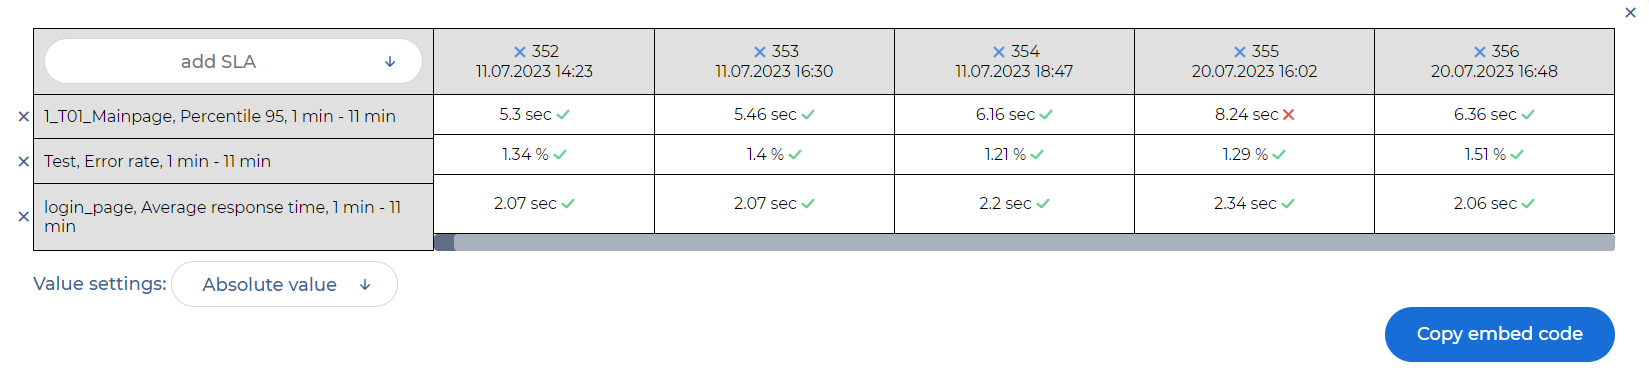
For the table, configure the values:
Select one of the values in the list:
Absolute value. Select to show absolute SLA values.
Test-to-test difference. Select to compare SLA values with the previous test run. You can see the difference in absolute values or in percentages.
Baseline difference. Select to compare SLA values with the baseline test run. You can see the difference in absolute values or in percentages.
Select the required checkboxes for the Test-to-test difference and Baseline difference value settings.
Optional: Click Copy embed code. The HTML code of the report copies. For more information, see Embed a trend report.
Click Save.
Example of the table in the trend report:
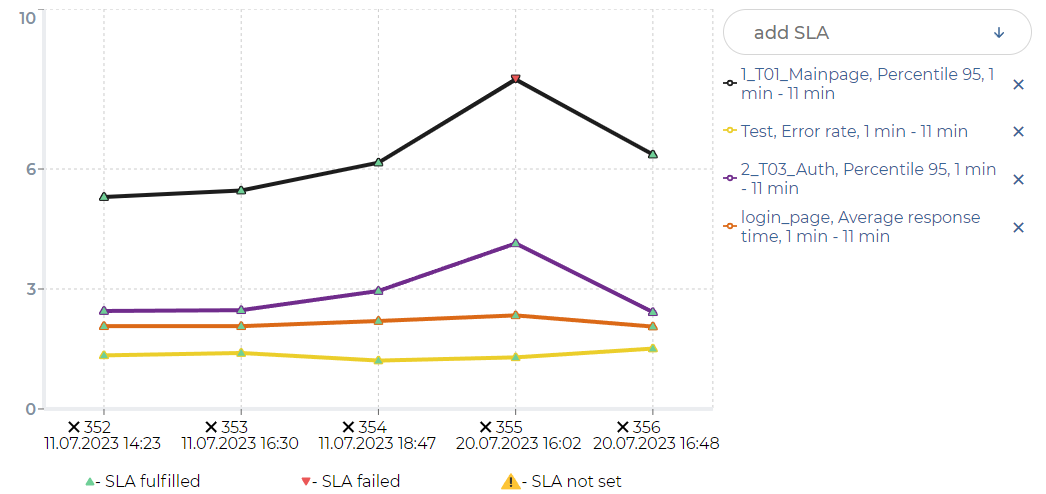
Example of the chart in the trend report:
To edit the trend report, click  .
.
To delete the trend report, click  .
.
Embed a trend report
Open the trend report you want to embed.
Click Copy embed code for the required chart or table. The button is available when the trend report changes are saved. The HTML code is copied:
<div id="The ID of the chart or table">
<script src="The link to the JS script"></script>
<script>
pflb &&
typeof pflb.getSlaReportChart === "function" &&
pflb.getSlaReportChart("PFLB Platform URL", "SLA report profile id", "The ID of the chart or table", "GUI language", "API token")
</script>
</div>
Paste the code into your website HTML, for example a Confluence page.
Example of a chart’s embedded code
<div id="chart-d4fb16c8-af76-4ac7-889a-0d1d30894e5d">
<script src="https://platform.pflb.us/trending.js"></script>
<script>
pflb &&
typeof pflb.getSlaReportChart === "function" &&
pflb.getSlaReportChart("https://platform.pflb.us", "1", "d4fb16c8-af76-4ac7-889a-0d1d30894e5d", "en", "API token")
</script>
</div>
Example of a table’s embedded code
<div id="table-d4fb16c8-af76-4ac7-889a-0d1d30894e5d">
<script src="https://platform.pflb.us/trending.js"></script>
<script>
pflb &&
typeof pflb.getSlaReportTable === "function" &&
pflb.getSlaReportTable("https://platform.pflb.us", "1", "d4fb16c8-af76-4ac7-889a-0d1d30894e5d", "en", "API token")
</script>
</div>