Configure SLA#
SLA (service-level agreement) is non-functional requirements that determine the criteria for the success of the tests performed.
In PFLB Platform, you can add SLA for different scopes: tests, groups, transactions, requests and system metrics.
To add an SLA, follow these steps:
Open the test.
Go to the Load profile tab.
Click SLA. The window opens:

Go to the required tab, click + Add SLA, and configure the SLA:
Click Save.
To delete SLA, click  .
.
You can also add or edit SLA after the test is completed:
Go to the Test runs page and open the test run.
Click SLA. The window opens:

Edit or add SLA.
Click Save. The metric value will be recalculated.
Test#
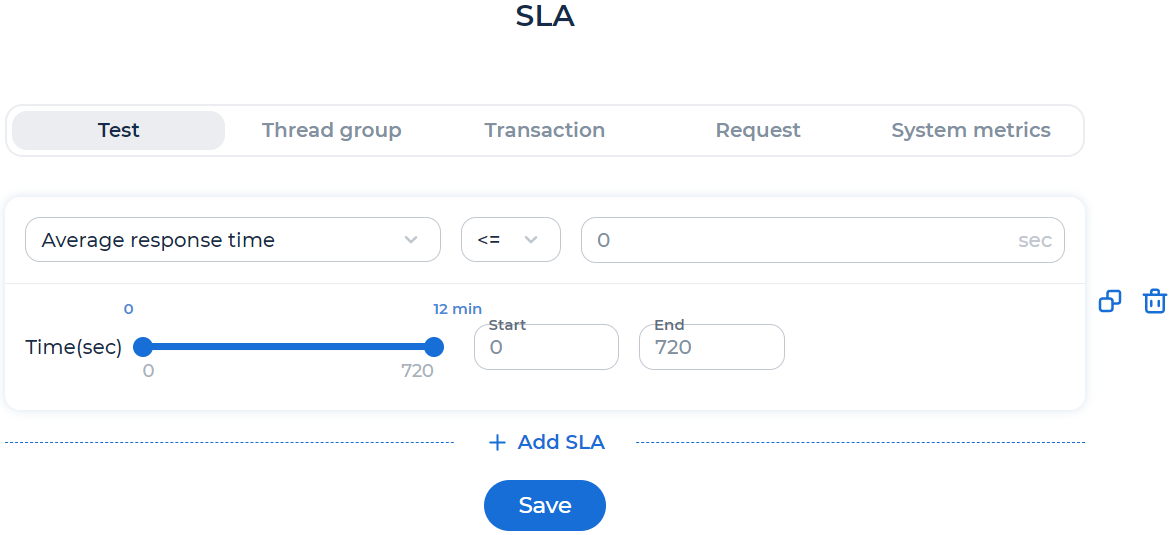
Select one of the metrics for the test:
Average response time. Average system response time to a request or transaction.
Error rate. Errors are calculated only when executing all requests, excluding transactions.
Percentile 95. The value which is greater than 95% of response time for the test.
Request per second. Number of requests sent per second.
Select one of the conditions: <= or >.
Enter a threshold of the metric (SLA).
In the fields Start and End, enter the period for which PFLB Platform calculates the metric at the end of the test if needed.
Group#
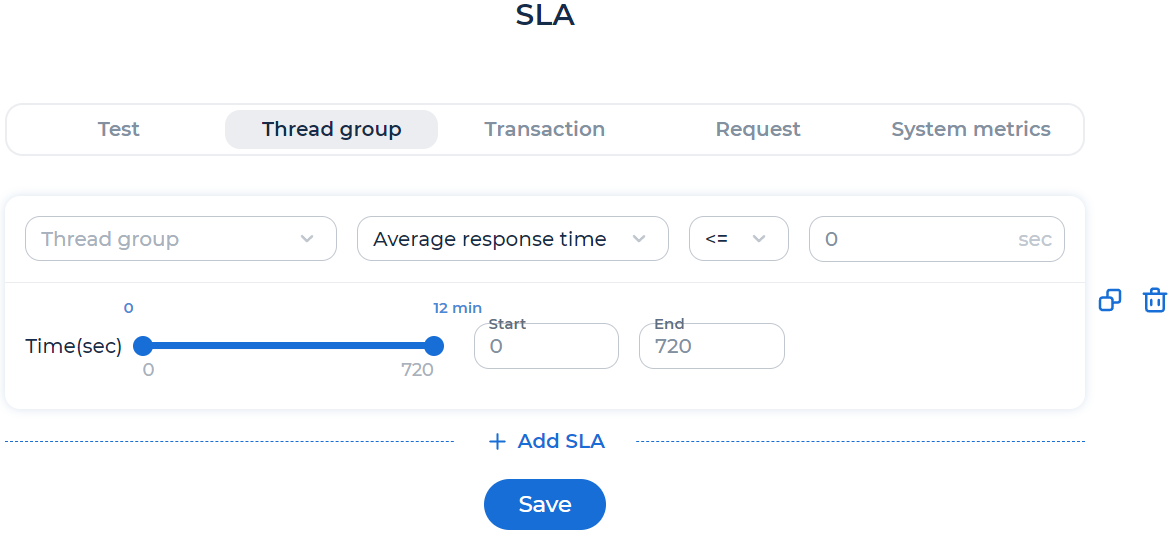
Select the group.
Select one of the metrics:
Average response time. Average system response time to a group.
Error rate. Errors are calculated only when executing the group.
Percentile 95. The value which is greater than 95% of response time for the group.
Request per second. Number of requests sent per second.
Select one of the conditions: <= or >.
Enter a threshold of the metric (SLA).
In the fields Start and End, enter the period for which PFLB Platform calculates the metric at the end of the test if needed.
Transaction#
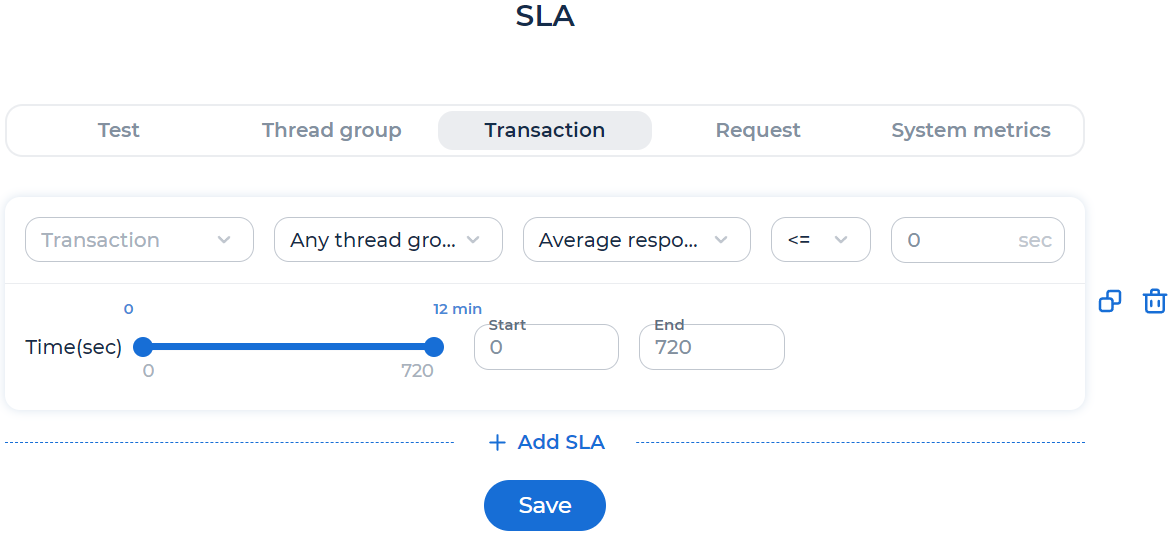
Select the transaction and group.
Select one of the metrics:
Average response time. Average system response time to transaction.
Error rate. Errors are calculated only when executing a transaction, excluding requests.
Percentile 95. The value which is greater than 95% of response time for the transaction.
Request per second. Number of requests sent per second.
Select one of the conditions: <= or >.
Enter a threshold of the metric (SLA).
In the fields Start and End, enter the period for which PFLB Platform calculates the metric at the end of the test if needed.
Request#
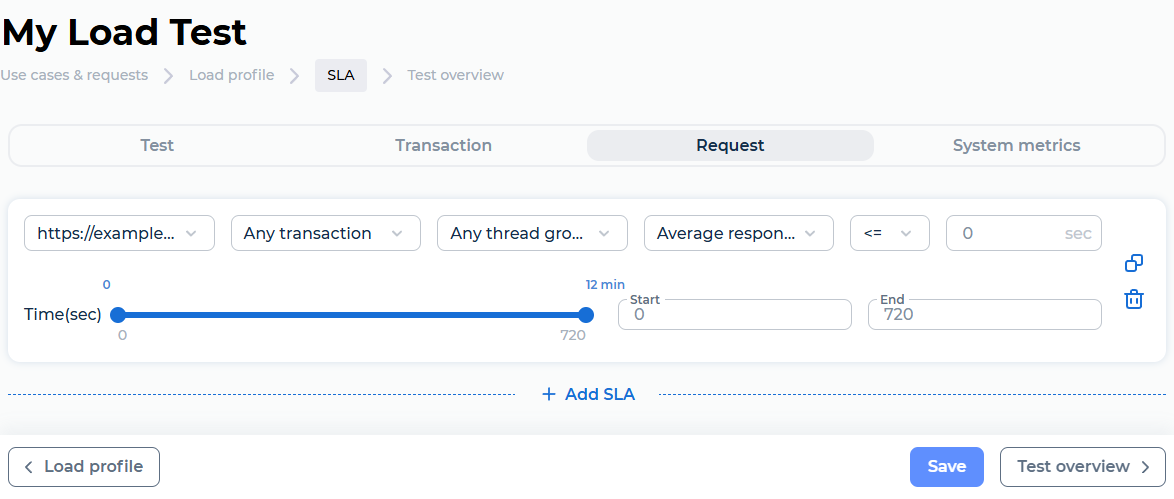
Select the request, transaction, and group of the test.
Select one of the metrics:
Average response time. Average system response time to a request.
Error rate. Errors are calculated only when executing the request.
Percentile 95. The value which is greater than 95% of response time for the request.
Request per second. Number of requests sent per second.
Select one of the conditions: <= or >.
Enter a threshold of the metric (SLA).
In the fields Start and End, enter the period for which PFLB Platform calculates the metric at the end of the test if needed.
System metrics#
Note
Before adding SLA with system metrics:
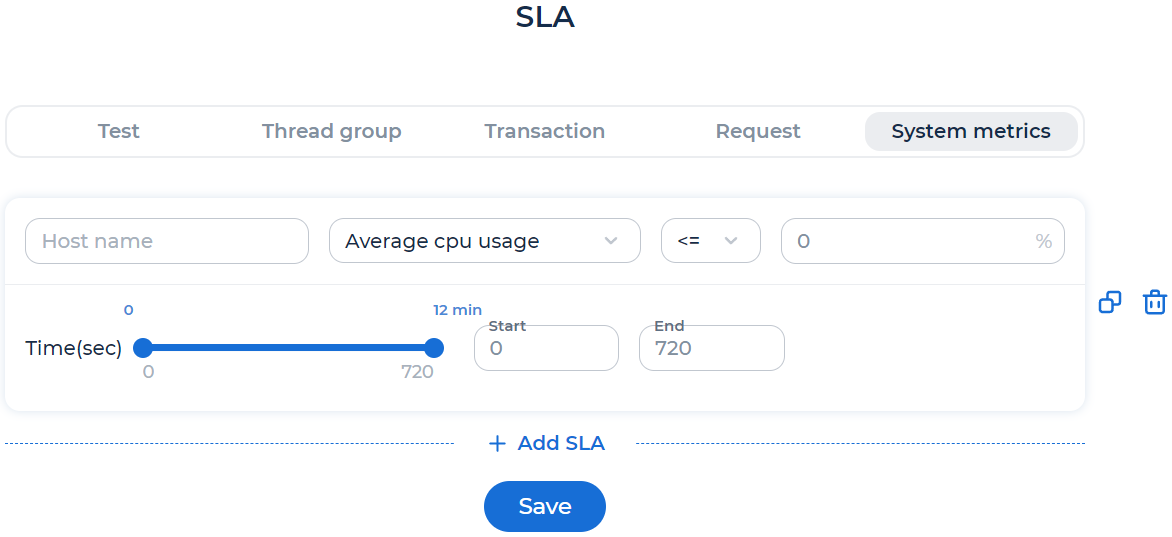
To add an SLA with system metrics, follow these steps:
Enter the host name of the testing system.
Select one of the metrics:
Average cpu usage,
Average memory usage.
Select one of the conditions: <= or >.
Enter a threshold of the metric (SLA).
In the fields Start and End, enter the period for which PFLB Platform calculates the metric at the end of the test if needed.
View SLA status#
The SLA fulfillment status is displayed after the test is completed in the Test runs page. For more information, see View the performed tests.
To view the SLA metric value, follow these steps:
In the Test runs page, open the test run.
Click SLA. If the test results match SLA, the metric value is highlighted in green, otherwise it is highlighted in red: