Visualizing tests in Grafana#
Grafana is a tool integrated into PFLB Platform and used to visualize load test data. You can use Grafana to graphically represent time series and text data. For more information, see Grafana documentation.
The Grafana dashboard consists of panels with a visual representation of the running test.
PFLB Platform has three dashboards:
View test run metrics#
To view test metrics in the Test Runs page, use one of the following methods:
During the test execution:
In the Test runs in progress pane, click Test Details.
Click Detailed stats:

After completing the test, open the test run and click Detailed stats.
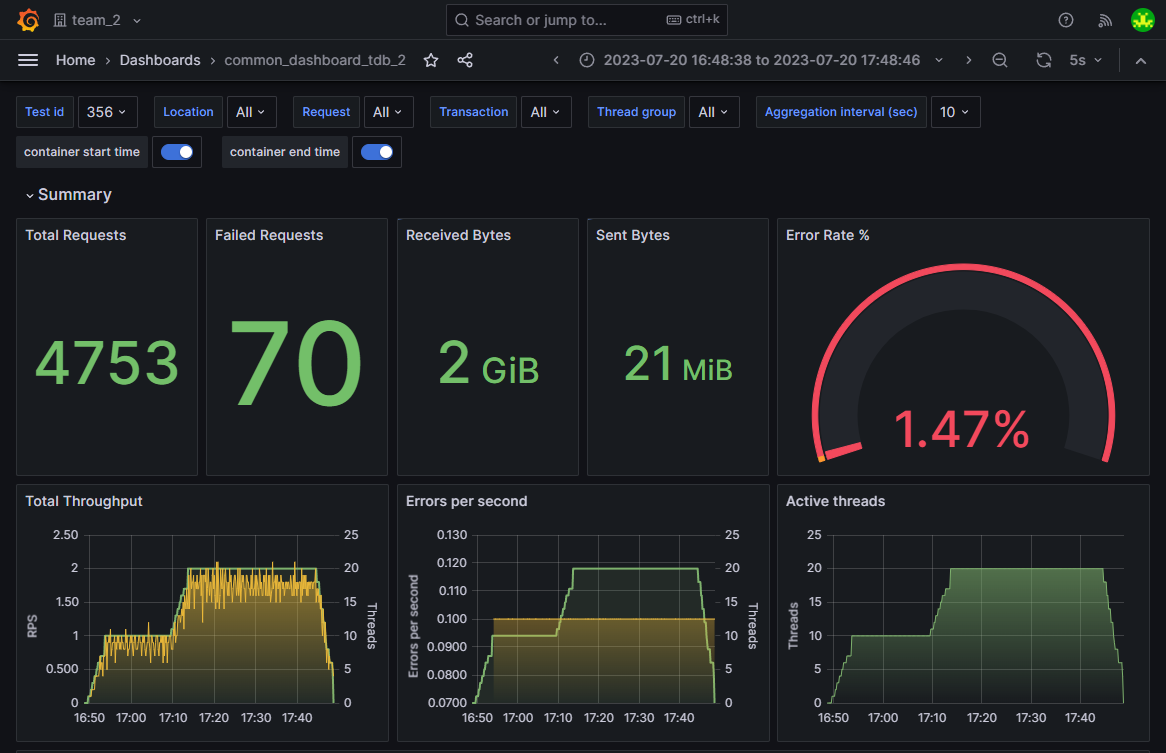
The main Grafana dashboard then opens:
View system metrics#
You can configure system metrics when creating a set of settings.
To view system metrics of the test run in the Test Runs page, use one of the methods:
During the test execution:
In the Test runs in progress pane, click Test Details.
Click Detailed system metrics:

After completing the test, open the test run and click Detailed system metrics.
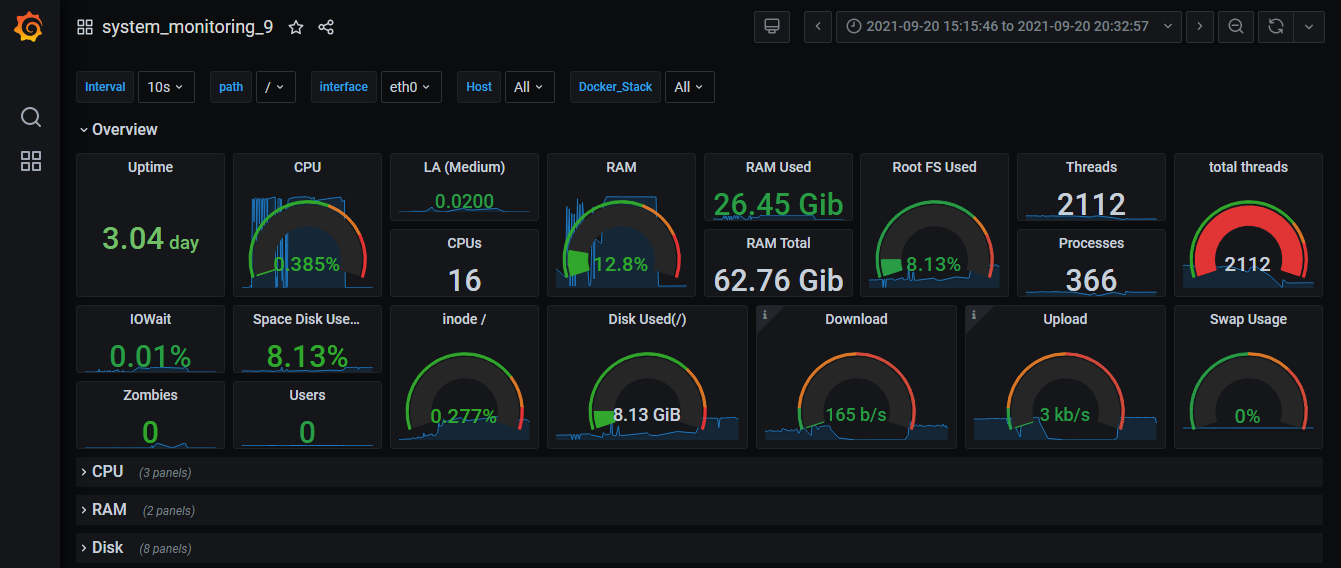
The dashboard with system metrics then opens:
Metrics#
PFLB Platform collects and analyzes the following metrics:
Metrics |
Unit of measurement |
The main dashboard |
The comparison dashboard |
|---|---|---|---|
Total Requests |
Piece |
Yes |
Yes |
Failed Requests |
Piece |
Yes |
Yes |
Received Bytes |
B, KiB, MiB |
Yes |
No |
Sent Bytes |
B, KiB, MiB |
Yes |
No |
Error Rate |
% |
Yes |
No |
Total Throughput |
RPS |
Yes |
Yes |
Active Threads |
Piece |
Yes |
Yes |
Errors per second |
RPS |
Yes |
Yes |
Transactions Response Times (95th pct) |
ms, s |
Yes |
Yes |
Response Time per Individual Request |
ms, s |
Yes |
Yes |
Sent Bytes per Transaction |
B, KiB, MiB |
Yes |
No |
Received Bytes per Transaction |
B, KiB, MiB |
Yes |
No |
Sent Bytes per Individual Request |
B, KiB, MiB |
Yes |
No |
Received Bytes per Individual Request |
B, KiB, MiB |
Yes |
No |
Errors per Transaction |
Piece |
Yes |
No |
Error Info |
Piece |
Yes |
No |
CPU Usage |
% |
Yes |
No |
Mem Usage |
% |
Yes |
No |
Disk IO Read |
B/s, KiB/s, MiB/s |
Yes |
No |
Disk IO Write |
B/s, KiB/s, MiB/s |
Yes |
No |
Note
The metric unit of measurement changes automatically depending on the value of the maxima for the metric on the dashboard.
You can filter any metrics in the context of various load generators. Metrics aggregation is available for the following periods: 1, 5 or 10 seconds.
You can analyze metrics with preset SLA using trend reports.
You can configure system metrics when creating a set of settings.
Names of requests and transactions in Grafana dashboards#
For the tests created in PFLB Platform editor, the request name consists of the request URL and the transaction name:

Example of requests names in Grafana:
“https://example.com [ TR_01 ]”,
“https://google.com [ TR_01 ]”.
In these types of tests, all requests are always inside transactions.
In tests based on JMX files, the name of the request consists of the name http sampler: the value of the field name, and the name of the transaction controller in which it’s located. If the request is outside the transaction controller, then the name of the request includes only the name of the http sampler.
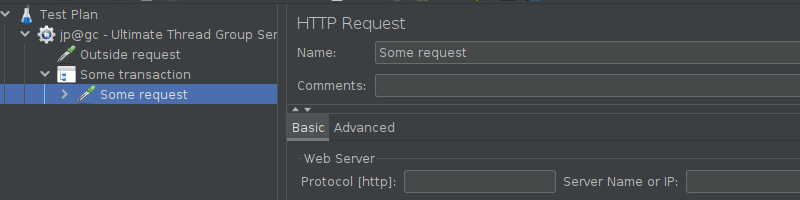
Example of requests names in Grafana:
“Outside request”,
“Some request [ Some transaction ]”.