Create a settings set#
Settings sets allow you to run tests with different settings. You can reuse any settings set in new tests.
Note
If parameter names from a settings set match the settings of the test, then the test uses the settings from the linked set.
Timer settings from a settings set override timer settings from a test.
Add a settings set#
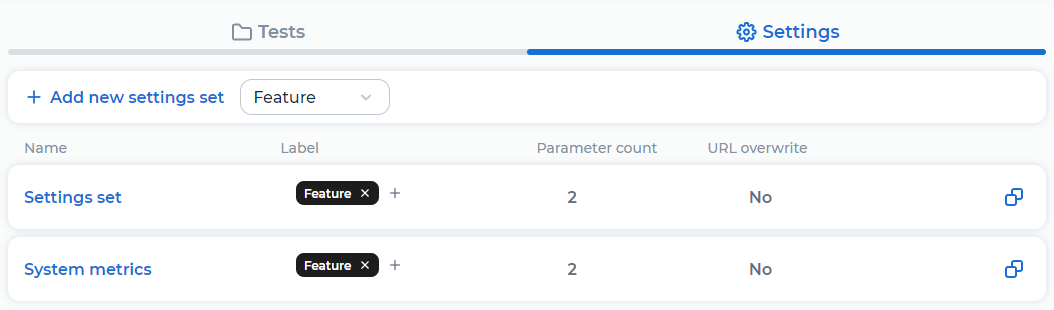
Go to the Tests page and open the Settings tab:
Click Add new settings set.
Go to the required tab and configure the set:
Parameters: add parameters
URL rewrite: rewrite the transaction URL
Other settings: Configure a timer, specify timeouts and add default headers for all requests of a test
JMeter properties: configure JMeter
Cookies: add default headers for all requests of a test
Webhooks: set default cookies
Monitoring: add system metrics for the monitoring
Click Save.
Add parameters#
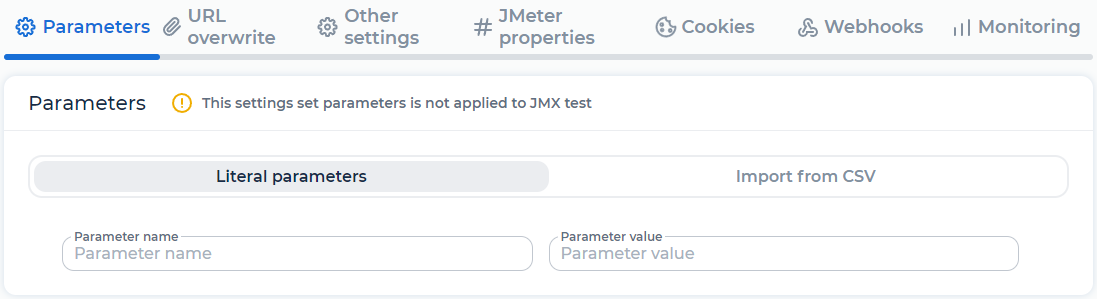
To add a literal parameter, follow these steps:
On the Literal parameters tab, enter the name of the parameter in the Parameter Name field.
Enter the value of the parameter in the Parameter Value field.
To add a CSV parameter, follow these steps:
Go to the Import from CSV tab.
Click to upload CSV file and select the file. The file can contain one or more columns. The file size shouldn’t exceed 50 MB. The page opens:
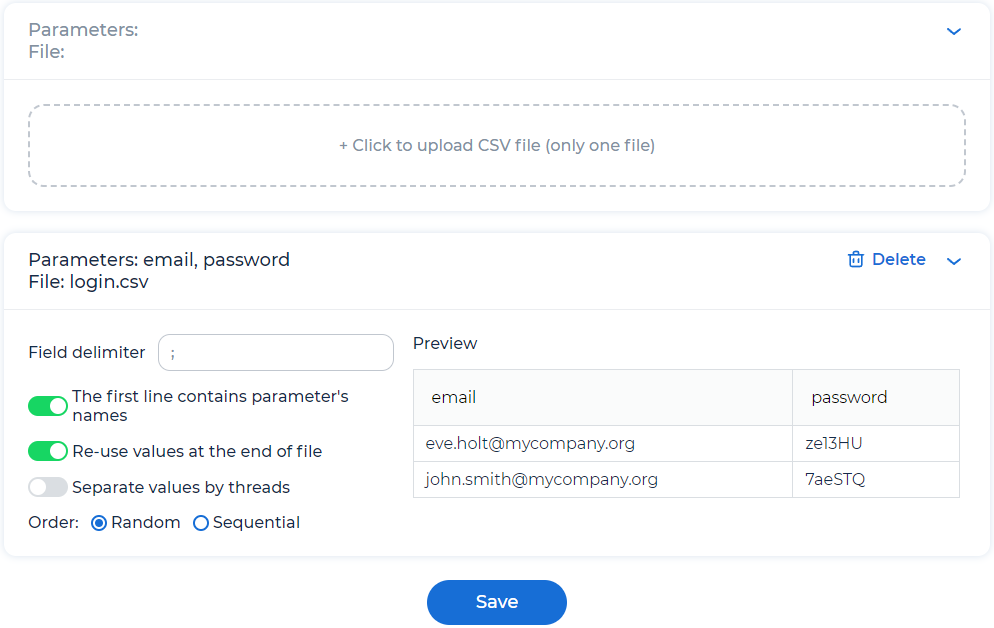
Configure import from CSV file:
Field delimiter. The character or string used to separate the fields in the uploaded CSV file, for example “;”.
The first line contains parameter’s names. If the toggle is switched on, the first line of the CSV file is used as parameter names. If the toggle is switched off, in the fields Parameter’s name, enter parameter’s names.
Reuse values at the end of file. If the toggle is switched on, the CSV file starts rereading from the beginning after having reached its end. If the toggle is switched off, the test run may end earlier than planned when the end of the CSV file is reached.
Separate values by threads. If the toggle is switched on, the load generator separates a data set, and each Virtual User instance uses its own data set. If the toggle is switched off, each Virtual User instance uses a common data set.
Order. Select one of the values:
Random. Shuffles the CSV file lines before executing the test.
Sequential. Reads the CSV file lines sequentially.
See also
Rewrite a transaction URL#
Go to the URL overwrite tab.
Click Add new URL.
Enter the current transaction URL in the URL to rewrite field.
Enter the new URL in the Updated URL field.
Note
Уou can also configure URL overwrite using parameters.
Configure a timer and specify timeouts#
Go to the Other settings tab:
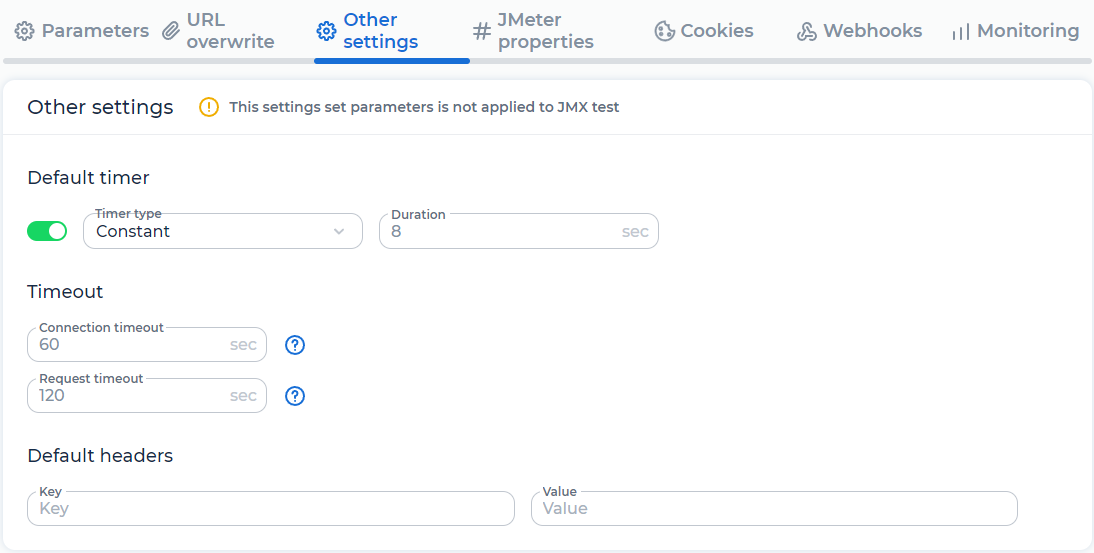
Configure the default timer:
To turn the default timer on or off, click the toggle.
Select the timer type:
Constant. Enter a delay before sending the request by Virtual Users. A delay is specified in seconds.
Random. Enter a range of numbers within which a random delay time is selected. A range is specified in seconds.
Enter the timeouts:
Connection timeout. A default timeout before the connection is established to the server or the handshake is executed. If it doesn’t happen within the given time frame, the request is marked as connection timeout. By default, it’s 60.
Request timeout. A default timeout before the entire body of the response from the server is received. If it doesn’t happen within the given time frame, the request is marked as timeout. By default, it’s 120.
See also
Set default headers#
Go to the Other settings tab:
Enter the name of the parameter in the Key field. To enter the name of the parameter in the format
${expression}, click P and select the parameter. Don’t use spaces in the parameter name.Enter the value of the parameter in the Value field. To enter the name of the parameter in the format
${expression}, click P and select the parameter.
You can select the parameters with the P button, if you have added these parameters in the settings set.
See also
Configure JMeter#
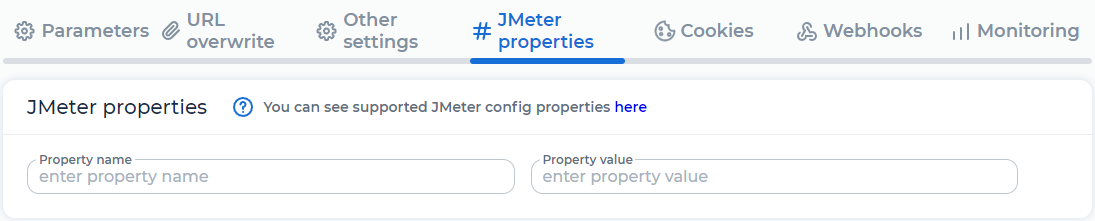
You can define JMeter properties for your test.
To specify or override JMeter properties, follow these steps:
On the JMeter properties tab, enter a property name. For more information, see Supported JMeter properties.
Enter the value of the parameter in the Parameter Value field.
By default, JMeter stores the entire response to a query. To optimize RAM usage, you can limit the size of the RAM for storing responses, for example, to 100 bytes:
Go to the Jmeter properties tab.
In the Property name field enter
httpsampler.max_bytes_to_store_per_request.In the Property value field specify
100.
Set default cookies#
Go to the Cookies tab.
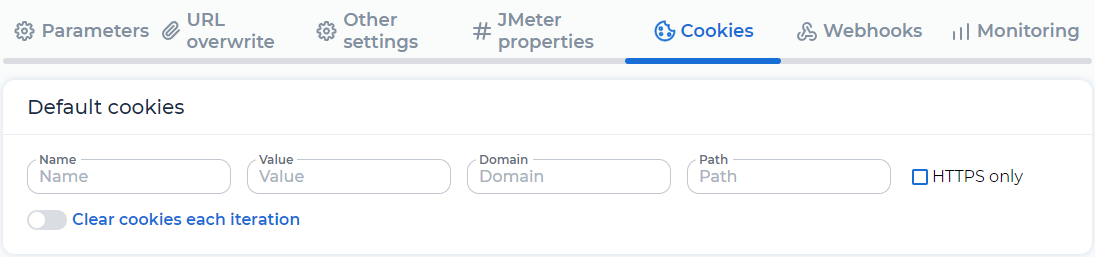
Fill in the fields:
Name. The unique name of the cookie.
Value. The value of the cookie.
Domain. The name of the host to send the cookie to. Specified without
http(s)://.Path. The path to the resource on the web server. The default value is
/.
If needed, select the HTTPS only checkbox so the cookie should only be used over HTTPS, and JavaScript modification isn’t allowed.
If needed, click the Clear cookies each iteration toggle so that cookies are cleared, and the virtual user should behave like a new user on each iteration of the group’s execution. A new user means the user wouldn’t remember any cookies from this website.
See also
Add webhooks#
Webhooks are designed to send notifications when the test status changes, for example, when it’s finished. You can use webhooks as triggers in CI/CD pipelines.
To add a webhook, follow these steps:
Go to the Webhooks tab.
Click + Add new webhook. The webhook settings appear:
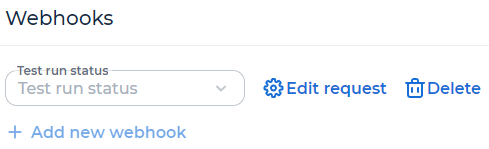
Select test run status from the drop-down list. Possible values:
Finished
Failed
Canceled
Pending
Running
Click Edit request. The window opens:
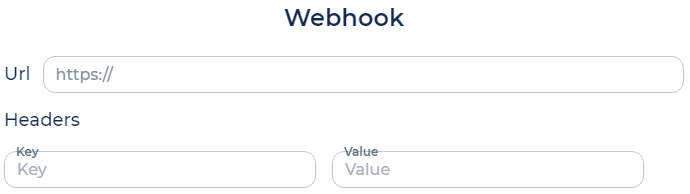
Fill in the fields:
Url. Request URL.
Key. Name of the header parameter.
Value. Value of the header parameter.
Click Save.
When the test status changes to the one specified in the webhook settings, PFLB Platform sends an HTTP request with the body:
{
  "id": Test run id,
  "testProjectId": Test id,
  "testProjectVersionId": Test's version id,
  "testMode": "Test mode",
  "state": "Test status",
  "displayState": "Displayed test status",
  "userId": User id,
  "teamId": Team id,
  "createDate": "Test creation date",
  "startDate": "Test starting date",
  "endDate": "Test completion date",
  "comment": "Test description",
  "labelSet": [Test labels]
}
Use webhooks to configure triggers in CI/CD pipelines. For example, to get SLA results after completing the test, follow these steps:
Add a webhook for the Finished status.
Wait for the notification of the test completion.
Send a request to get SLA results. The value of the testId parameter is equal to the value of the id parameter from the webhook request body:
curl --location --request GET 'https://api.platform.io/test-srv/api/testResult/sla?testId=id' \
--header 'api-token: API token'
See also
Add system metrics for the monitoring#
Go to the Monitoring tab.
Select system metrics from the drop-down list:
Disk input/output system. Collects read/write operations of a disk. The Grafana dashboard includes: Root Disk usage, All partitions usage, DISK partitions Inode Total, DISK partitions Space Total, Root (/) Disk inodes, Path Used Percent, Swap usage, Swap I/O bytes.
UDP metrics. The Grafana dashboard includes: UDP datagrams, UDP buffer errors, UDP errors.
TCP metrics. Collects such metrics as established connections, time wait, and socket counts. The Grafana dashboard includes: Network Packets, TCP handshake issues.
Kernel metrics. Collects various Kernel metrics, such as boot_time, context_switches, interrupts. The Grafana dashboard includes: Context Switches, Interrupts, Forks.
Docker metrics. Uses Docker Engine API to gather metrics on running docker containers. The Grafana dashboard includes: Running Docker, Stopped Docker, Docker Images, Docker Status, CPU Usage, Mem Usage, Traffic, Disk IO.
Click Generate and save. The link to the
system_monitoring.tar.gzfile appear:
The file contains:
telegraf.conf. The config file of the Telegraf agent for collecting metrics and system data.
docker-compose.yaml. The Docker Compose file for the Telegraf agent deploying.
start.sh. The script for starting and configuring of the monitoring.Note
To get the system metrics of the testing system on the server where the metrics are collected, follow these steps:
On the server where the metrics are collected, install Docker.
Give access to the public Docker hub or pre-download the Telegraf Docker image.
On the server where the metrics are collected, install Docker Compose.
Copy the
system_monitoring.tar.gzfile to the all testing system servers.Run the
start.shscript on each server.
Create a settings set based on a test#
Open the Tests page.
Click
 for the test on which you want to base the settings set. The window opens:
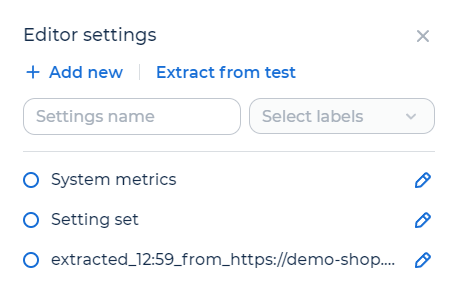
Click Extract from test.
To edit the settings set, click
 if needed.
The created settings set is automatically linked with the test.
Copy a settings set#
You can create a settings set based on another set.
Go to the Tests page and open the Settings tab:
Click
 for the settings set on which you want to base the new settings set.
The new settings set calls “copied_<Name of the original settings set”.
Edit a settings set#
To edit a settings set, follow these steps:
Use one of the following methods:
on the Tests tab:
Click
for any test.Click
for the required settings set.
on the Settings tab, open the settings set.
Add parameters. For more information, see Create a settings set.
Click Save.
Link a settings set to a test#
To link a settings set to a test, follow these steps:
Use one of the following methods:
On the test, click Actions ⋮ and select Link settings set.
On the Tests page, click
for the required test.The window opens:
Select the settings set on which you want to link to the test.
Click Link.
Add labels to a settings set#
Labels allow you to filter the list of settings sets on the Settings tab, specify important information, and highlight the set in the list.
To add labels, follow these steps:
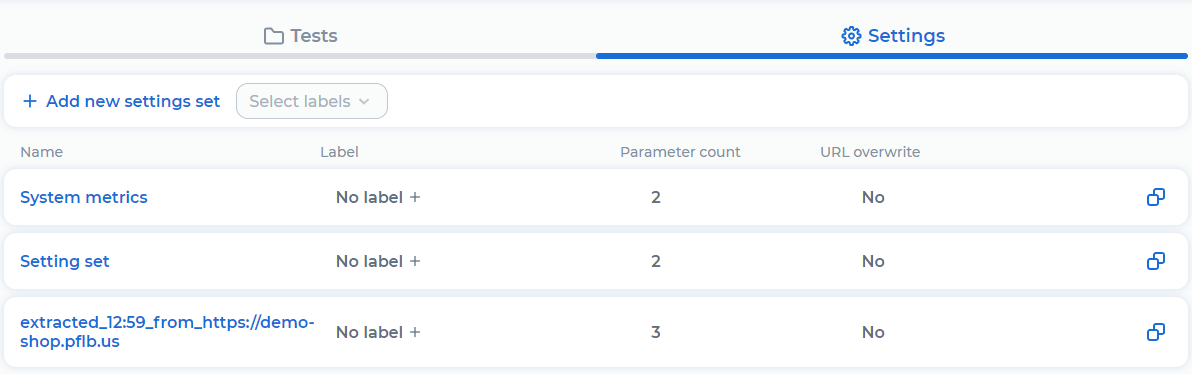
Go to the Tests page and open the Settings tab:
Click No label + for the required settings set.
Enter the name of the label and click
 .
.
To filter the list of tests, select labels from the drop-down list: