Performance testing tools already rely on AI methods. Monitoring platforms use anomaly detection, cloud providers forecast demand for autoscaling, and log systems group patterns with machine learning. These features are often treated as standard, but they are all examples of AI applied in practice. This article looks at six areas where testers already work with AI every day.
Key Takeaways
- AI is part of most monitoring, infrastructure, and testing tools in use today.
- Anomaly detection, predictive scaling, code assistants, and automated log analysis are common examples.
- These features reduce manual setup and make analysis faster, but still need careful validation.
- Knowing where AI is already applied helps testers judge when to rely on it and when to verify results manually.
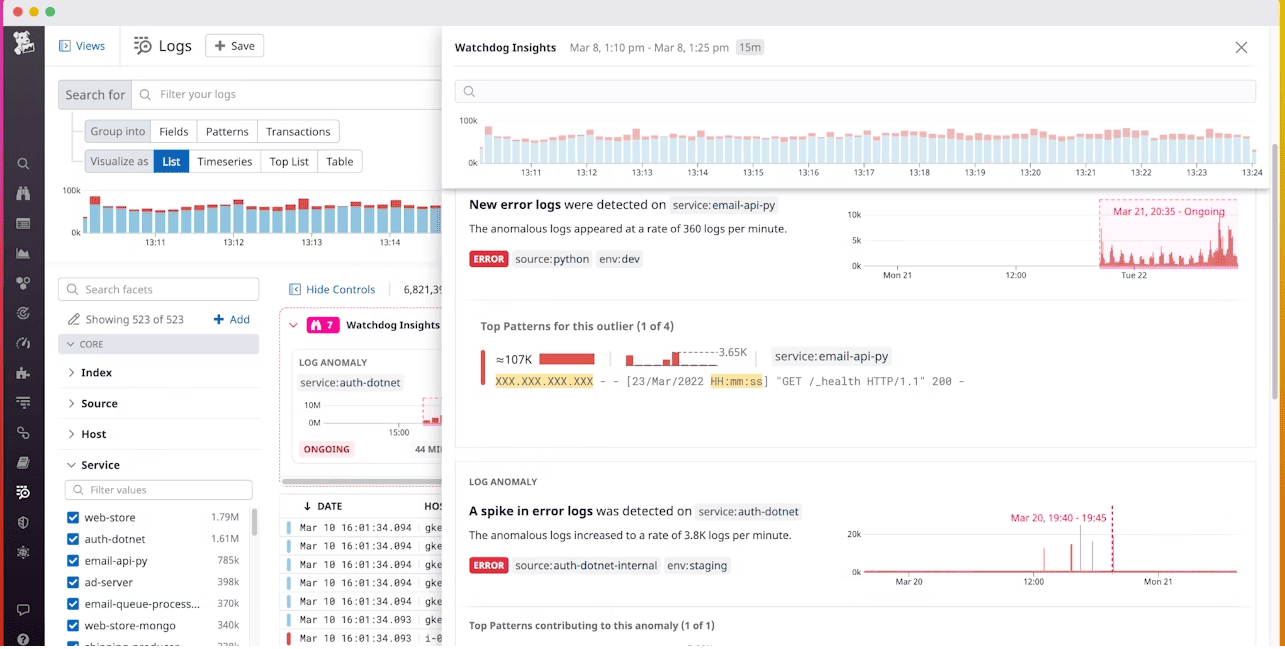
1. Anomaly Detection in APM Tools
What it is
Anomaly detection in APM is about automatically learning what “normal” behavior looks like (with respect to trends, seasonality, etc.) and then alerting you when metrics deviate. It’s different from simple fixed thresholds — it can adapt to cycles in your data (hour-of-day, day-of-week), gradual baseline shifts, and noisy behavior.
How it works in practice (Datadog example)
- Datadog’s Anomaly Monitor supports algorithms like basic, agile, and robust.
- Basic is simpler, less sensitive to seasonality or long-term trends; good for metrics without predictable cycles.
- Agile handles seasonality and can adjust quickly for baseline shifts.
- Robust is more conservative, better at avoiding false positives when data is noisy but with recurring cycles.
- For metrics with daily or weekly seasonality, Datadog usually needs at least three weeks of historical data to establish a reliable baseline using the agile or robust algorithms.
- They also recommend up to six seasons (i.e. six weekly cycles) when possible, for better anomaly model stability.
- Datadog’s anomaly detection accounts for seasonality (hour/day/week), daylight saving adjustments, and can separate trend from seasonal component.
- When configuring an anomaly monitor you set:
- which metric(s) to monitor,
- which algorithm,
- the bounds (how far from expectation you allow before triggering),
- and the trigger/recovery windows (how long the deviation has to last before you get alerted).
Strengths and limitations
2. AI-Assisted Reporting in Load Testing Platforms
What it is
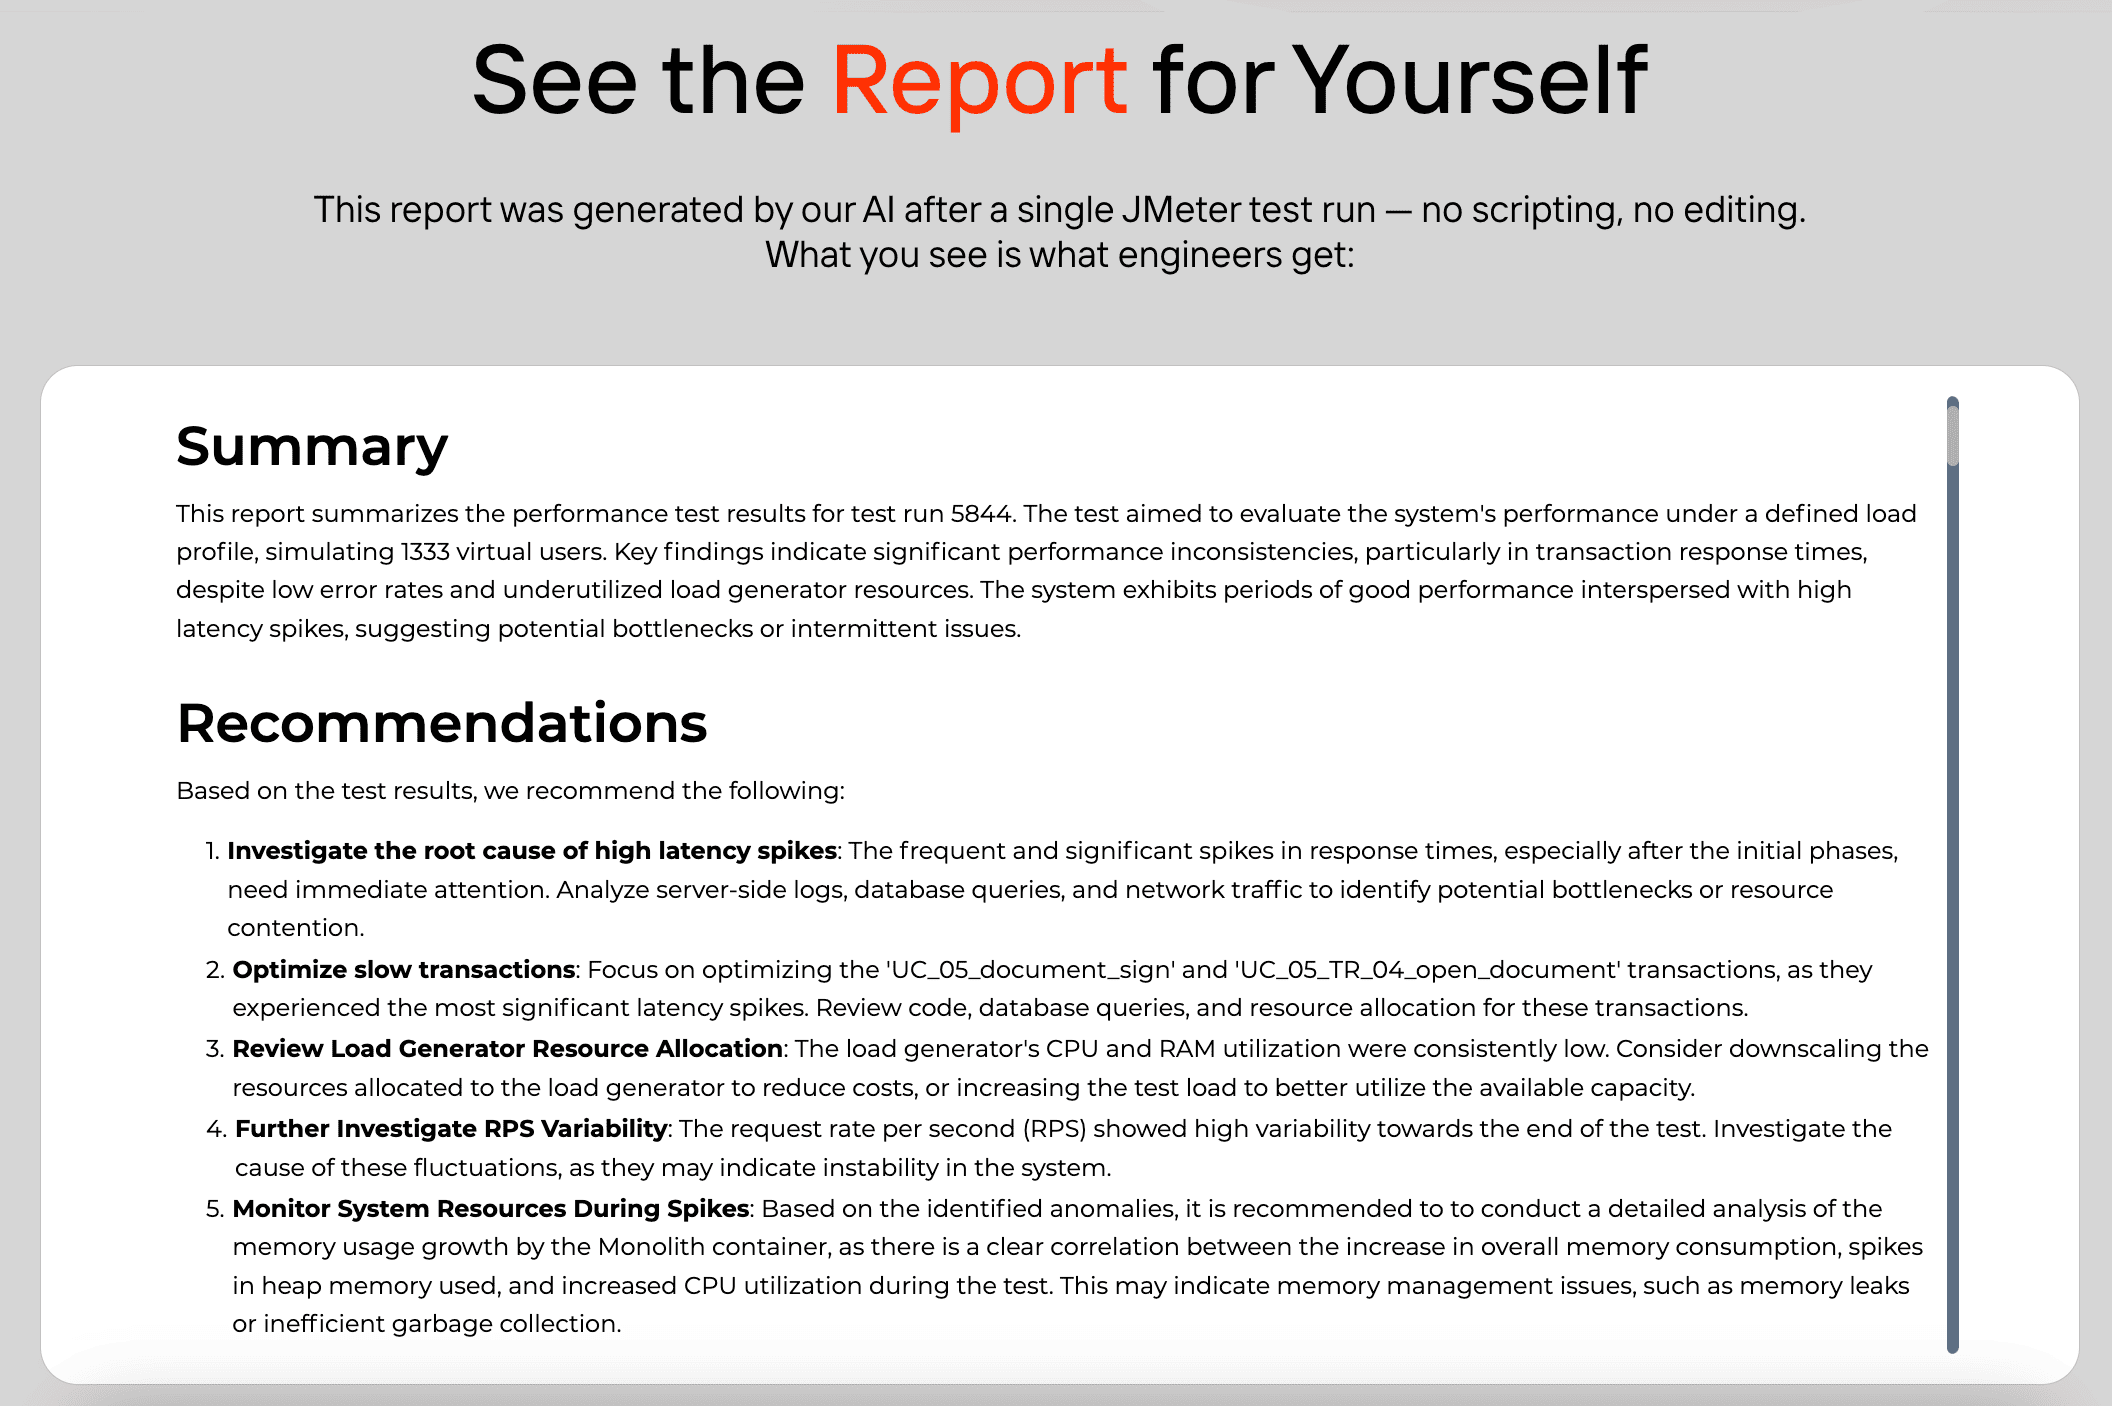
Load testing platforms are starting to integrate AI to reduce the manual effort of interpreting results and running tests. Instead of requiring engineers to sift through graphs or memorize tool-specific syntax, AI generates reports, summarizes findings, and even provides conversational interfaces for executing scenarios.
How it works in practice
- PFLB’s AI-powered load testing report: Runs load tests in the cloud and applies AI to the results. It analyzes throughput, latency, error rates, and resource utilization, then generates structured reports. These reports include live charts, plain-language summaries, and specific recommendations linked to observed performance patterns. The goal is to give both engineers and non-technical stakeholders a clear view of system behavior without manual data crunching.
- NeoLoad MCP (Tricentis): Integrates Anthropic’s Claude AI through the Model Context Protocol. This allows users to control and query NeoLoad using natural language. For example, a tester can type “Run checkout test at 2,000 concurrent users” or “Summarize the last run,” and the assistant executes the command or delivers a textual summary. This makes test execution and reporting accessible to people who don’t regularly work with NeoLoad’s GUI.
- Future direction — AI-powered scripting: Both PFLB and other vendors are also moving toward AI-generated test scenarios. Instead of writing JMeter or custom scripts by hand, testers will be able to describe desired user behavior in natural language and have the system create a runnable load test. This will lower the barrier to entry further and allow broader teams to participate in performance validation.
Learn more: AI in JMeter
Strengths and limitations
| Strengths | Limitations / Conditions |
|---|---|
| Produces first-draft reports and summaries immediately after a run. | Some AI capabilities may require enterprise or paid tiers. |
| Makes load testing results easier to understand for business stakeholders. | Depth and accuracy vary between platforms; not all AI features are production-ready. |
| Reduces repetitive setup and reporting work through conversational interfaces. | Advanced features like AI scripting are in development, not yet mainstream. |

3. Predictive Autoscaling in Cloud Platforms (AWS, Azure, Google Cloud)

What it is
Autoscaling is the ability of cloud services to add or remove compute resources based on demand. Traditionally, this was reactive: the system scaled after metrics such as CPU usage or request rate crossed a threshold. Predictive autoscaling goes a step further — it uses historical data to forecast traffic patterns and adjust capacity before the demand spike arrives.
How it works in practice
- AWS EC2 Auto Scaling: Predictive Scaling uses machine learning models trained on at least 24 hours of historical CloudWatch data. It identifies recurring daily or weekly patterns, then provisions instances ahead of time. (AWS docs)
- Amazon ECS: Predictive scaling is available for services, applying the same demand forecasting approach.
- Azure VM Scale Sets: Provide a predictive autoscale mode through Azure Monitor. It applies time-series forecasting to metrics like CPU and queue length to schedule scale-outs in advance.
- Google Cloud Managed Instance Groups: Predictive autoscaling uses the past week’s data to anticipate load and pre-warm instances. (Google Cloud docs)
Strengths and limitations
| Strengths | Limitations / Conditions |
|---|---|
| Reduces latency at the start of traffic surges, because instances are already running. | Requires consistent traffic cycles (e.g. business hours, weekly peaks). With irregular or spiky workloads, predictive models may be less effective. |
| Optimizes cost by avoiding both over-provisioning and lagging reactive scale-outs. | Needs a baseline of historical usage; for new applications without stable traffic, predictive scaling won’t work well. |
| Improves reliability for scheduled events (marketing campaigns, batch jobs, etc.). | Forecasts are statistical/ML models — not infallible. Unexpected load outside learned patterns still requires reactive scaling as a safety net. |
4. AI Coding Assistants for Test Scripting

What it is
AI coding assistants such as GitHub Copilot and JetBrains AI Assistant apply large language models trained on public code to suggest completions, generate functions, or explain existing code. For performance testers, these assistants are useful when writing load scripts, setting up test data, or automating repetitive tasks.
How it works in practice
- GitHub Copilot integrates into editors like Visual Studio Code and JetBrains IDEs. It provides inline code suggestions based on the context of your file. For example, when writing a Locust task, it can suggest the full HTTP request block after you type the function name.
- JetBrains AI Assistant combines code completions with natural language queries. You can ask it to explain a section of JMeter test code or refactor a utility function, and it produces results inside the IDE.
- Both tools rely on prompts from the existing code and your recent edits. They do not know your full test environment but can autocomplete boilerplate and common patterns.
Strengths and limitations
| Strengths | Limitations / Conditions |
|---|---|
| Saves time on repetitive boilerplate such as request definitions, assertions, and data factories. | Output may be incorrect or inefficient; all generated code needs review. |
| Can speed up learning for new frameworks (e.g., showing examples of k6 or Locust syntax). | Models have no knowledge of your system’s constraints or non-public APIs. |
| Provides quick explanations or documentation for less familiar parts of a test suite. | Requires internet connectivity and may raise compliance concerns in restricted environments. |
5. Log Analysis with Clustering and Outlier Detection
What it is
Modern log platforms use AI and machine learning techniques to reduce noise in large volumes of log data. Instead of showing every raw line, they group similar messages together, highlight new patterns, and flag unusual activity. This helps performance testers detect emerging issues without manually searching through thousands of entries.
How it works in practice
- Elastic (Elastic Observability / Elastic ML): Offers anomaly detection jobs that model time-series data from logs and metrics. They can forecast values, spot unusual error rates, or surface rare events.
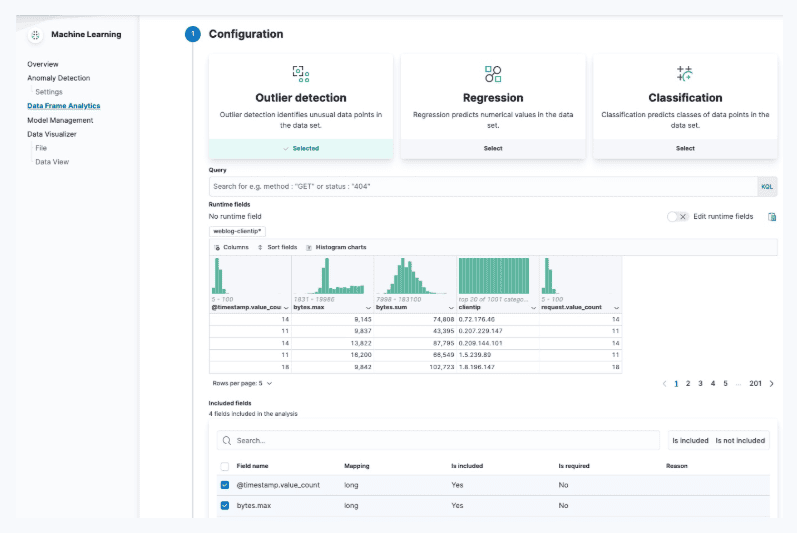
- Splunk: Provides the Machine Learning Toolkit and dedicated anomaly detection apps. These apply clustering, regression, and outlier detection to logs, making it easier to see shifts in error frequency or response codes.
- Sumo Logic: Uses LogReduce®, which groups log lines into clusters to identify dominant patterns, and Outlier Detection, which highlights when a metric or log series deviates from its learned baseline.
Strengths and limitations
| Strengths | Limitations / Conditions |
|---|---|
| Reduces manual triage by grouping repeated errors into clusters. | Requires well-structured and clean log ingestion. Poor parsing leads to poor clustering. |
| Surfaces new or rare error messages quickly, without writing custom regex searches. | Models rely on historical baselines. Sudden changes from deployments or configuration shifts can trigger false positives. |
| Works across large data volumes, where manual review would be impractical. | Advanced anomaly detection often requires paid tiers or additional setup (e.g., Elastic ML jobs). |
6. Monitoring Dashboards with Forecasting and Early Warnings
What it is
Monitoring platforms now include forecasting and predictive alerting features. Instead of only reacting to threshold breaches, they model past behavior to anticipate when a metric is likely to cross a critical boundary. This gives performance testers time to act before a failure or capacity issue occurs.
How it works in practice
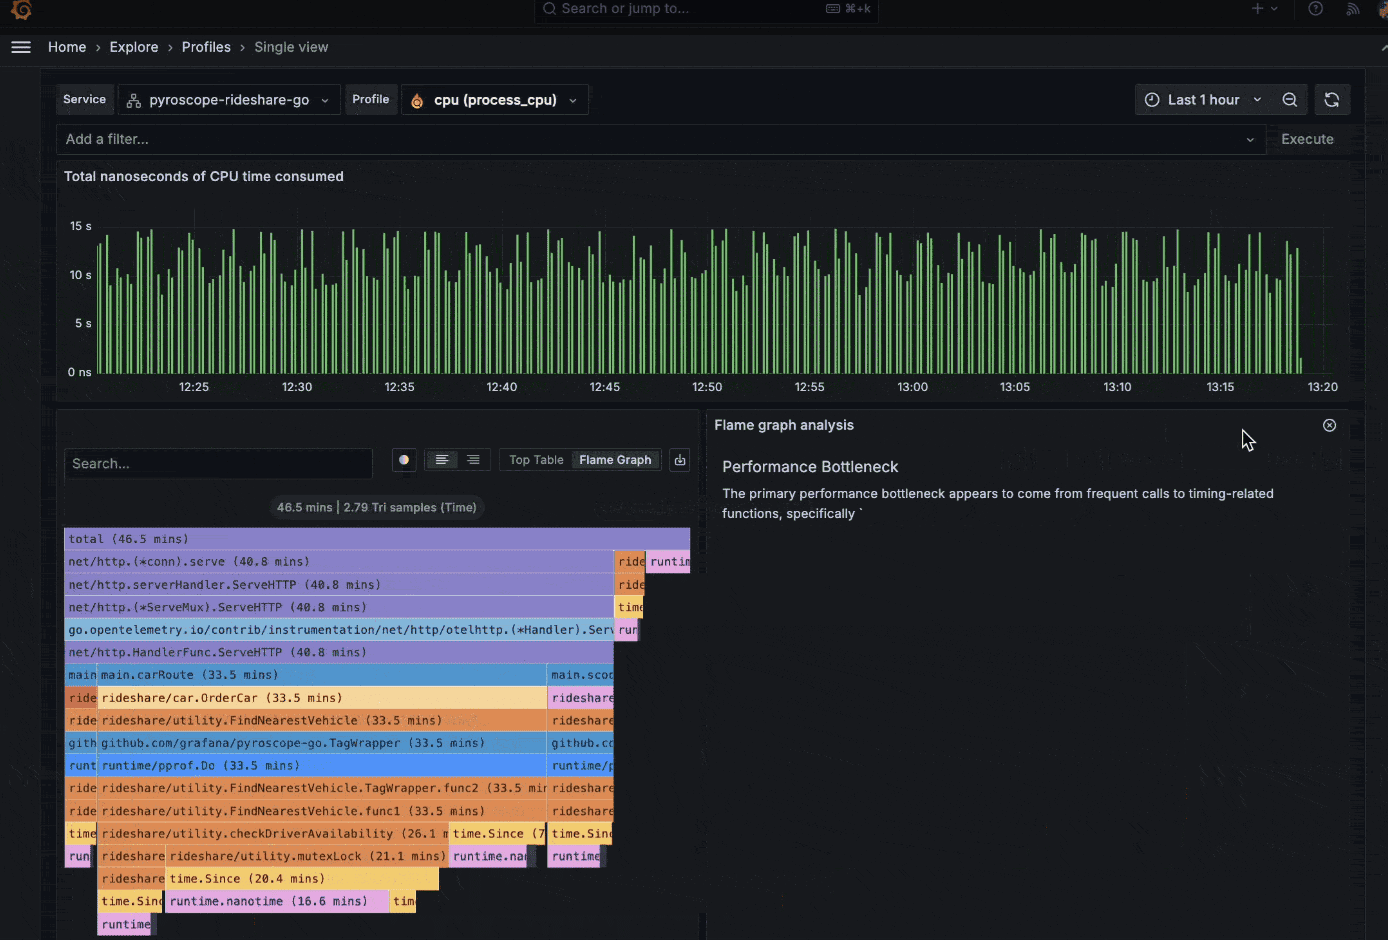
- Grafana Cloud provides ML-based features such as metric forecasting, outlier detection, and dynamic alerting. Forecasting uses historical time series to project future values, often shown as a confidence band on dashboards.
- New Relic offers Predictive Alerts and NRQL (New Relic Query Language) predictions. These apply algorithms like Holt-Winters seasonal forecasting to metrics, predicting values minutes or hours into the future.
- Other platforms (e.g., Datadog and Dynatrace) also use statistical and ML models to forecast capacity, error rates, or user traffic, though these are often embedded within anomaly detection or autoscaling features.
Strengths and limitations
| Strengths | Limitations / Conditions |
|---|---|
| Warns before thresholds are breached, giving engineers lead time to respond. | Requires consistent seasonal or trending data. Irregular workloads limit accuracy. |
| Provides visualization of expected ranges with confidence intervals. | Forecast bands can be wide, reducing usefulness for fine-grained SLAs. |
| Useful for capacity planning and validating performance test environments. | Forecasts are not guarantees — they model history, not unexpected spikes. |
Conclusion
AI is already a standard part of performance engineering, from anomaly detection and predictive autoscaling to reporting and log analysis. The next step is AI-driven scripting, which will allow teams to describe scenarios in plain language and have the platform generate runnable tests. This shift gives people without deep technical backgrounds direct access to load testing — making performance validation faster, more collaborative, and easier to adopt across an organization.