Semyon Zharov,
Performance Engineer at MWS AIWhen it comes to load testing speech recognition and text-to-speech services, the usual approaches simply don’t work. Speech is a streaming signal, handled over binary protocols, backed by heavy models, and subject to strict quality requirements. In this article, we’ll walk through how to design load testing for SpeechKit and what tools can be applied — including some you can build yourself.
SpeechKit Architecture and Use Cases
SpeechKit services are more than just an API that takes a request and sends back a response. Alongside the core speech-to-text (STT) and text-to-speech (TTS) models, the platform usually includes supporting layers such as text normalization, punctuation restoration, and authentication. In some deployments, it may also integrate additional modules: for example, emotion detection, spoofing detection (distinguishing bots from humans), and more.
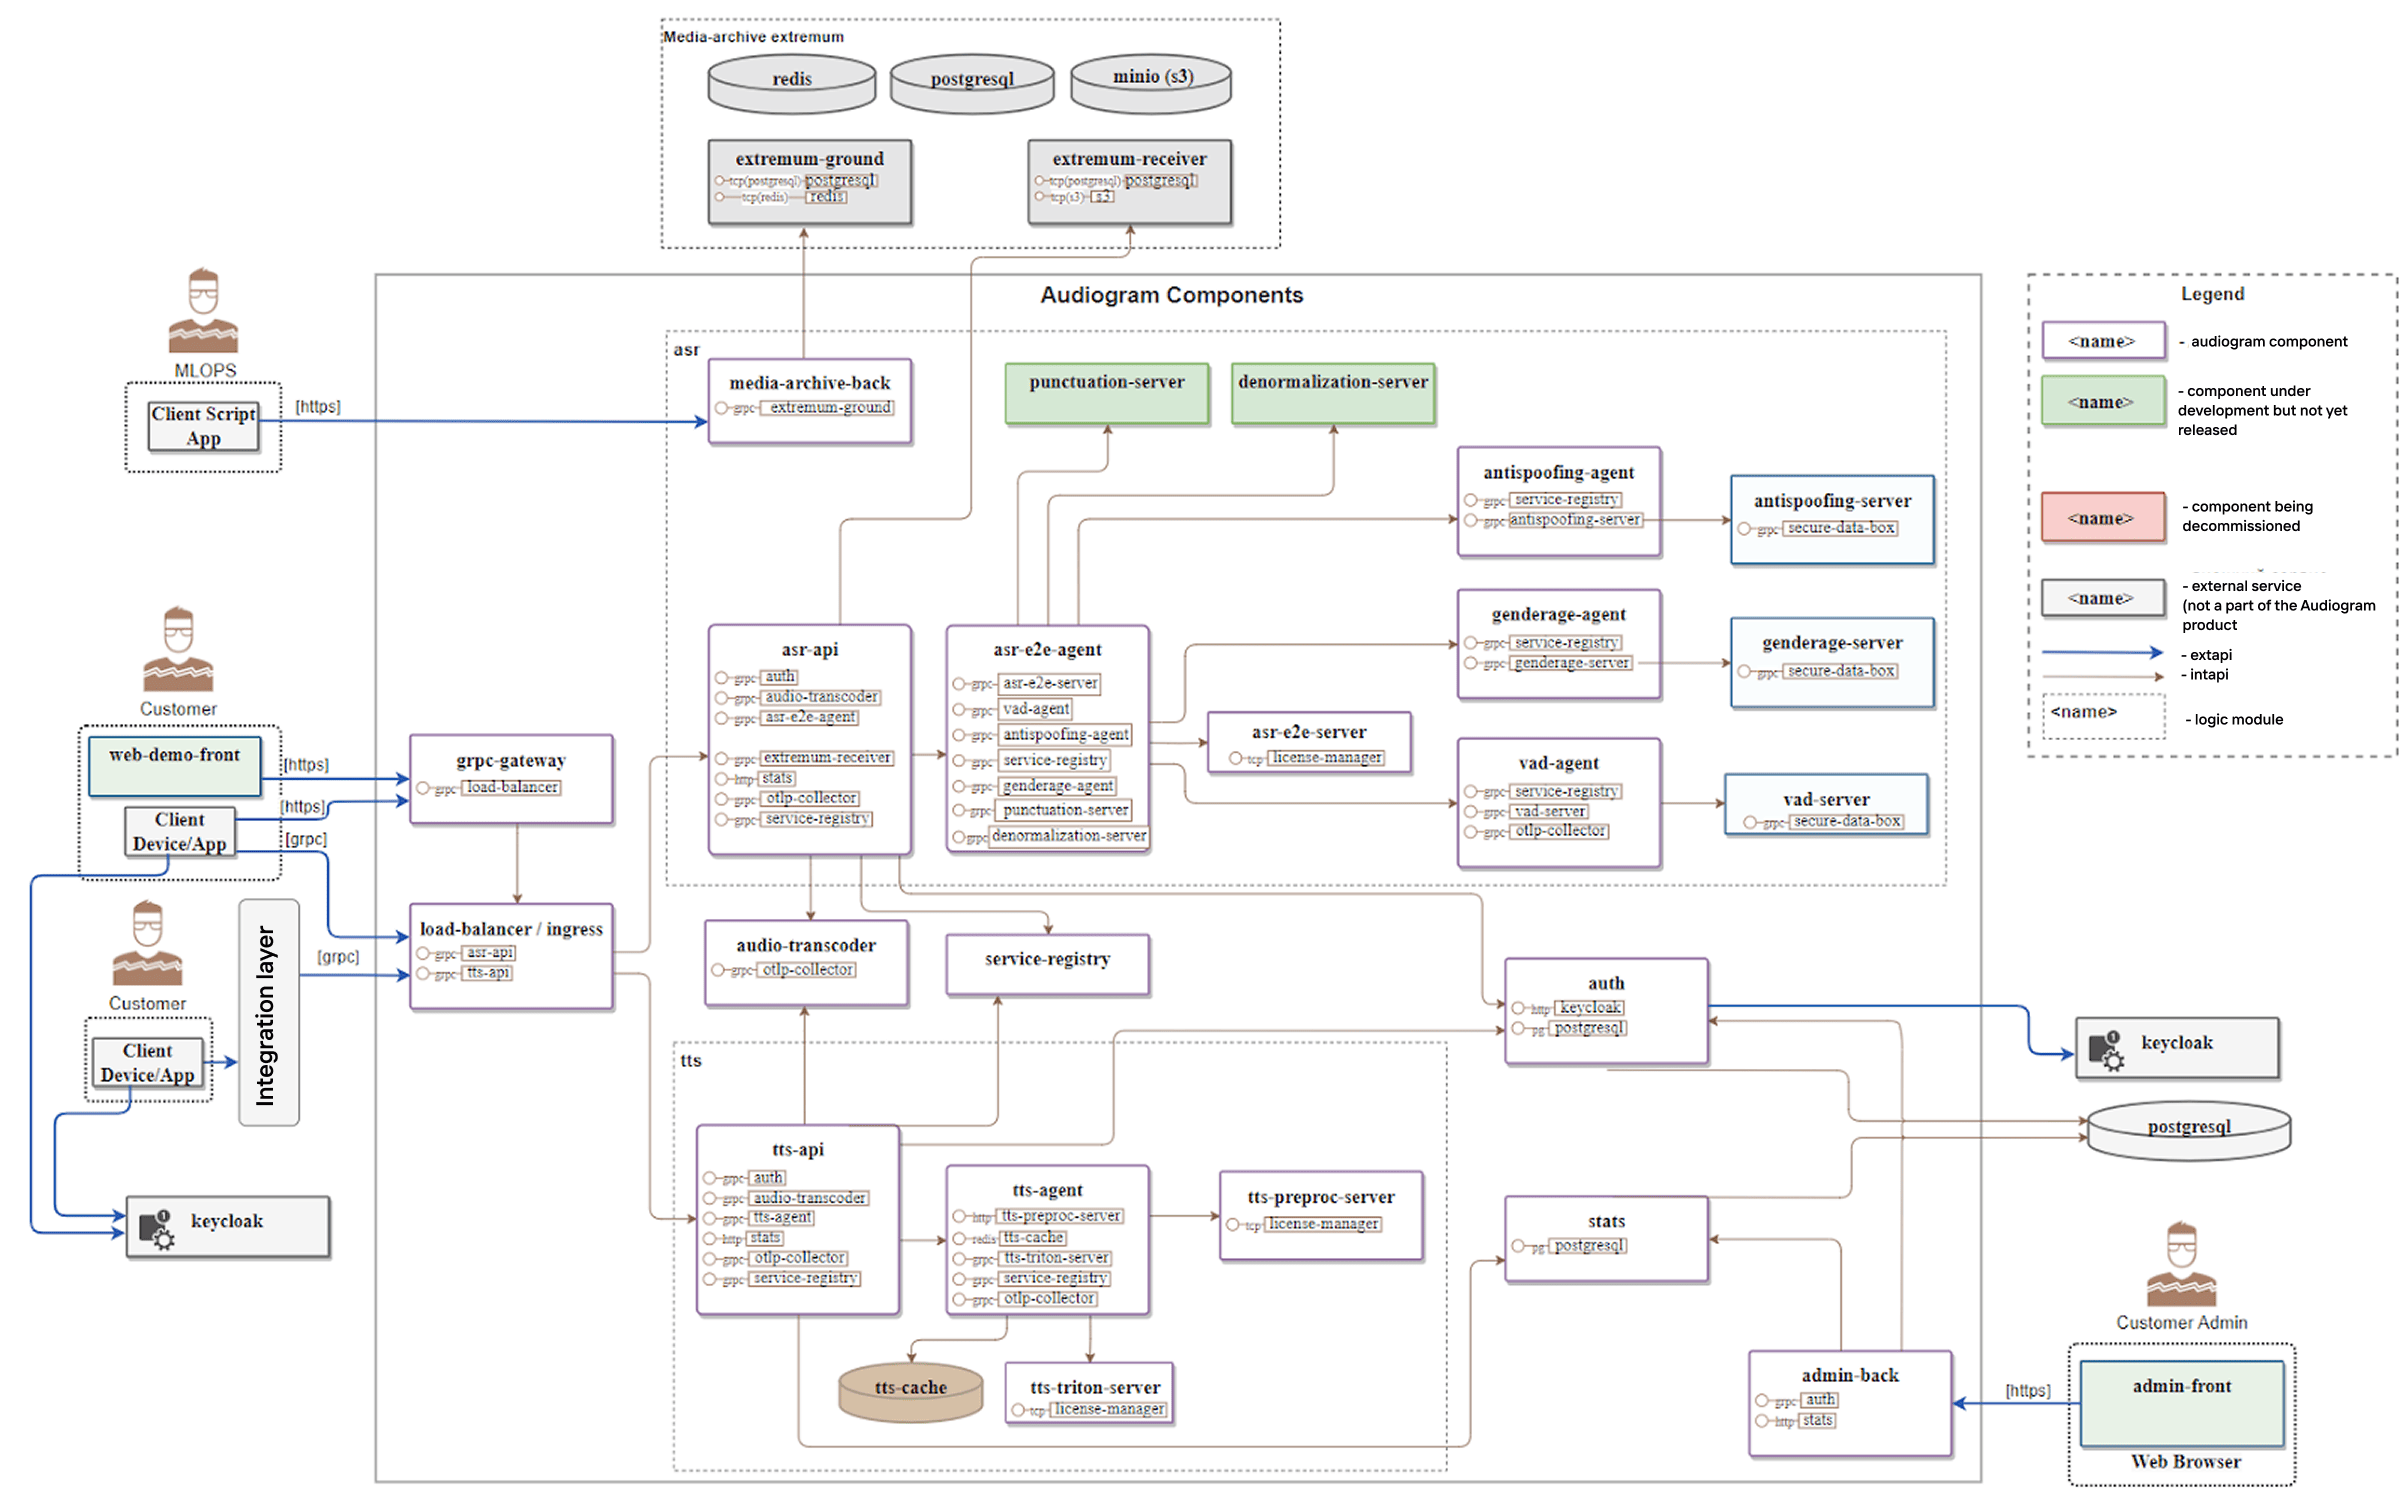
Example SpeechKit components scheme.
Suppose the input text says:
“Flight 2280 from San Francisco departs at 6:00 PM.”
Before sending it to text-to-speech, the text must be broken down into semantic units, emphasising the flight number and departure time. In other words, we should perform the text normalization first.
What you actually get is a microservices architecture running on Kubernetes, designed to handle unpredictable traffic patterns. Some components must run as stateful services with persistent data storage, while others can be deployed as stateless services.
Beyond the core speech recognition and synthesis modules, there is an infrastructure to keep the entire architecture working together: a set of common services, a set of media services, and an authentication layer. And since nothing works securely without proper authentication today, the system dedicates as many as six separate services just to handle it.
How to Choose a Testing Tool for SpeechKit
Technical requirements
- Asynchronous by design. That’s the nature of these use cases. You can’t realistically test streaming TTS/ASR in a synchronous, offline request/response model.
- Speaks Google Protocol Buffers (Protobuf). This is SpeechKit’s primary wire format.
- Enables side-by-side comparisons across vendors and criteria. The market is young and crowded; cheaper ≠ better.
- Handles complex target-system configurations. Must account for combinations of environment variables across multiple services.
- Runs inside Kubernetes. The system under test (SUT) is typically deployed on K3s/K8s.
- Supports non-standard usage scenarios. For example, launching from a Jupyter session to a remote host, or traversing a chain of jump/bastion hosts.
- Accepts domain-specific inputs. Audio corpora plus speech annotations (transcripts, timestamps, labels).
- Supports automation at scale. ML model outputs are non-deterministic: try to synthesize the same prompt 10 times and you’ll get 10 slightly different results. Large-batch human review is impossible to scale.
Project requirements
- Adapts quickly to contract (proto) changes. Contracts evolve frequently: schemas and validators must be updated without breaking test scenarios.
- Works with dynamic metrics. Metrics and target benchmarks also change often — ideally, they should be swapped without rewriting tests.
- Supports high-velocity ML experimentation. ML teams generate lots of hypotheses and expect rapid validation, so tests must provide fast feedback.
- Respects constraints of the dev team. Developers have plenty of code but limited time; setup and integration should be minimally burdensome.
- Allows flexible reporting formats aligned with business goals. Reports should adapt to quarterly KPIs.
- Makes it easy to onboard new datasets. Each dataset can bring a new input format. For example, adding emotion-recognition requires a fundamentally different dataset with specialized annotations.
- Enables regression against prior versions. Teams should quickly check performance and compare it with previous releases.
- Can run tests in production environments. Sometimes that’s the only way to get results that are truly representative of real-world conditions.
SpeechKit testing serves multiple purposes:
- Determine performance limits on current hardware.
- Evaluate the impact of new models and configurations.
- Validate stability across releases.
- Benchmark against competitors on the same datasets.
And most importantly, not just measuring throughput, but also ensuring that the quality remains acceptable.
Load Profile
To picture a load profile for speech recognition, just imagine a phone booth. Someone steps inside, has a conversation, hears voices, speaks — and everything gets transcribed.
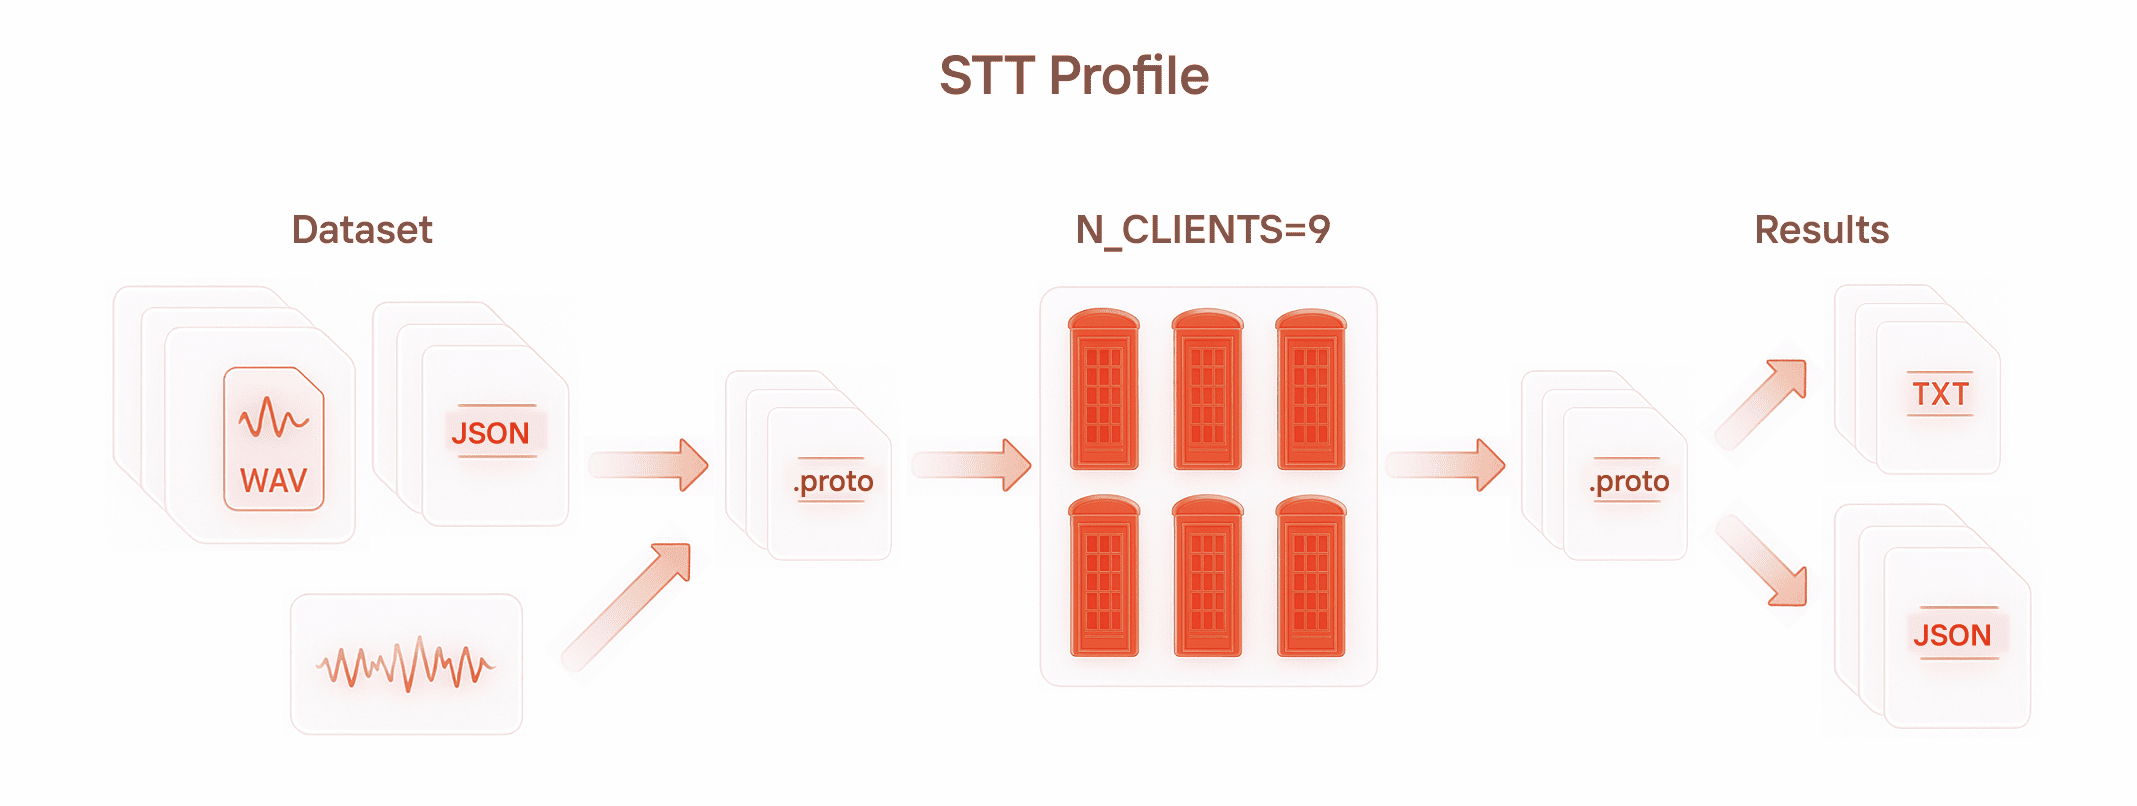
Our virtual user serves as that phone booth, trying to digitize all incoming voices. As input, we can feed either structured data (JSON annotations + audio files normalized into a single format), or just raw audio that must first be processed through FFmpeg to make it compatible. The output comes as Protobuf messages containing either plain-text transcripts or JSON descriptions.
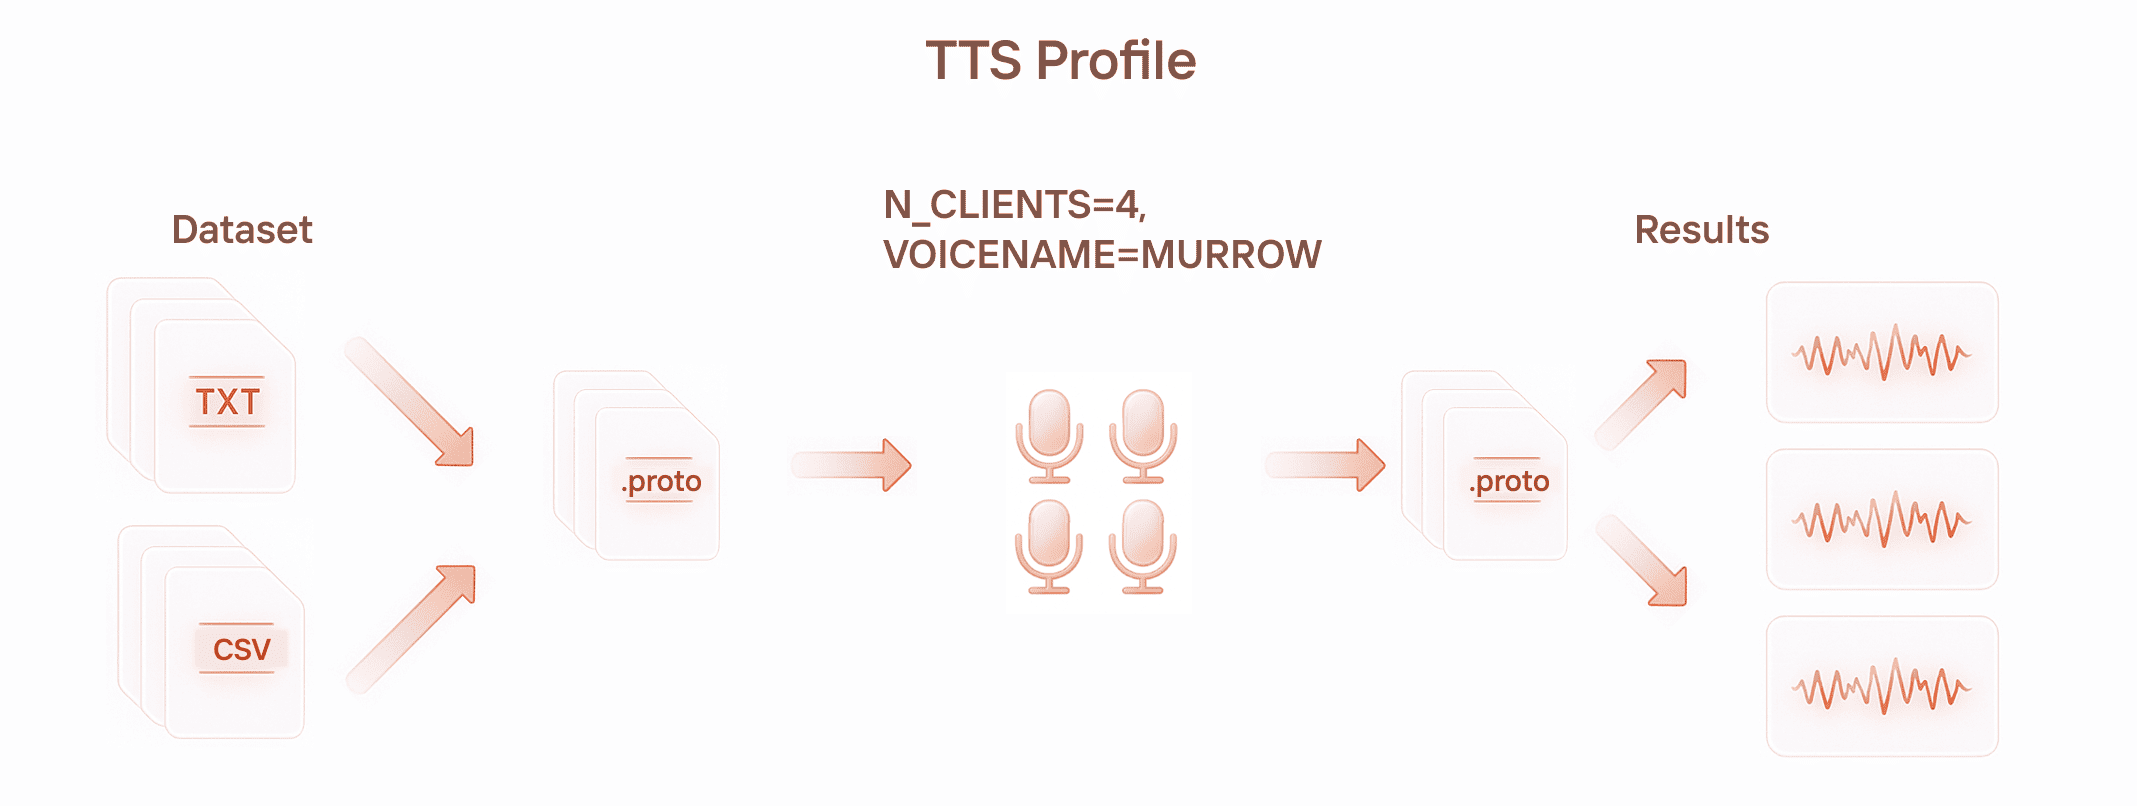
For speech synthesis, the analogy is a broadcaster: they constantly receive new text and keep voicing it. We need to spin up as many of these virtual users as possible and keep them running. The output is usually an audio stream, which we may further process through FFmpeg.
The ultimate goal of load and performance testing is to determine how many such “phone booths” and “broadcasters” we can run on the available GPUs.
Why off-the-shelf tools fall short
| Option | LoadRunner | Locust | Apache JMeter |
|---|---|---|---|
| Pros | Mature, enterprise-grade tool with a long track recordWide protocol support out of the boxStrong reporting and analysis features | Python-native, fits naturally into ML/ASR workflowsCan be scaled horizontally to drive large test loadsIncludes a simple GUI for live metrics during test executionConvenient to feed domain-specific inputs like audio corpora and JSON annotationsCloud/Kubernetes friendly | Open-source and widely adoptedLarge plugin ecosystem and community supportGUI makes it easy to start quickly |
| Cons | Commercial and expensive licensing modelHeavyweight setup; not cloud-native by designLimited flexibility for Python-based workflows (SpeechKit stack is Python-first) | Best suited for HTTP; gRPC/Protobuf streaming requires custom wrappers or community pluginsBased on gevent; some Python libraries may not play nicely with its event loop.Synchronous execution model: lacks support for streaming gRPC. | Java-based; lacks native Python supportNot well-suited for streaming protocols or Protobuf-heavy APIsCan be resource-intensive and less efficient at scale compared to modern load tools |
We have tried several options. Engineers like Locust for its Python-first workflow, but the synchronous execution makes it a poor fit for streaming load. JMeter is powerful, but adapting it for gRPC and streaming audio turns into a project of its own. Over time, the conclusion became obvious: to build our own tool.
How We Built Our Own Load Testing Tool
Tools and frameworks
- Core architecture.
We built the foundation on FastAPI and added asynchronous support via IOHCP and Asyncio to keep the codebase clean and structured. Entities are defined using Pydantic models, and Uvicorn serves as the web server. - Code quality without unit tests.
We didn’t have the resources to develop full unit test suites. Instead, we leaned heavily on static analysis: enabled Ruff with all the available rules, set up pre-commit hooks to block unwanted changes from reaching the repo, and enforced type annotations with mypy. - Media handling.
For audio processing — our primary use case — we rely on FFmpeg, the de facto standard for media work. Data protocols are described with Google Protobuf, which fit our requirements perfectly. Dependency management and versioning are handled with Poetry, letting us lock library versions and package the tool as a proper Python package.
Process Organization and Challenges
Although the API looks simple, it relies on an extensive set of parameters. The heaviest configuration burden comes with speech recognition tasks (STT). Let’s look at the main challenges and how we addressed them.
Codebase complexity
First, you need an engineer who is comfortable with asynchronous queues and has at least some background in performance testing. Such expertise is not easy to find. The project codebase keeps growing, but smooth onboarding is realistic. In our experience, a new engineer can get fully up to speed in about 4–6 weeks.
Working with the queue
From this data, we form the test request. Here, Pydantic models help a lot: they simplify serialization and deserialization of objects, requiring only a clean parameter definition. A worker process is also required to consume the queue.
The load process itself is quite straightforward. We spin up a queue to hold source audio files. Datasets can be quite large — one of them was about 7 GB — so efficient memory distribution and synchronous reading from the queue are critical. Responses are collected in a separate queue.
Importantly, the queue test cycle does not depend on what vendor we’re testing. The tool simply takes the job and launches a load test against the selected vendor. The only difference is that for our in-house solution, we have access to more internal configuration options.
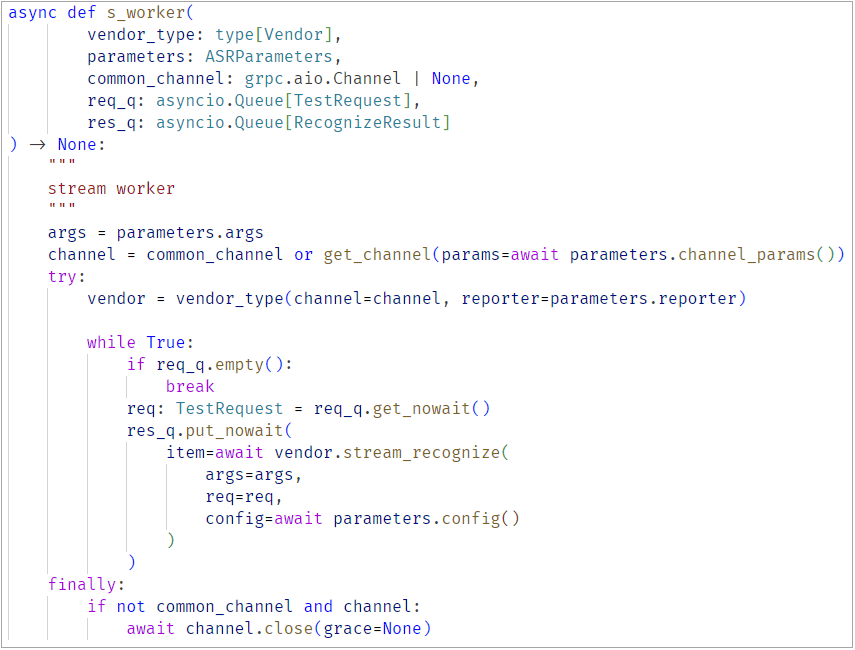
The worker is decoupled from the specific gRPC stub of any given vendor.
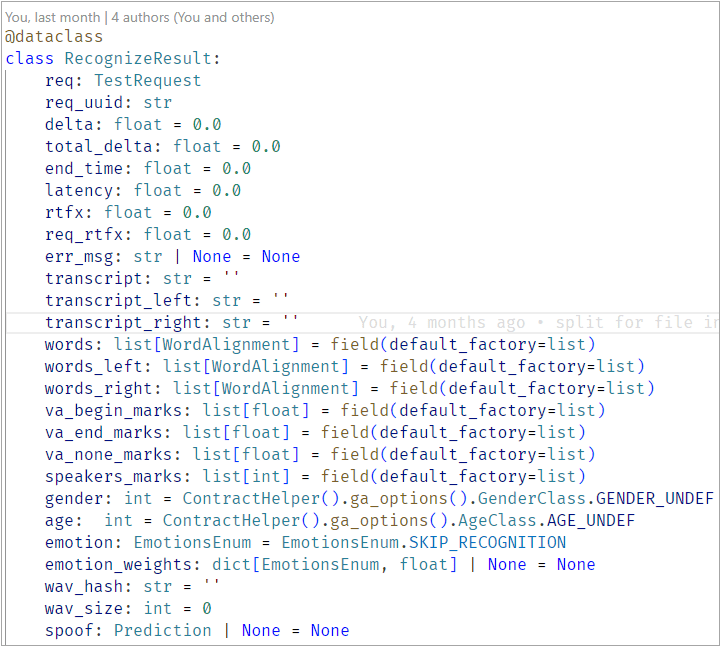
Processing recognition results
The output is a composite result that includes:
- Timestamps for each recognized segment.
- Latency — the time from sending the first audio chunk to receiving the final hypothesis. (It can’t be measured naively: the audio stream must be split into chunks of appropriate length and sent sequentially.)
- Transcription results, including channel separation (left, right, stereo).
- Additional analysis models: gender, age, and emotion detection.
- A spoof field, indicating whether the fragment is genuine human speech or synthetic output.
Building a vendor-agnostic framework
Once we had assembled the core components, the next step was to design a vendor-agnostic framework. We implemented an abstract class that makes it possible to integrate any API defined in Protobuf files with a specific provider. This class contains the common methods: building a configuration, running speech recognition, performing emotion detection, and so on.
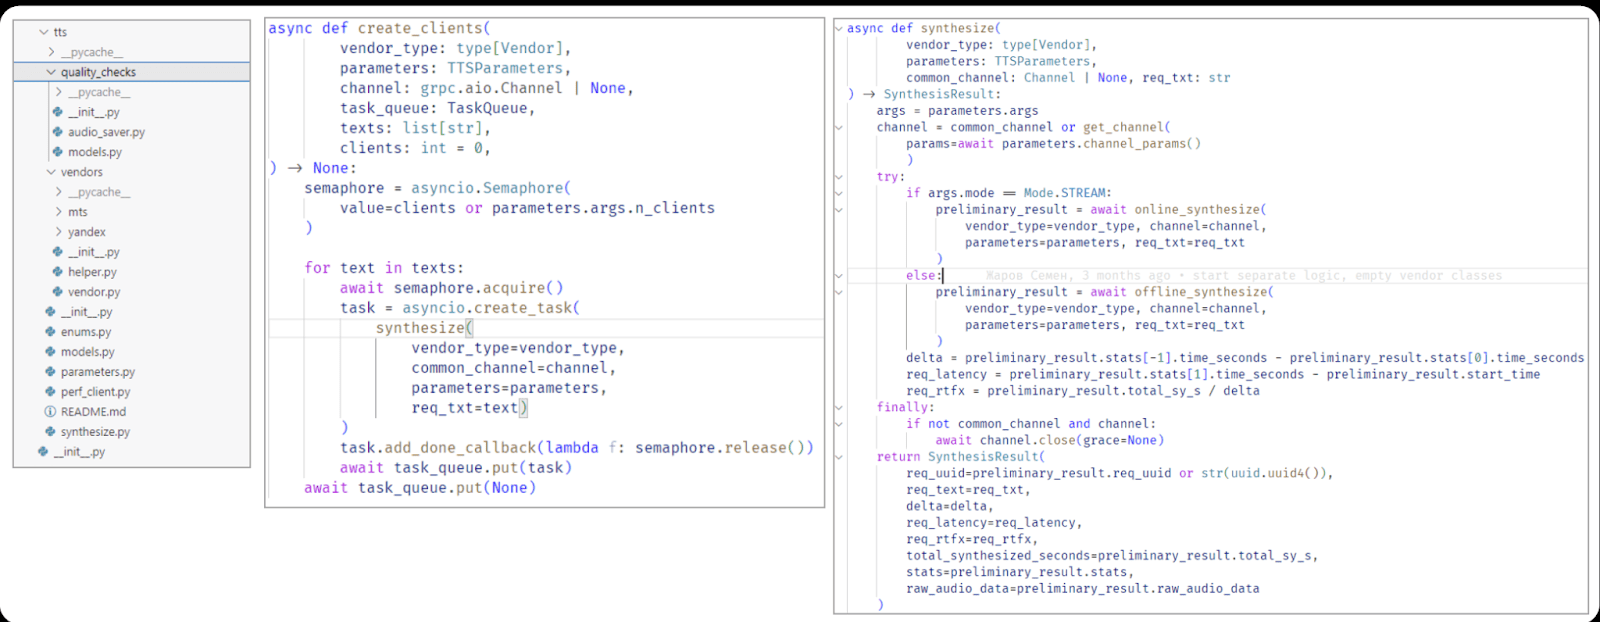
TTS: implementing queues for speech synthesis.
In speech recognition (STT) testing, we need to store and process huge amounts of audio files: thousands of recordings totalling gigabytes. With TTS, the workload is far more compact: even hundreds of thousands of text variants take up significantly less space than audio. Because of that, in TTS we were able to avoid using dual queues. Instead, we rely on a semaphore: its value is set equal to the target load intensity (i.e., the number of virtual users), and tasks for speech synthesis are dispatched through it.
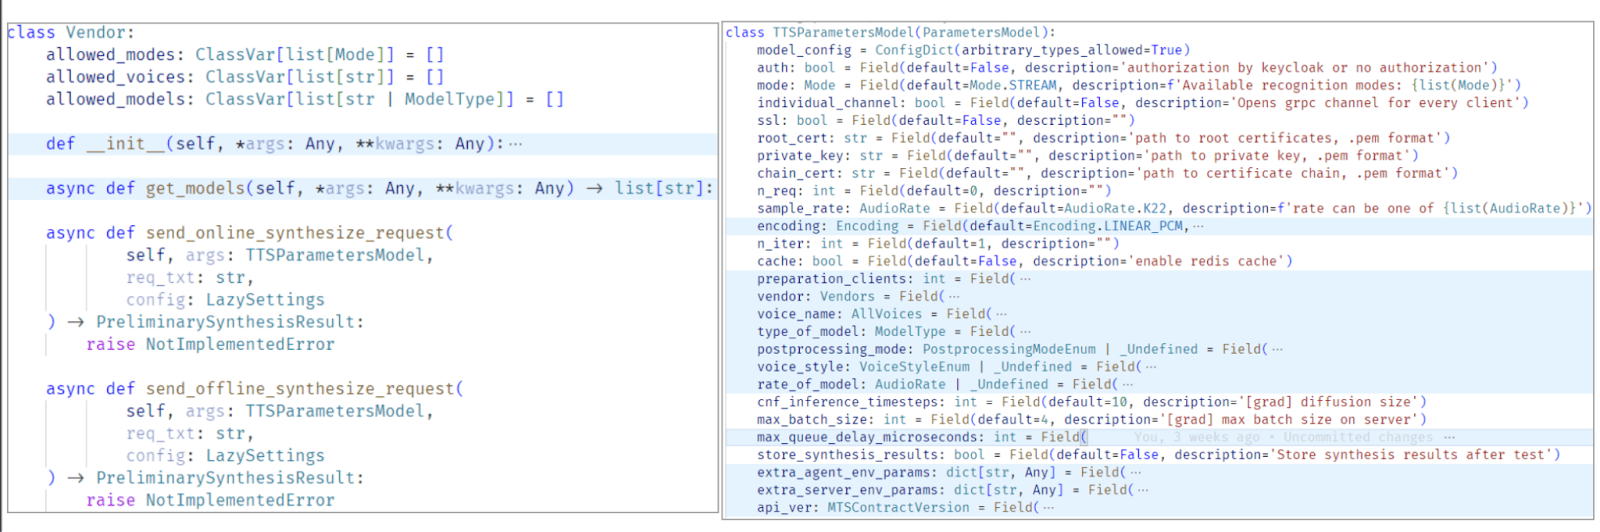
A unified parameter model, independent of vendors and other conditions.
We currently test speech synthesis (TTS) only in a streaming mode. This is especially relevant when a counterpart responds in real time and the system gradually synthesizes the reply.
For speech recognition (STT), both modes are relevant:
- Streaming — when online dialogue is required.
- Offline — for batch jobs, such as transcribing an entire book, where real-time processing isn’t necessary.
For both STT and TTS, we implement separate classes for each vendor. The main difference is that TTS comes with additional complexity related to voices. Typically, a TTS model is not just a single algorithm but a full set of parameters, for example:
- Model type — monotone vs. expressive (intonation-aware).
- maxBatchSize — the maximum size of an audio fragment that can be submitted for processing.
- delay — the inter-chunk pause in microseconds between audio segments.
At first glance these are just numbers, but they are what make a synthesized voice sound more “human.” By tuning parameters, you can turn speech from a flat, monotonous robot into something with intonation and emotion. Of course, you won’t fool anti-spoofing systems: to an algorithm, the signals will always be synthetic. But to a human ear, these settings make the ML-voice noticeably more natural and pleasant.
Working with TTS results is simpler than with STT ones. For STT, we deal with many output fields — while in synthesis there are essentially only two of them: processing time and the final audio signal.
What’s not simple is to automate quality checks for TTS. To verify that the generated audio is correct, we add lightweight post-processing routines. They ensure that the number of synthesized seconds matches expectations and that there are no “lost” fragments in the output.
Integrations & Reporting
TTS testing turns out to be very tranquil, almost meditative. In the morning, we review reports, inspect charts, and scan logs. For that, we built an integrated reporting system:
- Jaeger — to trace both the fastest and slowest requests.
- Mattermost — to set notifications on performance test start/finish, plus a brief test summary.
- Confluence — to store human-readable reports along with links to charts, metrics, and environment status (nightly, post-release, and comparative runs).
- JFrog Artifactory — to store reports, including synthesized audio samples for up to a year.
We use the same logging library as in our production applications. That makes it convenient to pull logs directly from OpenSearch.
K8s / K3s Management
The entire tool runs in Kubernetes. When a vendor wants to deploy the system in their own environment, we provide ready-made Helm charts for quick setup. Most of the time, there are some additional requirements on the customer side: some want to tweak cluster parameters, others experiment with full shutdown settings or alternative modes. That’s why verifying how tests behave under different conditions is so crucial.
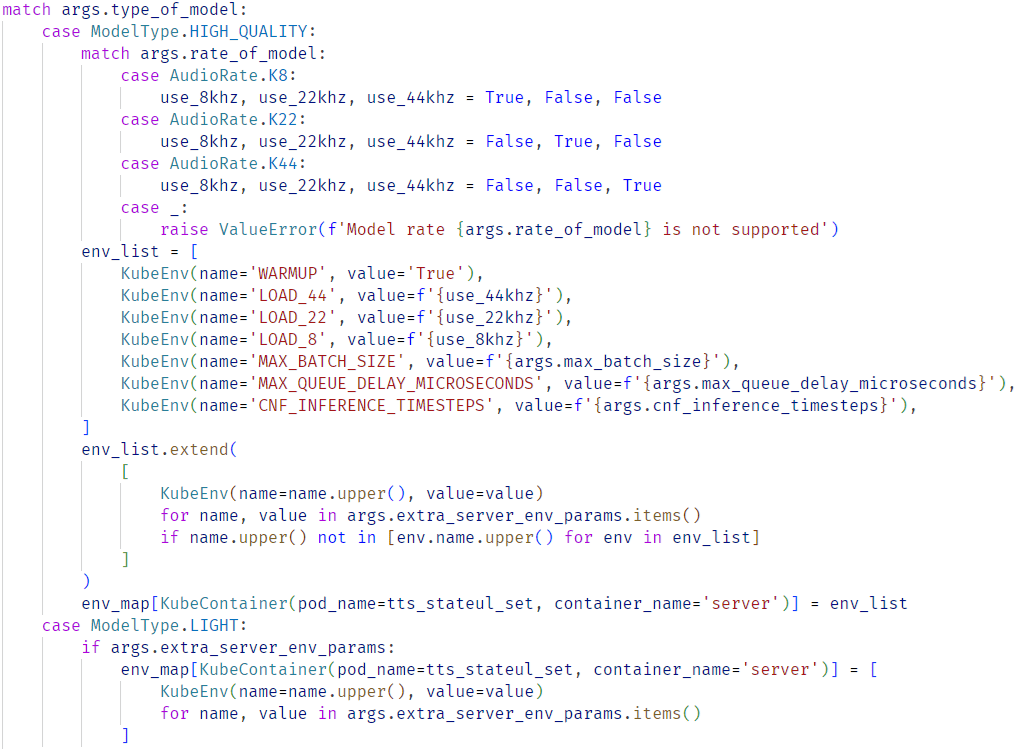
Full configuration of the Kubernetes namespace. Any combination of env-parameters.
For flexible configuration, we use the kubernetes-synkio library for Python. It supports asynchronous operations and is more convenient than the official client. We used it as a base to build our own client that allows reconfiguring the cluster directly from a test scenario.
- If a TTS model is available in multiple sample rates (8 kHz, 16 kHz, 22 kHz, 44 kHz), during load tests, you can disable the heavier frequencies and keep only the required range.
- The parameters controlling the synthesis diffusion size can be adjusted to validate different runtime scenarios.
Dataset Management
For dataset storage, we use ClearML, with all the necessary integrations built on top. Datasets can be pulled by name directly from ClearML (the default mode), passed via API at test startup (useful when running the same dataset across different configurations), or provided as a local flag (handy for debugging).
We work with different dataset types:
- Open datasets (e.g., Dusha for TTS): available on GitHub, can be uploaded into the system and reused in tests.
- Confidential datasets (TTS), such as recordings of phone conversations: stored in an isolated environment and excluded from load testing, but used for comparative evaluations.
All the datasets are wrapped in Pydantic models, which makes them easier to manage. Supported formats include text, audio, and CSV (e.g., when text data alone is insufficient).
Quality Metrics for SpeechKit Testing
RTFx and Latency
In addition to basic checks, we track performance metrics. Everyone is familiar with latency — the time it takes the system to respond. But our key metric is RTFx (Real Time Factor).
RTFx shows how much useful work the system completes per unit of time. Depending on the scenario, this may be:
- number of recognized text characters per second, or
- number of seconds of synthesized audio generated per second of real time.
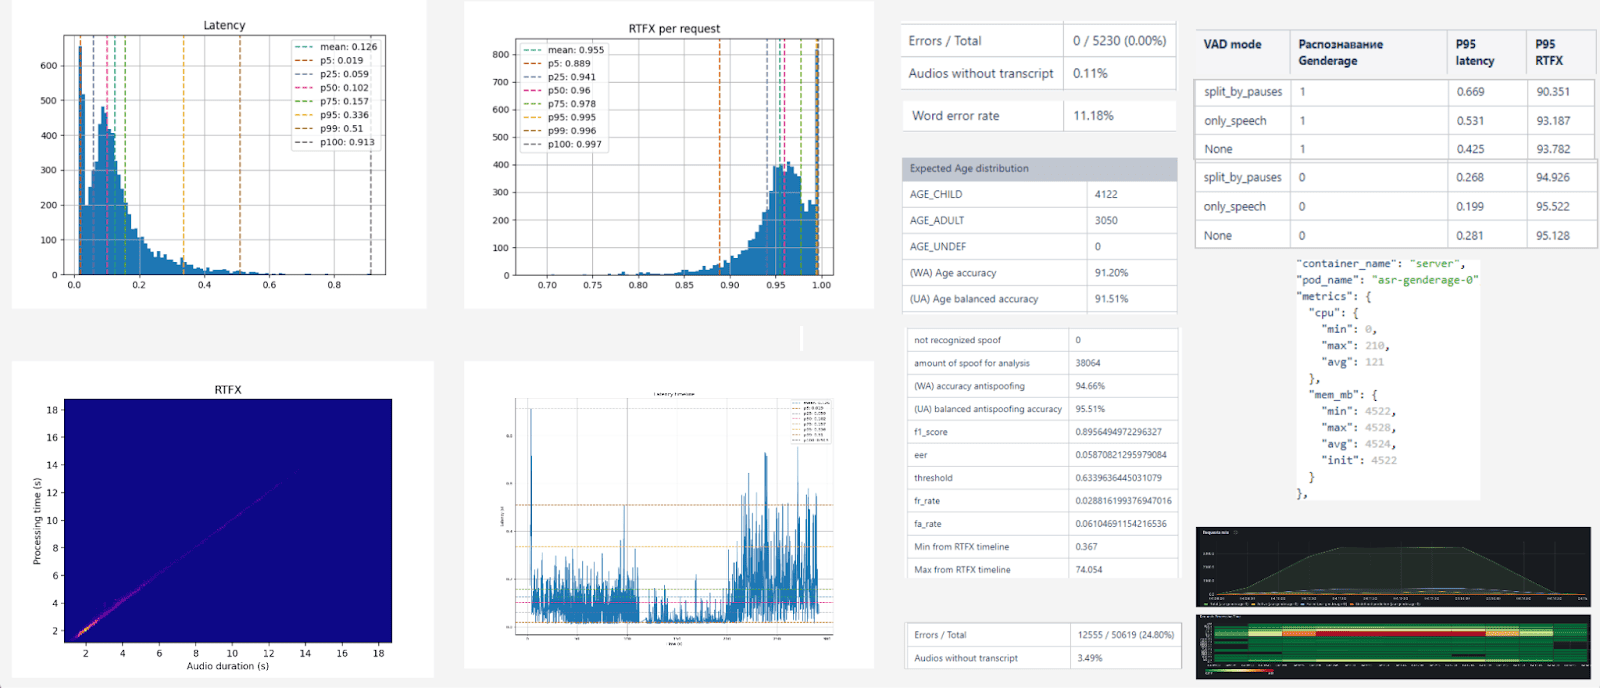
Latency and RTFx charts for STT.
Essentially, RTFx is inversely proportional to latency: the lower the delay, the higher the system’s effective throughput.
Latency values are not meaningful in isolation. For example, in a dialogue with a virtual agent, audio is split into small chunks, so the per-chunk delay isn’t critical. That’s why vendors rarely report raw latency as a headline metric.
RTFx, on the other hand, provides a much clearer picture of overall system speed. It allows different solutions to be compared side by side and performance to be judged in realistic scenarios.
GPU Utilization
The primary goal of our load tests is to maximize GPU utilization. GPUs are expensive: an industrial-grade NVIDIA A100 costs around $15,000. The challenge is clear: if a $15,000 GPU is only 20% utilized, the money is essentially wasted. We run tests to determine how to load GPUs with as much useful work as possible.
Some services, such as anti-spoofing, consume GPU resources aggressively, effectively monopolizing a card. Others may use only 10–40%. We therefore test which services can safely co-locate on the same GPU, ensuring the hardware is used to its fullest.
It’s important to conduct such tests on a regular basis. For example, when new NVIDIA A40 cards were purchased, we ran the same load tests on them. The objective remains the same: minimize the number of GPUs in use while maintaining service performance.
RTFx (Real Time Factor)
If RTFx continues to grow as the number of clients increases, it means the hardware is not yet fully utilized. If RTFx flattens or begins to drop under load, that’s a clear signal we’ve reached the limit.
For example, with 100 concurrent clients, RTFx is lower than at 150. But after ~150–175 clients, it stops growing; if we increase the load further, RTFx would decline again. That means we’ve already squeezed everything possible from the hardware.
WER (Word Error Rate)
This metric lets us compare speech recognition quality across vendors. It not only helps optimize resources but also benchmarks against competitors on real-world results.
Evaluation is done on the full dataset:
- WER is high = the system makes many recognition errors.
- WER is close to zero = the result is almost ideal (which barely ever happens).
Load testing is what makes this metric visible under real conditions: speech recognition quality simply can’t be assessed without testing on a large data stream.
Resource Metrics
We track maximum and average CPU utilization, memory consumption, and monitoring data from Grafana and Prometheus. All of these charts are automatically attached to reports and help analyze load behavior.
We run a series of tests on the same dataset, gradually increasing processing complexity:
- Baseline recognition.
- Recognition + noise and pause trimming (including filler sounds like “uh,” “um,” etc.).
- Recognition + gender and age detection.
- Recognition + bot / non-bot check (a particularly GPU-intensive operation).
- Final test: full recognition plus all available additional operations.
This approach shows how each feature we add affects performance and resource usage — as well as how latency and RTFx change under different conditions.
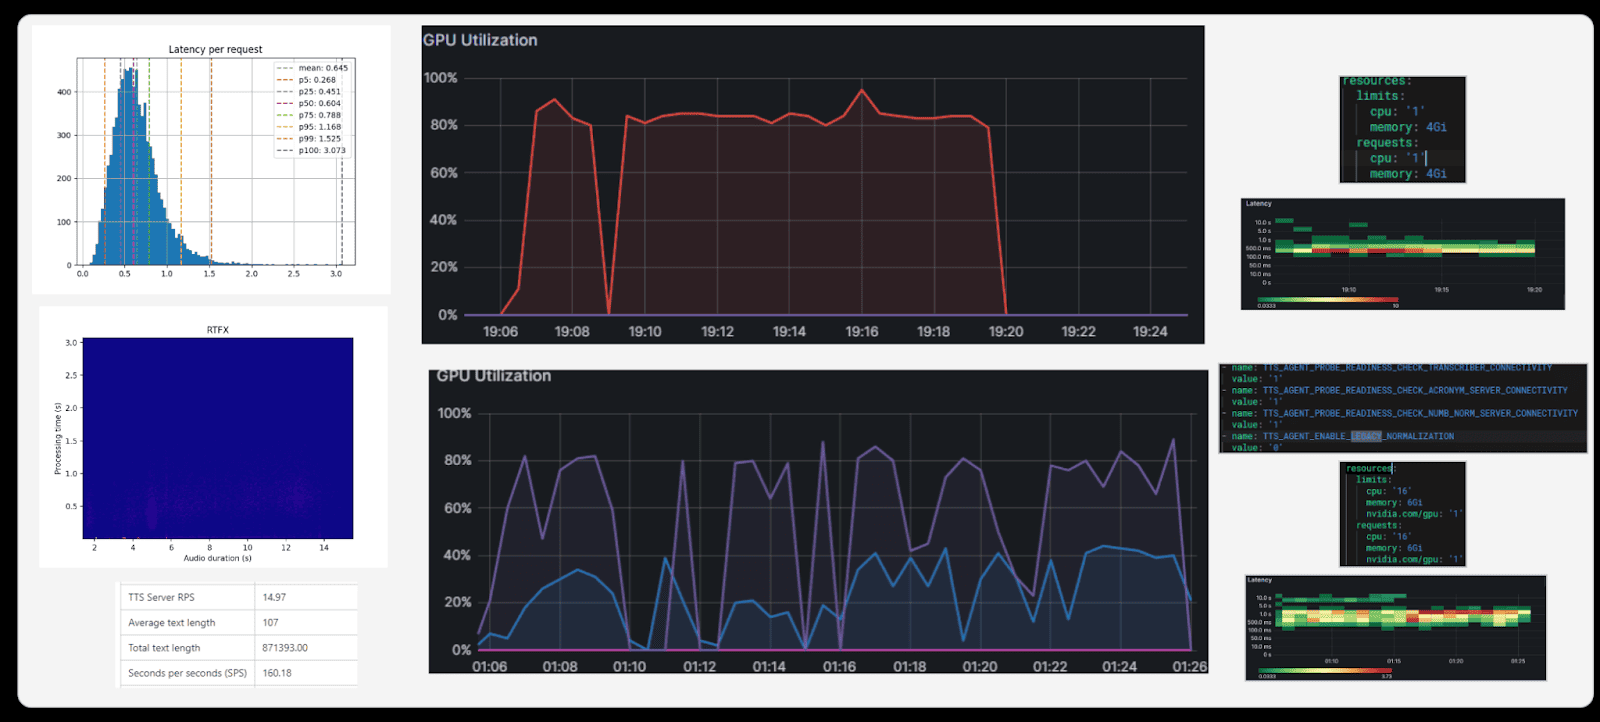
Above: TTS Results
Testing Schedule
- Nightly. Most tests run at midnight to collect statistics on in-flight versions (hash commits) [QA].
- Every release. A release is considered acceptable only if there are no regressions or errors at the tested load levels; most QA tests run every release as well.
- New functionality. Newly developed features require partial test coverage and may be executed by the author [DEV].
- New hardware configuration. Used to determine current limits for subsequent Helm-chart commits or client recommendations [QA / DevOps].
- Vendor comparison. Run on demand [Analysts / Managers].
- Model parameter optimization. Once the ML team needs to search for optimal configurations [ML].
As a result, our testing framework has grown into a full-fledged tool for the ML team. Of course, engineers can always run their models directly on their workstations, but that doesn’t make much sense. Instead, we provide a dedicated performance environment: a ready-made infrastructure and service where you can:
- launch your model with the desired parameters;
- apply load;
- obtain results in a convenient format.
This way, developers and researchers save time and resources, while we maintain a single standard for performance testing of SpeechKit models.
What’s Next on the Roadmap
Our tool already has its own audience, but there’s still plenty ahead. If you ever decide to build your own tool, some of these further steps will prove useful.
- More competitive benchmarking. We’d like to expand head-to-head comparisons with competitors. The challenge is that not every vendor is willing to participate: some companies do not provide their models for demo, while other solutions are not always easy to procure.
- Growing the user base. The tool is evolving into a full-fledged product, and the more people use it, the faster it matures.
- Add tests for individual ML components, not only at the end-to-end level.
- Gradually formalize the codebase into protocol-level structure (Python doesn’t provide such a foundation out of the box, so we’ll need to design our own).
- Maintain and grow the codebase: there are already ~16,000 lines of core code, part of which we’ve factored into a separate library used by both QA engineers and ML researchers.
- Collect long-term statistics: we’re storing data in ClickHouse and plan to accumulate more and more metrics there.