Ever wondered whether you should stick with Apache JMeter or move your tests to BlazeMeter? Both tools are powerhouses in performance and load testing, but they serve different needs.
JMeter is an open-source desktop tool under the Apache 2.0 license; ideal for local or distributed testing across HTTP, APIs, JDBC, and more. BlazeMeter, on the other hand, is a commercial SaaS platform by Perforce that builds on JMeter’s foundation, running the same scripts (and more) at cloud scale with advanced collaboration, reporting, and automation features.
In this comparison, we’ll break down features, pricing, and best-fit scenarios, helping you decide when to use each, or even combine both for maximum testing flexibility.
What is JMeter?
Apache JMeter is an open-source performance testing tool designed to measure and analyze how web applications, APIs, and services perform under load. Released under the Apache 2.0 license, it supports various protocols, HTTP, HTTPS, JDBC, JMS, FTP, and TCP, and can run both locally and in distributed mode across multiple systems.
Key benefits:
What is BlazeMeter?
BlazeMeter is a cloud-based performance testing platform developed by Perforce. It extends Apache JMeter and other open-source tools like Gatling, k6, and Selenium by offering a scalable, SaaS environment for load testing, functional testing, and API monitoring. Built on Taurus engines, BlazeMeter allows teams to run familiar JMeter (JMX) scripts at cloud scale while gaining advanced reporting, collaboration, and test data management features.
Key benefits:
BlazeMeter vs. JMeter: Comparison Table
The following table highlights the key differences between Apache JMeter and BlazeMeter, covering usability, scalability, collaboration, and pricing, everything teams need to choose the right solution for their performance testing workflow.
Key Differences (Deep Dive)
When it comes to BlazeMeter vs Apache JMeter, the main distinction lies in where and how you run your tests. JMeter is a local, open-source tool that gives testers complete control, while BlazeMeter extends it into a managed cloud environment with scalability and analytics built in.
Difference Between JMeter and Blazemeter
BlazeMeter vs JMeter: Nature & Core Purpose
JMeter is an open-source desktop application used to create and run performance tests from your local machine or distributed network. It’s ideal for technical teams that prefer hands-on control, script customization, and self-managed infrastructure.
BlazeMeter, meanwhile, extends JMeter and other open-source tools into a cloud-native platform. It lets you upload your existing JMX files, run them at scale, and analyze results in real time, without worrying about infrastructure limits or setup.
Ease of Use & Onboarding
JMeter offers a classic test-plan tree interface with samplers, listeners, and assertions. While powerful, it has a learning curve; beginners often spend time setting up environments and fine-tuning thread groups.
BlazeMeter, in contrast, is more intuitive: you can upload a JMX file, configure test parameters, and launch runs directly in the browser. It also provides scriptless test creation, so non-technical team members can contribute to testing without writing code.
Scalability & Geo Distribution
Scaling JMeter means adding and managing your own distributed nodes (master–slave setup), monitoring CPU and memory usage, and ensuring stable connections between generators. It’s effective, but maintenance-heavy.
BlazeMeter eliminates this by handling scaling in the cloud. You can simulate thousands of concurrent users from multiple global regions (e.g., US, EU, APAC) in minutes. The platform automatically provisions resources, manages infrastructure, and provides unified reports across all regions.
Reporting & Analytics
JMeter produces basic HTML reports and CSV outputs, which are useful but limited. For deeper insight, you’ll often need to integrate with tools like Grafana, Prometheus, or InfluxDB to visualize latency, throughput, and error rates.
While JMeter reporting dashboards are simple and require additional plugins for deeper insight, BlazeMeter real-time analytics provide rich visualizations and detailed metrics instantly, helping teams track performance KPIs without extra configuration.
CI/CD & Automation
With JMeter, automation is possible through CLI execution and integration tools like Taurus, but it requires scripting and environment setup. It’s flexible, yet not plug-and-play.
BlazeMeter simplifies this with built-in CI/CD integrations (Jenkins, GitHub Actions, Azure DevOps) and APIs for triggering tests automatically during deployments.
Team Collaboration & Versioning
Collaboration in JMeter is mostly manual; teams share JMX files through version control (Git) or file sharing. This can lead to merge conflicts and inconsistencies.
BlazeMeter includes built-in collaboration tools: multiple users can work on shared projects, comment on test runs, manage access levels, and track changes centrally.
Pricing & Total Cost of Ownership (TCO)
JMeter itself is free, but teams pay indirectly through infrastructure costs, maintenance time, and engineering overhead for scaling, monitoring, and reporting.
BlazeMeter is commercial, offering both free and paid plans based on virtual user hours, test duration, and additional enterprise features like SSO and SLA dashboards.
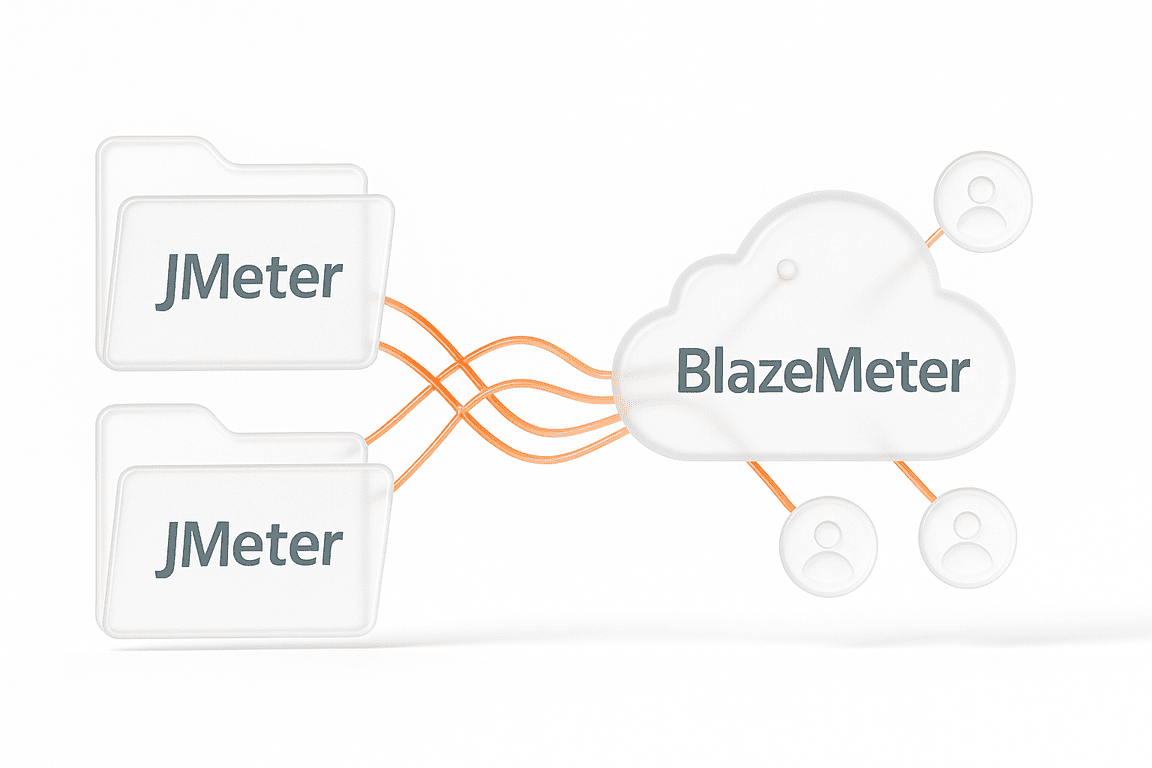
Compatibility & Portability (Run JMX in the Cloud)
A key advantage of BlazeMeter is its full compatibility with JMeter scripts. You can create and debug tests locally in JMeter, then upload your .jmx file to BlazeMeter and run it in the cloud; same logic, greater scale.
This streamlined process supports the JMeter upload JMX workflow, allowing teams to reuse their existing scripts seamlessly for cloud execution and continuous performance validation.
When to Choose JMeter, BlazeMeter, or Both
Choosing between JMeter and BlazeMeter often comes down to your team’s scale, collaboration needs, and available resources. If you prefer full control and have the technical capacity to manage infrastructure, JMeter offers unmatched flexibility and zero licensing costs. It’s an excellent option for smaller teams, early testing phases, or environments that prioritize custom scripting.
In contrast, BlazeMeter is designed for organizations that value speed, collaboration, and simplicity. It eliminates the complexity of distributed testing by automatically provisioning load generators in the cloud. Real-time dashboards and shared reports make it easier for developers, QA engineers, and managers to work together, without any manual setup.
For most mature teams, the ideal workflow blends both tools. You can create and fine-tune tests in JMeter, then run them in BlazeMeter when you need to scale or collaborate across regions. This hybrid model combines the best of open-source control with the power of managed cloud execution, ensuring flexibility, speed, and visibility at every stage of performance testing.
Final Thoughts
Both JMeter and BlazeMeter have proven themselves as powerful tools in the world of performance and load testing. The real JMeter and BlazeMeter difference between them lies in how teams prefer to work:
But the best choice isn’t always one or the other. Many high-performing QA and DevOps teams now blend both approaches, designing and debugging tests locally in JMeter, then scaling execution and reporting through BlazeMeter’s cloud.
At PFLB, we take this one step further. Our performance testing services and cloud platform let you upload your JMeter tests, run them at scale, and analyze results with AI-powered insights and transparent pricing. You get the openness of JMeter, the scalability of BlazeMeter, and expert support from engineers who specialize in optimizing performance for enterprise systems.
If your goal is to test smarter, not harder, explore how PFLB’s JMeter cloud brings all the flexibility, visibility, and reliability your team needs in one unified solution.