When performance engineers talk about endurance testing, they usually mean soak testing — a long-duration performance test that keeps the system under a steady, realistic workload for hours or even days. It’s designed to uncover what short stress or load tests can’t: slow memory leaks, growing queues, or throughput that quietly drops overnight. By tracking metrics like latency percentiles, error rates, and memory utilization over time, teams can see how software behaves under sustained pressure.
In this article, we’ll explain what endurance testing in software testing means, why it matters, how to design one effectively, and which tools — from JMeter and Locust to the PFLB platform — make running long-duration tests easier.
Key Takeaways
What Is Endurance Testing?
In simple terms, endurance testing is a long-running performance test that keeps the system under a consistent, expected workload to observe its stability over time. While load testing measures how software handles traffic peaks, and stress testing pushes it to failure, endurance testing looks for what happens in between: subtle degradations that accumulate gradually.
During an endurance run, teams monitor how performance metrics drift over hours of execution. Typical findings include:
Endurance testing is also known as soak performance testing.
When to run endurance tests:
Software endurance testing helps ensure a service remains stable, predictable, and cost-efficient for the long haul — especially when uptime directly affects revenue or user trust.
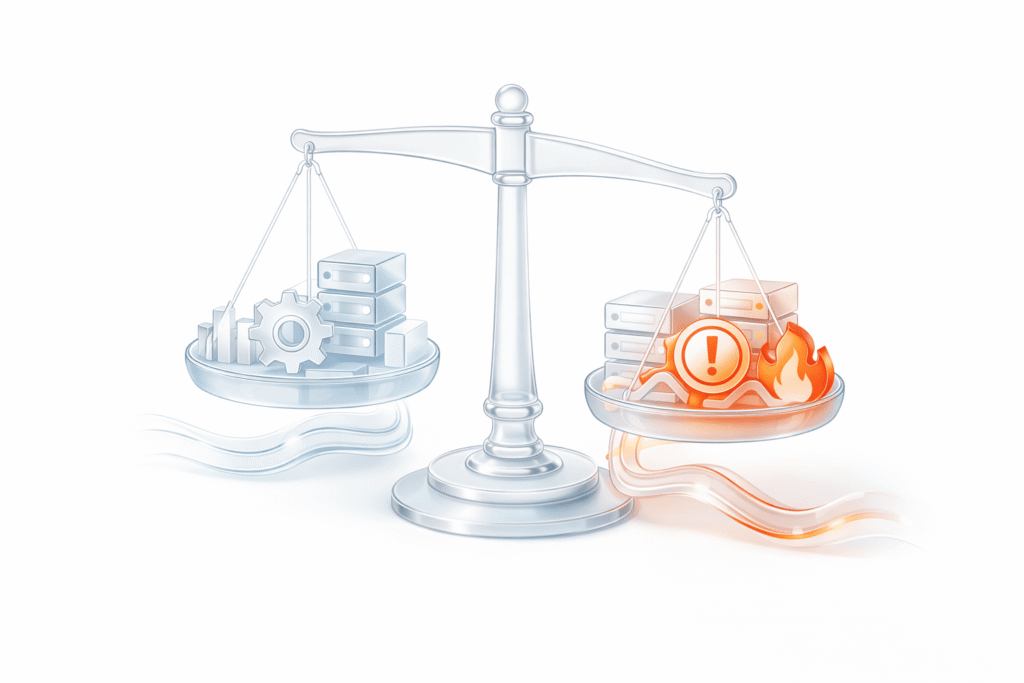
Why Endurance Testing Matters (Business & Engineering)
Endurance testing isn’t just about proving that an application can survive overnight. It’s about verifying that it can run efficiently, predictably, and economically over time — both from a business and engineering perspective.
From the business side:
Downtime or slow degradation after long hours of operation translates directly into lost conversions, lower customer satisfaction, and SLA violations. Even small leaks in performance can scale into real financial losses during peak hours. Running endurance tests ensures that the application can handle continuous usage without performance drift — a critical advantage for e-commerce, fintech, and SaaS platforms operating 24/7.
From the engineering side:
Long-duration tests reveal the health of memory management, connection pooling, caching, and background processes. Engineers use them to fine-tune garbage collection parameters, database connection lifecycles, and autoscaling thresholds. For example, a payments API that starts returning 504 errors after 10 hours may expose unclosed sessions or stale cache entries — issues that standard load testing would miss.
Best practice: schedule endurance tests as part of your pre-release validation pipeline, not as a one-off exercise.
Pitfall: treating soak testing as optional because short-term metrics “look fine.” Many performance regressions surface only after 6–12 hours of sustained traffic.
Endurance vs. Load vs. Stress: Quick Comparison
Endurance testing, load testing, and stress testing are closely related — but each reveals a different aspect of system performance. The difference isn’t in tooling, but in what parameter you change and what you measure over time.
Load Testing
Load testing measures how a system performs under a specific, expected volume of traffic. It’s the baseline of performance engineering — used to confirm throughput, latency, and error rate under predictable concurrency.
Stress Testing
Stress testing deliberately pushes a system beyond its stable operating range to find the breaking point.
Endurance (Soak) Testing
Endurance testing—also called soak testing—uses the same workload models as load testing but extends the duration for hours or days.
It targets temporal degradation: slow memory leaks, unreleased connections, or latency drift caused by cumulative resource strain.
Summary Table
| Test Type | Focus | What Changes | What You Learn | Typical Duration |
| Load | Stable throughput under normal conditions | Request rate/concurrency | Efficiency and scalability | 1–2 hours |
| Stress | System resilience under overload | Load magnitude | Failure thresholds and recovery limits | Short bursts |
| Endurance (Soak) | Stability over time at constant load | Time | Memory leaks, drift, resource exhaustion | 6–48 hours+ |
In essence:
Together, they form a complete view of system reliability under both immediate and long-term demand.
Types of Endurance Tests (Patterns You Can Use)
There isn’t a single recipe for endurance testing.
Different systems degrade in different ways, so engineers use several test patterns to expose specific failure modes.
Below are the most common approaches and what each helps you uncover.
Steady-State Endurance
The classic form of endurance testing.
A constant workload is applied for many hours — often 12 to 48 — at a safe utilization level (well below saturation).
The purpose is to confirm that resource usage stabilizes and doesn’t slowly drift.
Typical observations include:
Best practice:
Ensure your monitoring captures trends, not snapshots. Use moving averages or regression slopes to identify drift.
Pitfall:
Running the test too briefly — leaks and gradual degradation often appear only after several hours.
Cyclic Endurance
Some systems behave differently under fluctuating demand — morning peaks, nightly batch jobs, weekly cache invalidation.
A cyclic endurance test reproduces those real-world traffic waves to study how the system recovers between load cycles.
What to look for:
Best practice:
Match cycle length to real production patterns (e.g., 24-hour or 7-day).
HA / Failover Endurance
Distributed systems rarely stay static — nodes restart, connections reset, clusters rebalance.
HA endurance testing introduces controlled disruptions (rolling restarts, instance failovers) during a long run to confirm recovery stability.
What it reveals:
Best practice:
Run for multiple recovery iterations to see if recovery time increases over time — a subtle but critical signal of compounding resource exhaustion.
Data-Growth Endurance
Even with constant traffic, systems that store data continuously evolve.
A data-growth endurance test examines how performance changes as indexes, logs, or message queues expand.
Symptoms to monitor:
Best practice:
Track both performance and data volume together — degradation often scales with dataset size, not with active user count.
| Pattern | Purpose | Typical Signals | Common Risk |
| Steady-State | Verify stability at constant load | Memory or latency drift | Leaks and slow degradation |
| Cyclic | Test recovery across traffic waves | Autoscaling or cache churn | Oscillation and lag |
| HA/Failover | Confirm resilience under disruption | Longer recovery or reconnect leaks | Session/state inconsistency |
| Data-Growth | Measure performance as data accumulates | Slower queries, GC pressure | Storage and index bloat |
Each of these patterns targets a different long-term failure mode. Combining them provides a full picture of system behavior across the long-duration performance testing spectrum.
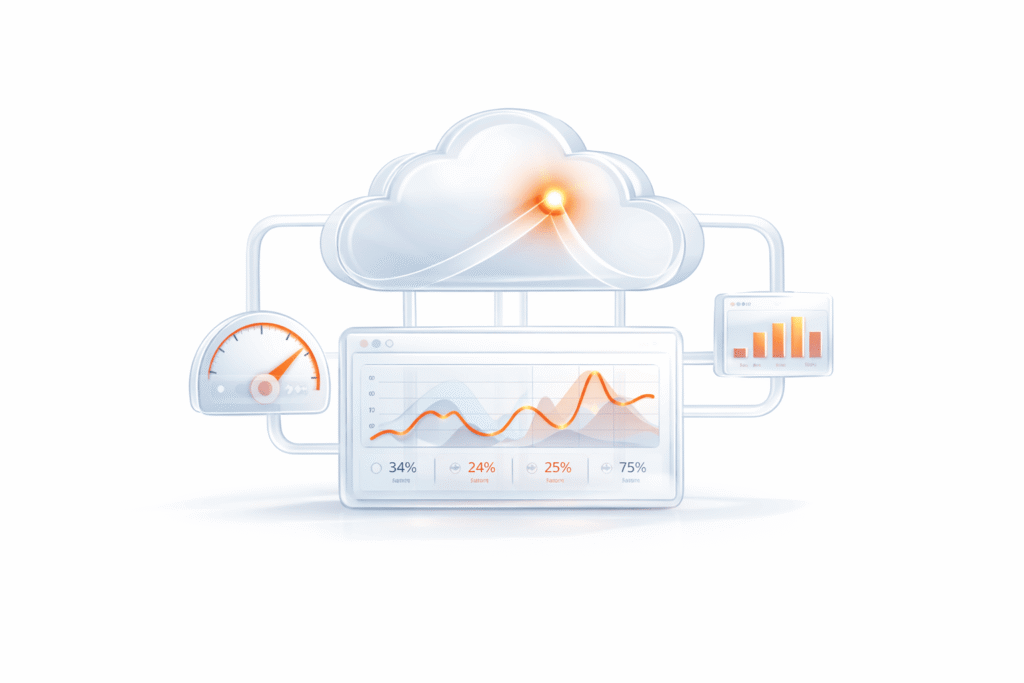
What to Measure During Endurance Tests
Endurance testing is only as valuable as the data you collect.
The goal isn’t to generate traffic — it’s to observe how system metrics evolve under continuous load.
A successful test combines application-level KPIs with low-level infrastructure telemetry to reveal trends that short tests miss.
Application Metrics
These define whether user-facing performance remains stable throughout the run.
Key parameters include:
Best practice:
Don’t rely on single-point averages — analyze latency distributions and their drift across time windows.
Infrastructure Metrics
Endurance testing also validates that hardware and OS resources reach equilibrium.
Engineers typically monitor:
Pitfall:
Using dashboards configured for 1-hour data retention — long tests need time-series storage that preserves full duration granularity.
Drift Indicators
Endurance tests don’t usually fail by crashing — they fail slowly.
That’s why engineers track trends rather than discrete thresholds.
Common drift signals include:
Best practice:
Define pass/fail criteria based on stability, for example:
A mature approach sets SLAs per window (e.g., first 4 h, last 4 h) and analyzes the delta, not just the overall mean.
That’s the only way to confirm that the system stays stable from start to finish — the fundamental goal of any endurance testing software.
How to Design an Endurance Test (Step by Step)
Model Realistic Traffic
Choose an open-workload (arrival-rate-driven) or closed-workload (fixed-concurrency) model that reflects how users actually arrive and interact, including think times, session lengths, cache behaviors, and background tasks.
Example:
For a REST/gRPC API, use an open model (arrival rate) for external client calls and a closed model (fixed users) for long-lived admin sessions. Include login flows that refresh tokens periodically and back-office jobs that run on the hour.
Best practices:
Pitfall:
Copying a spike profile from a load test. Endurance needs stationarity in inputs; otherwise you can’t attribute drift to the system.
Choose a Load Profile
Define the envelope the system will live in for hours: a warm-up ramp, a steady hold, and a graceful ramp-down. The hold sits safely below saturation (you’re testing time, not limits).
Example:
Ramp from idle to the target arrival rate over multiple GC cycles, hold stable for the majority of the run, then ramp down to observe reclamation (connections/heap returning to baseline).
Best practices:
Pitfall:
Flat-lining on “constant throughput” without guardrails. Add abort conditions (e.g., sustained error% spike) to stop burning hours on a clearly failing run.
Seed Realistic Data
Test data must resemble production in volume, cardinality, and freshness, or your caches, indexes, and pools will behave unrealistically.
Example:
Rotate through thousands of user accounts, SKUs, and tenancy IDs so every cache level (service, CDN, DB) exhibits realistic hit/miss patterns. Keep token stores and carts/orders lifecycles active.
Best practices:
Pitfall:
Running with a tiny dataset → everything stays in cache, DB indexes never get stressed, and you “pass” while production leaks.
Monitoring & Logs
Collect time-series telemetry that can reveal slopes (derivatives) and convergence: app KPIs + runtime/OS/DB internals. Long tests need storage and retention settings aligned to duration.
Example:
App metrics (RPS, latency p50/p95/p99, errors/timeouts), runtime (GC pauses, heap occupancy), infra (CPU steal, RSS, FD count, sockets), DB (pool size, slow queries), queues (depth, age). Tracing for critical flows.
Best practices:
Pitfall:
Dashboards that show means over the full run. Endurance requires windowed views (e.g., first vs last 4h), side-by-side.
Duration & Cadence
Pick a duration that covers at least two iterations of your longest internal cycle (GC, compaction, retention, batch jobs) and schedule runs often enough to detect regression trends.
Example:
If backups run nightly and batch analytics start at 02:00, your soak must cross those boundaries and include time after them to check for baseline recovery.
Best practices:
Pitfall:
12h by habit. If GC/compaction/batches cycle every 8–10h, 12h might miss the second iteration where degradation actually appears.
Analyze & Compare
Endurance analysis is comparative: you compare windows within the run (early vs late) and runs across builds/infra to spot drift and regression.
Example:
Compute memory slope (Δheap/hour), FD slope, and p95 delta between first and last windows; cross-reference with DB connection pool utilization and queue age. Confirm recovery after ramp-down.
Best practices:
Pitfall:
Celebrating “overall average OK.” Endurance is passed when the end state equals the steady start state (within tolerance) — not when an average across 24h hides a rising tail.
Final Thoughts
Endurance testing isn’t a separate discipline — it’s another validation tool in the performance toolkit.
Load and stress tests show how a system reacts to pressure; endurance testing shows how it behaves when the pressure never stops.
Run it to confirm that your platform isn’t just fast at launch but remains predictable, stable, and cost-efficient over time — exactly what production reliability depends on.