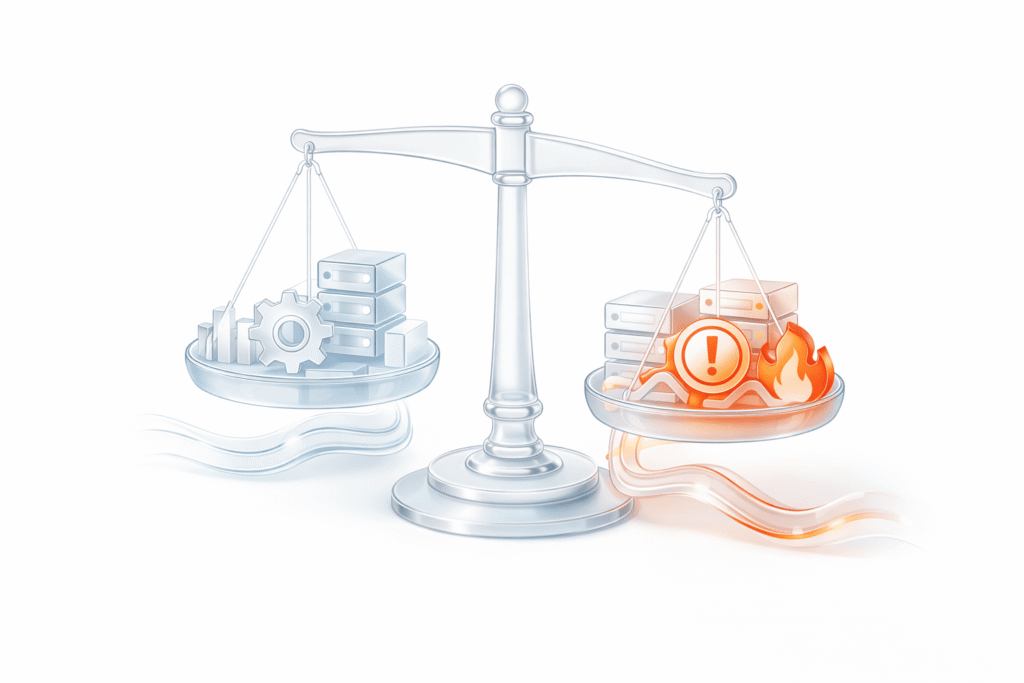
Say goodbye to tedious manual reporting after load testing! With PFLB’s innovative AI-powered report generation, performance engineers can quickly turn detailed test data into comprehensive reports. This guide walks you step-by-step through setting up your test, running it, and effortlessly generating exhaustive performance analysis — so you spend less time reporting and more time optimizing.
Let’s dive in!

Generating AI Reports with PFLB Step-by-Step
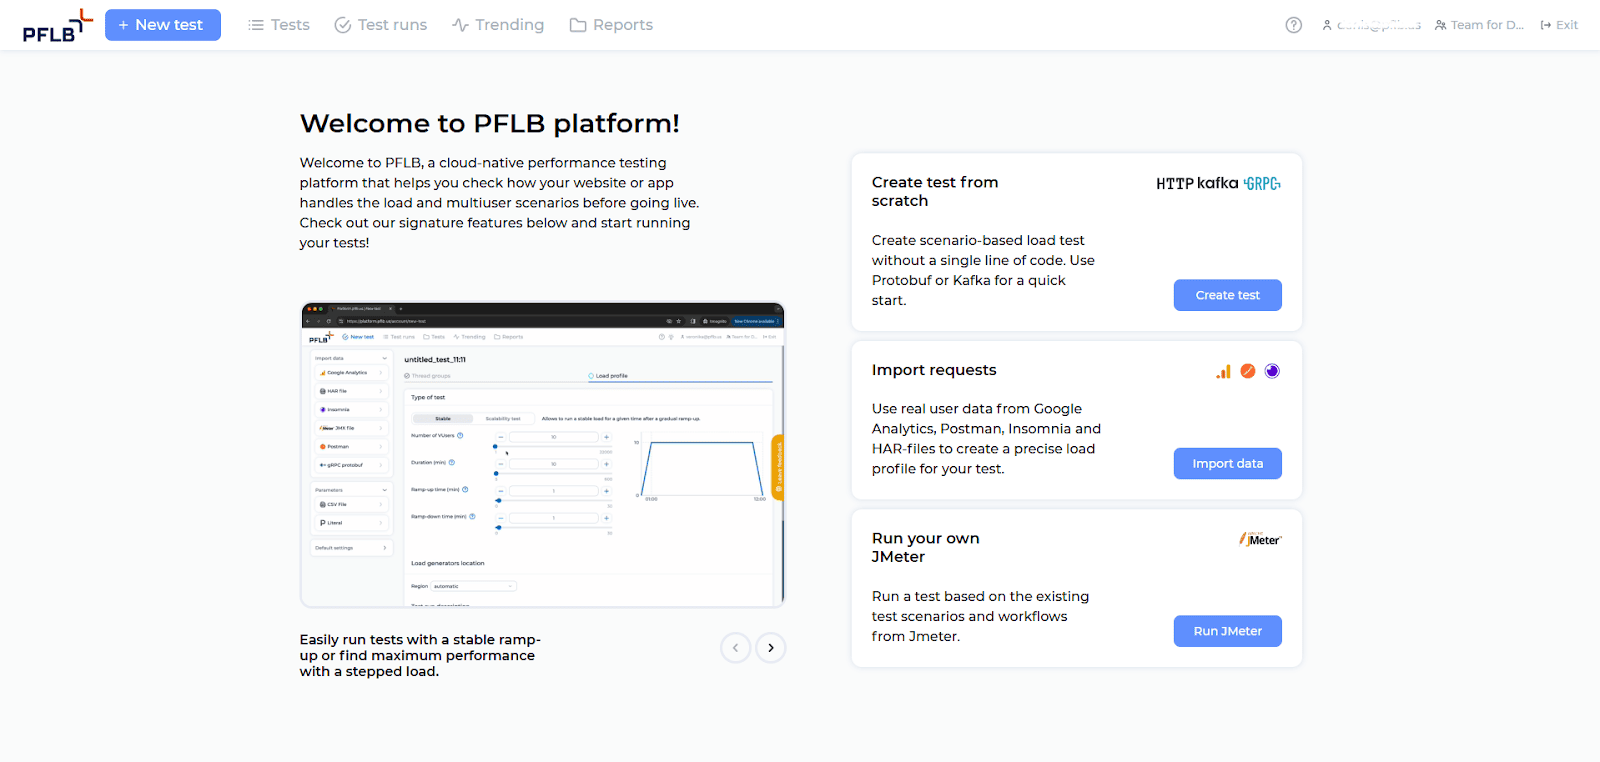
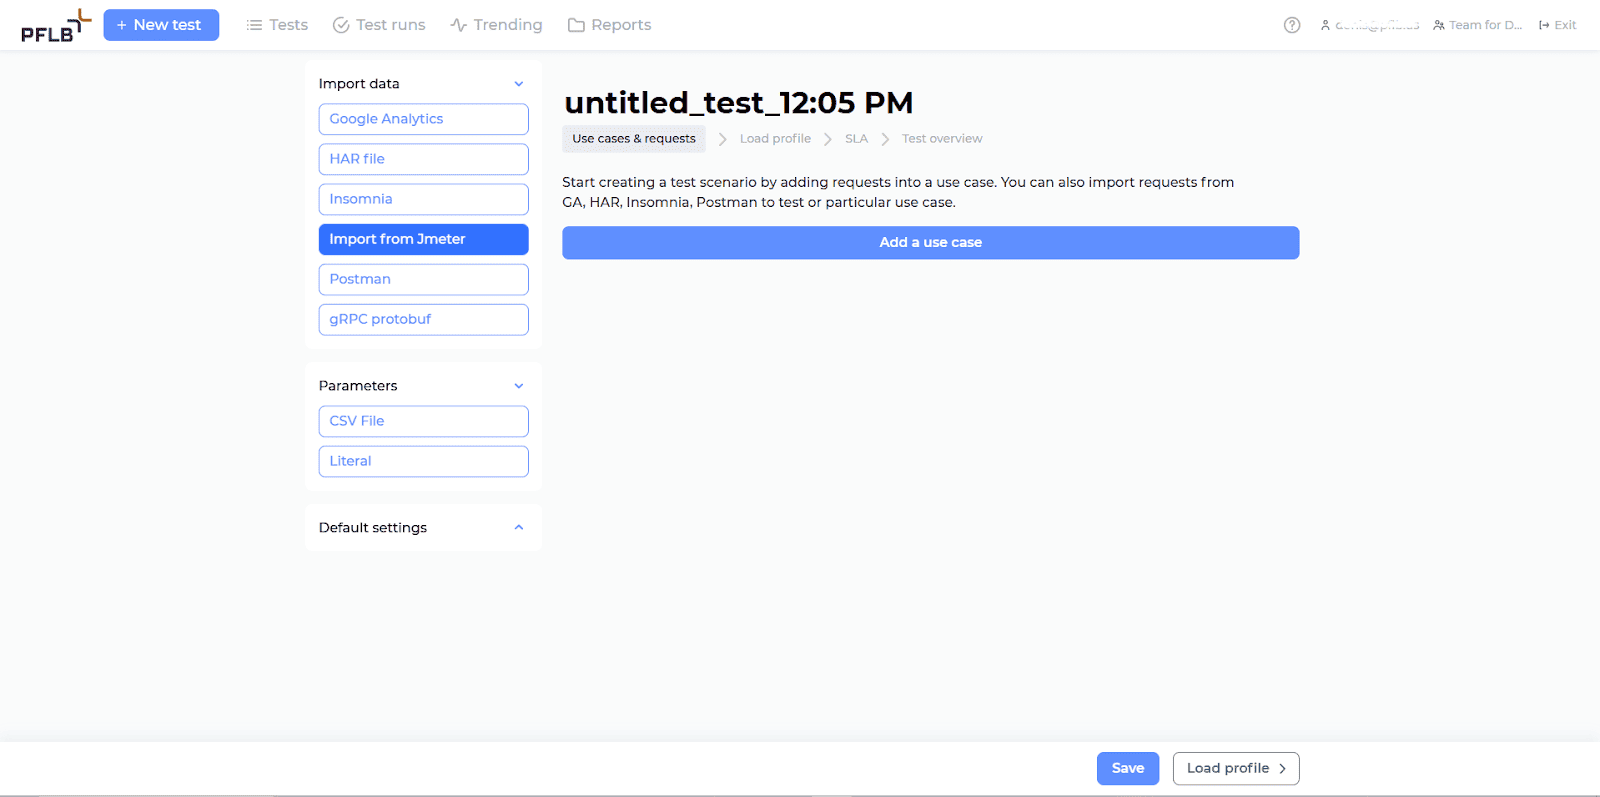
Step 1: Create a New Test
After logging into the PFLB platform, click “+ New test” in the top-left corner of your screen to start setting up your load test.
Step 2: Import Your JMeter Test Files
After creating a new test, select “Import from Jmeter” from the Import data menu on the left-hand side.
A pop-up window appears, where you should:
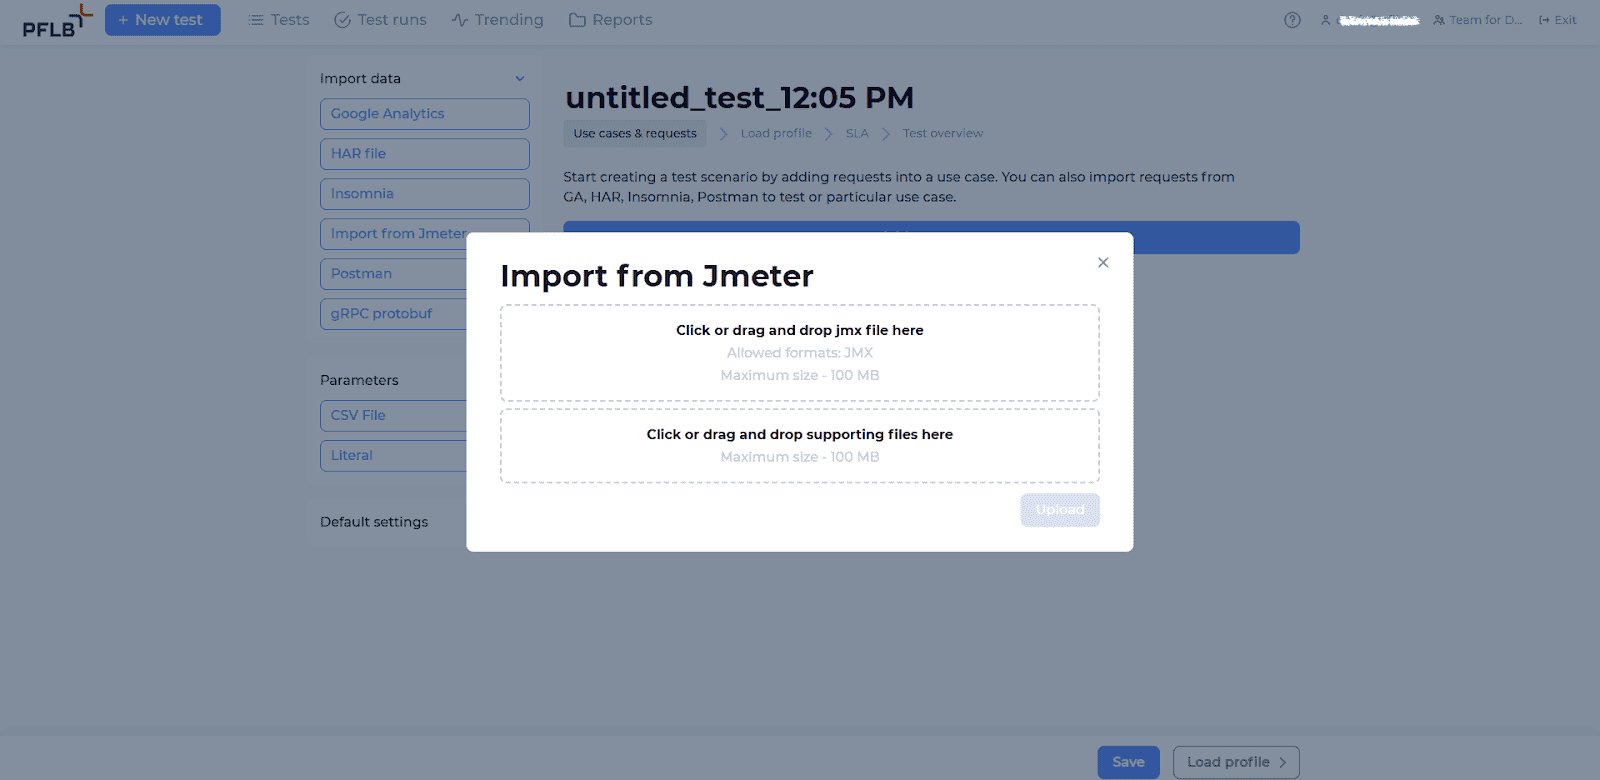
Your test scenarios from JMeter will now be ready to use in PFLB.
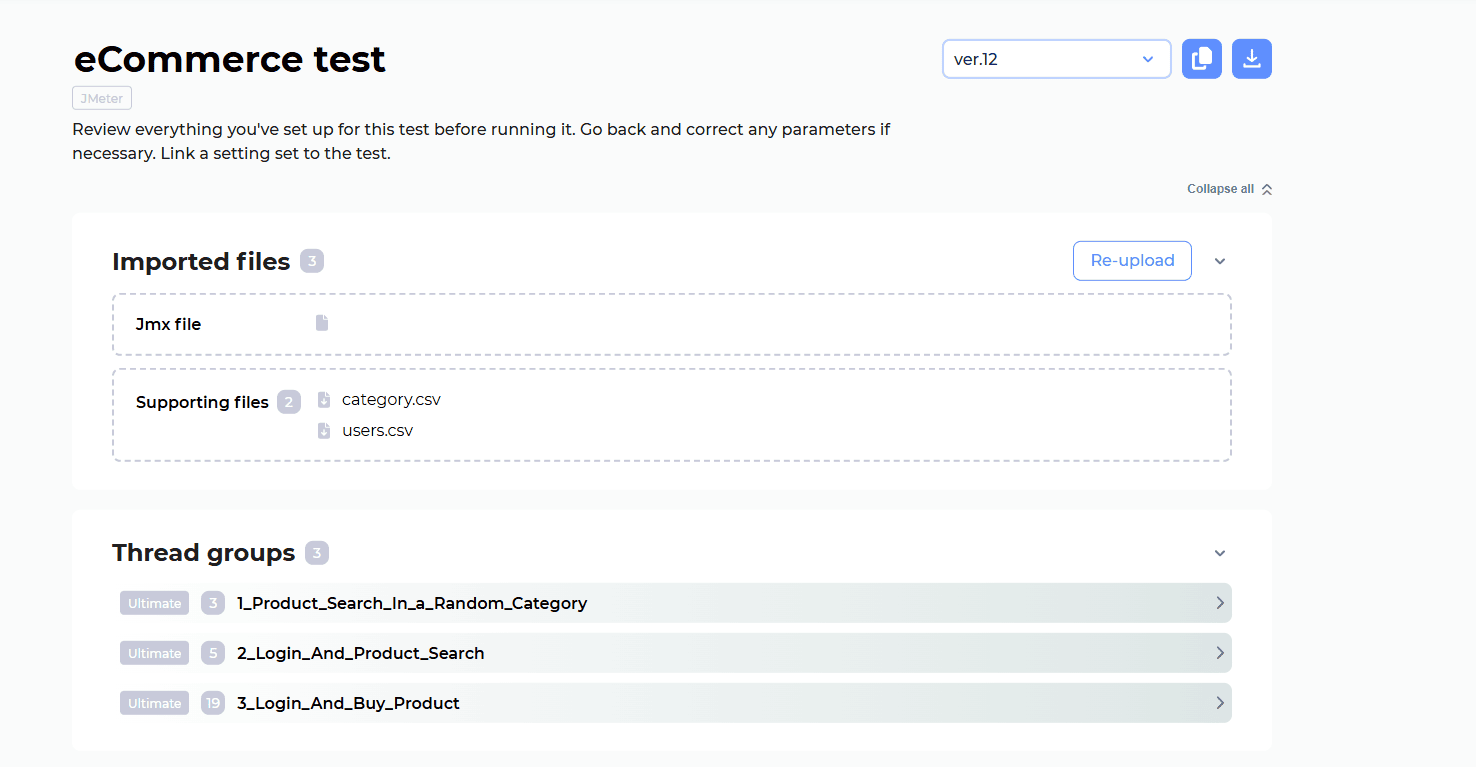
Step 3: Verify and Finalize Your Test Setup
Before running your test, you’ll need to confirm and fine-tune your configuration:
Confirm Thread Groups:
Ensure your imported thread groups from JMeter correctly represent your test scenarios.
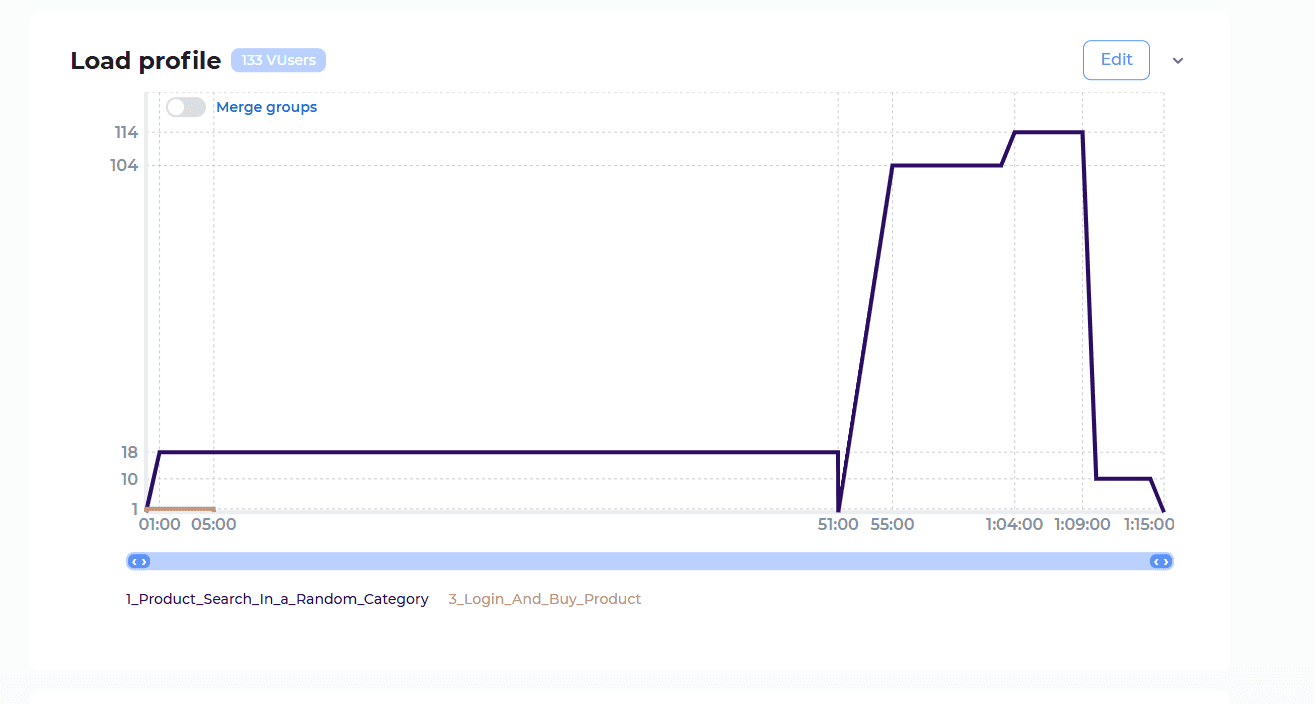
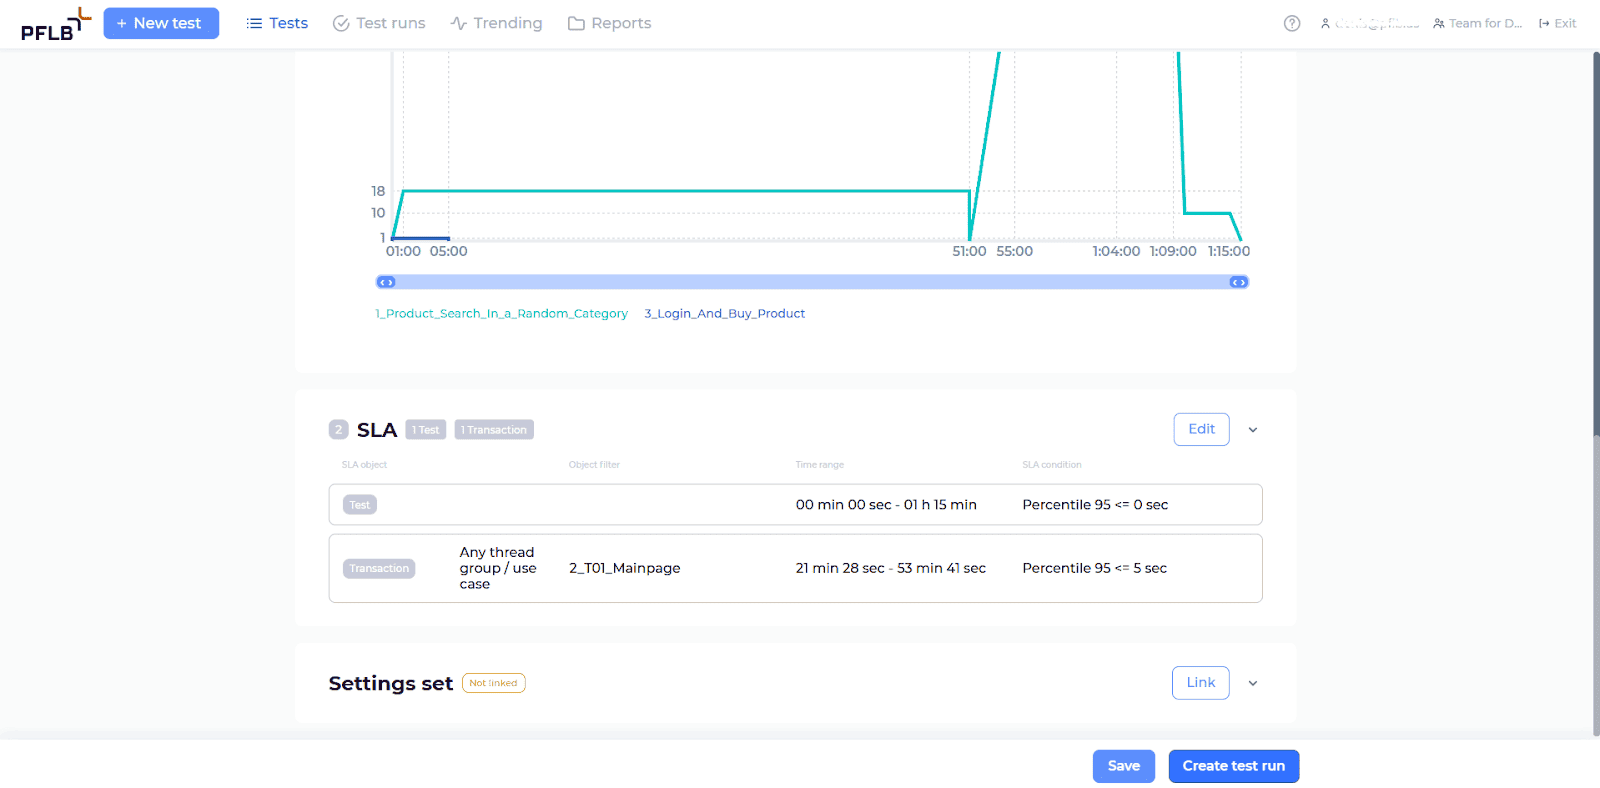
Verify Load Profile:
Review your load profile visually to ensure it accurately reflects the intended load scenarios.
Add SLA and Settings (Optional):
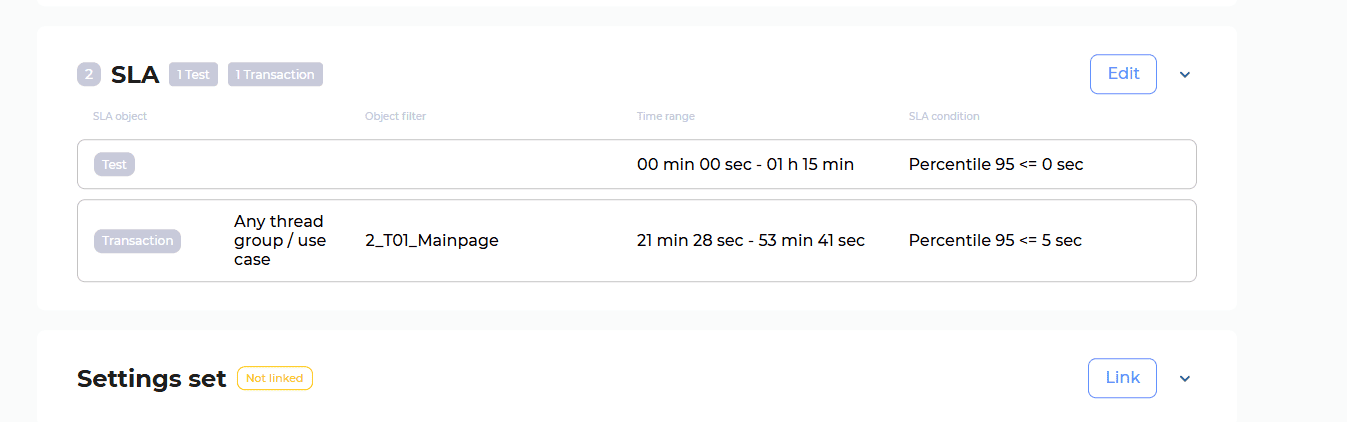
Once satisfied, you’re ready to run your performance test in PFLB.
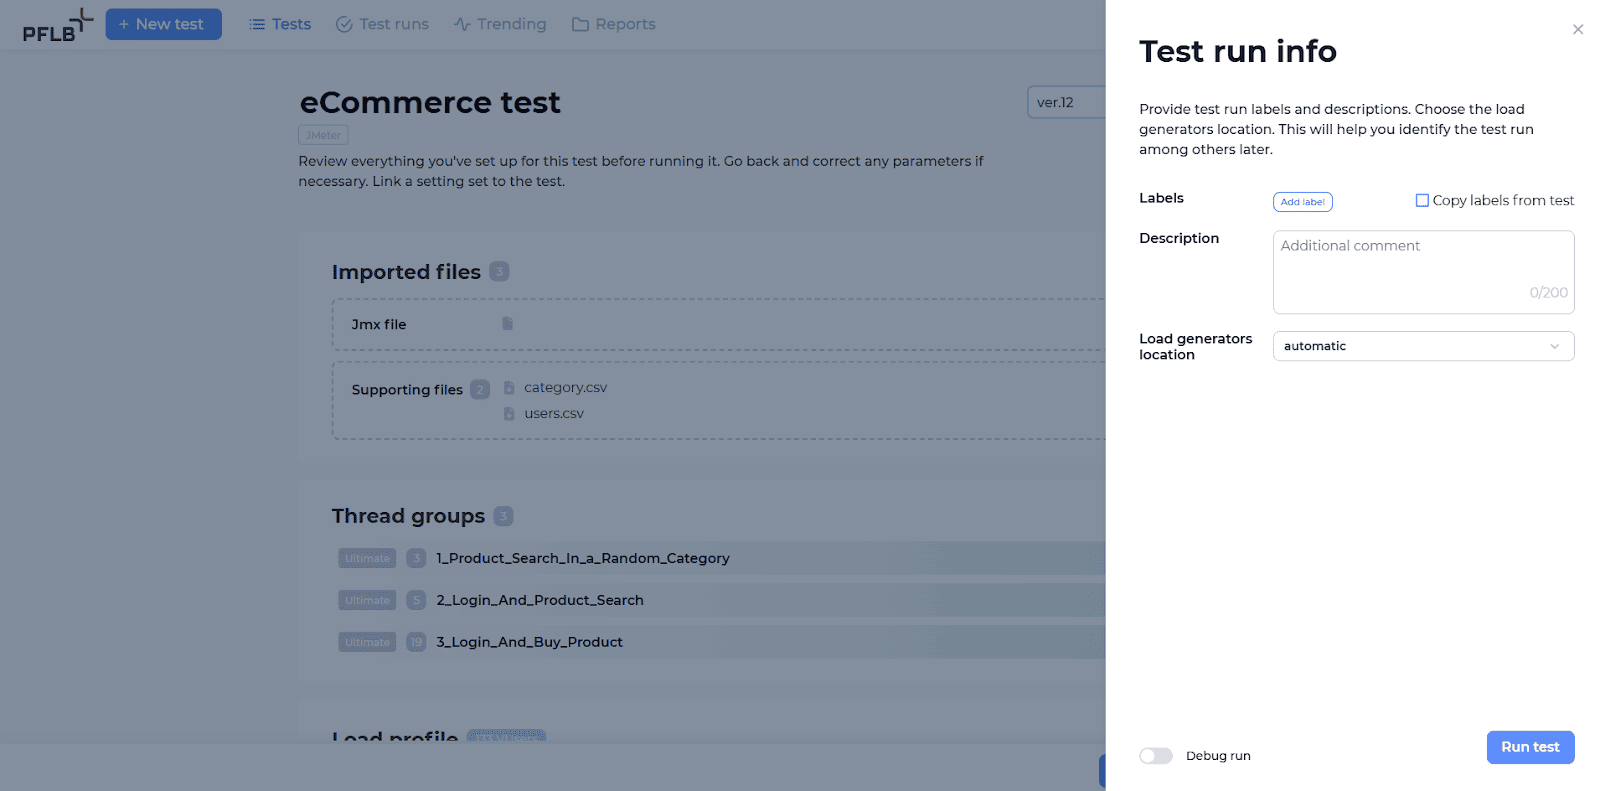
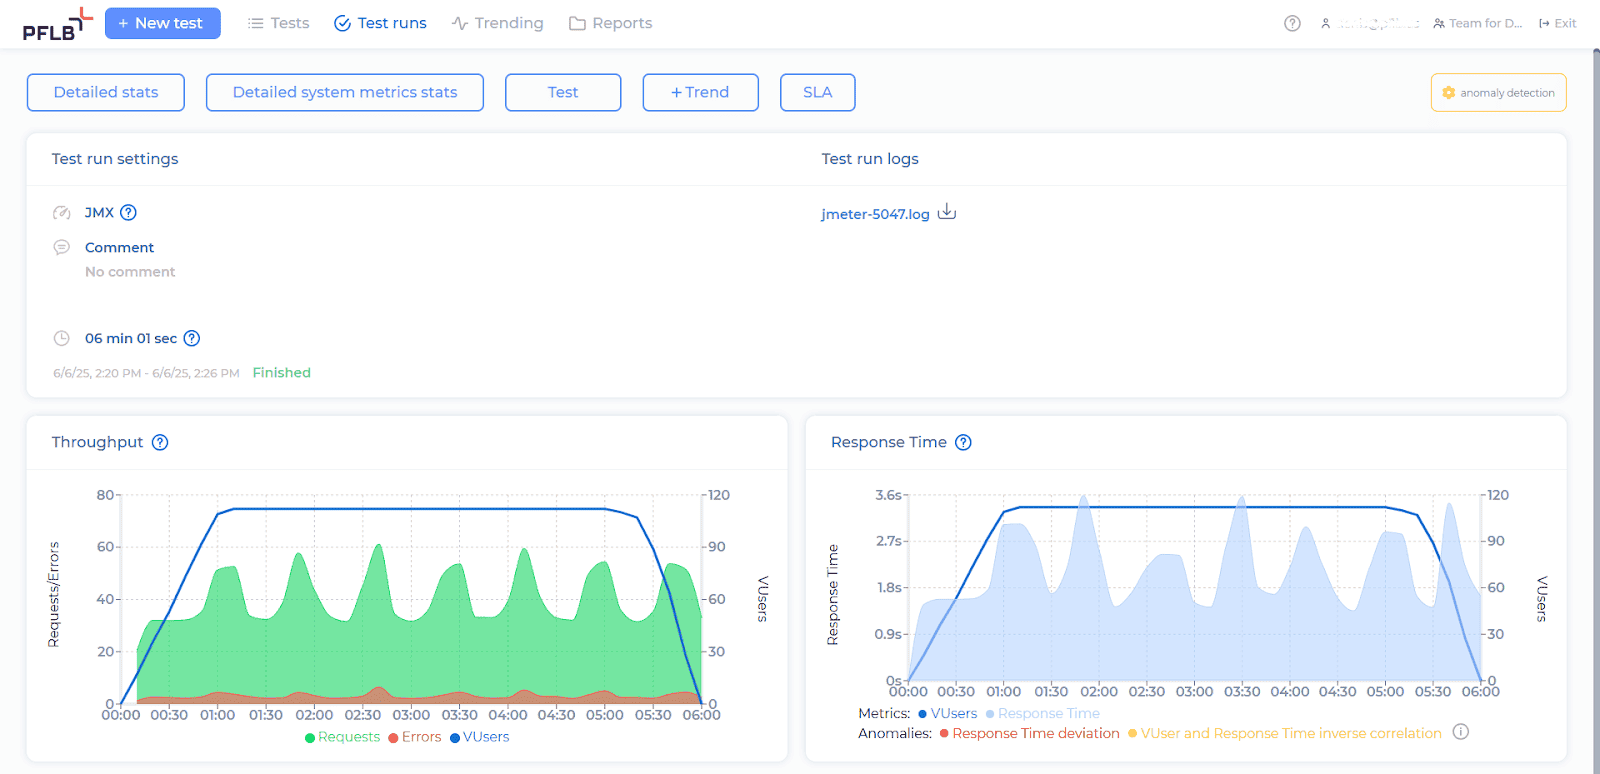
Step 4: Launch and Monitor Your Test
Click on “Create test run” at the bottom-right of the test setup page.
In the pop-up, you can optionally:
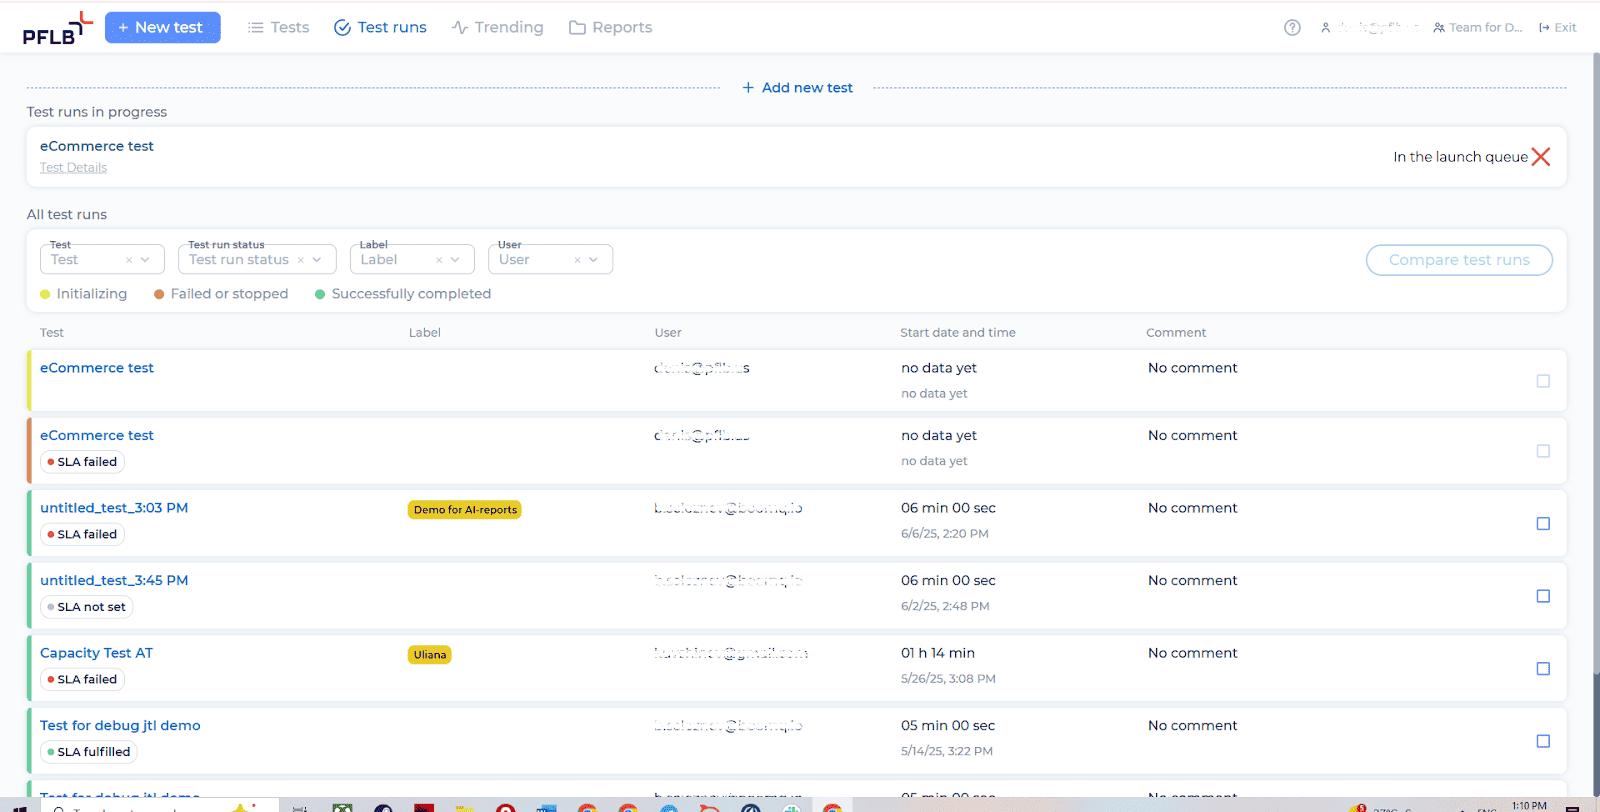
You can then track the test’s status and progress in real-time from the Test runs page.
Step 5: Generate and Access Your AI Report
Once your test run is completed, follow these steps to generate your AI-powered report:
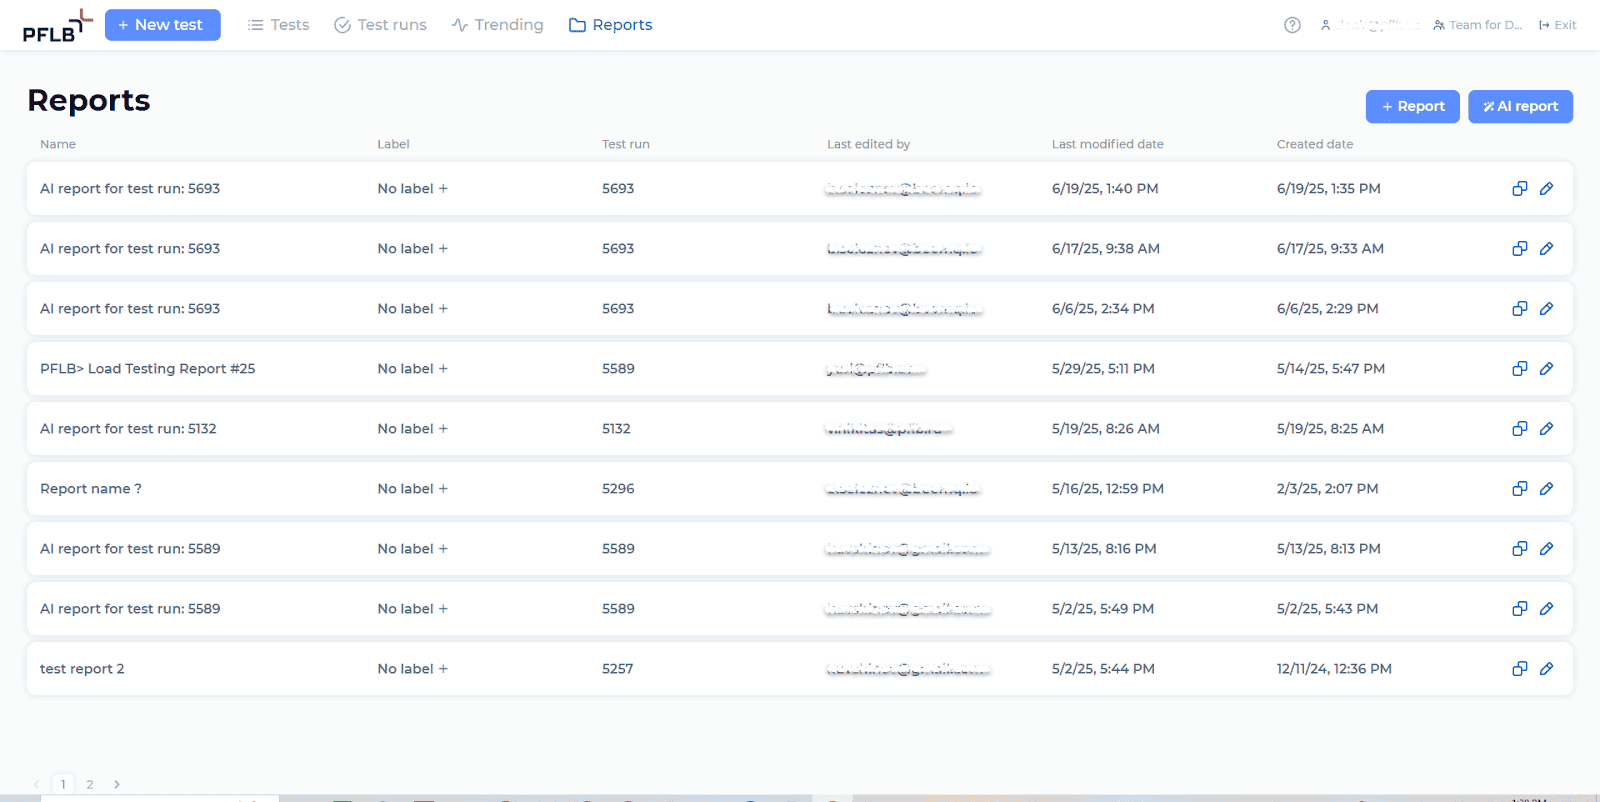
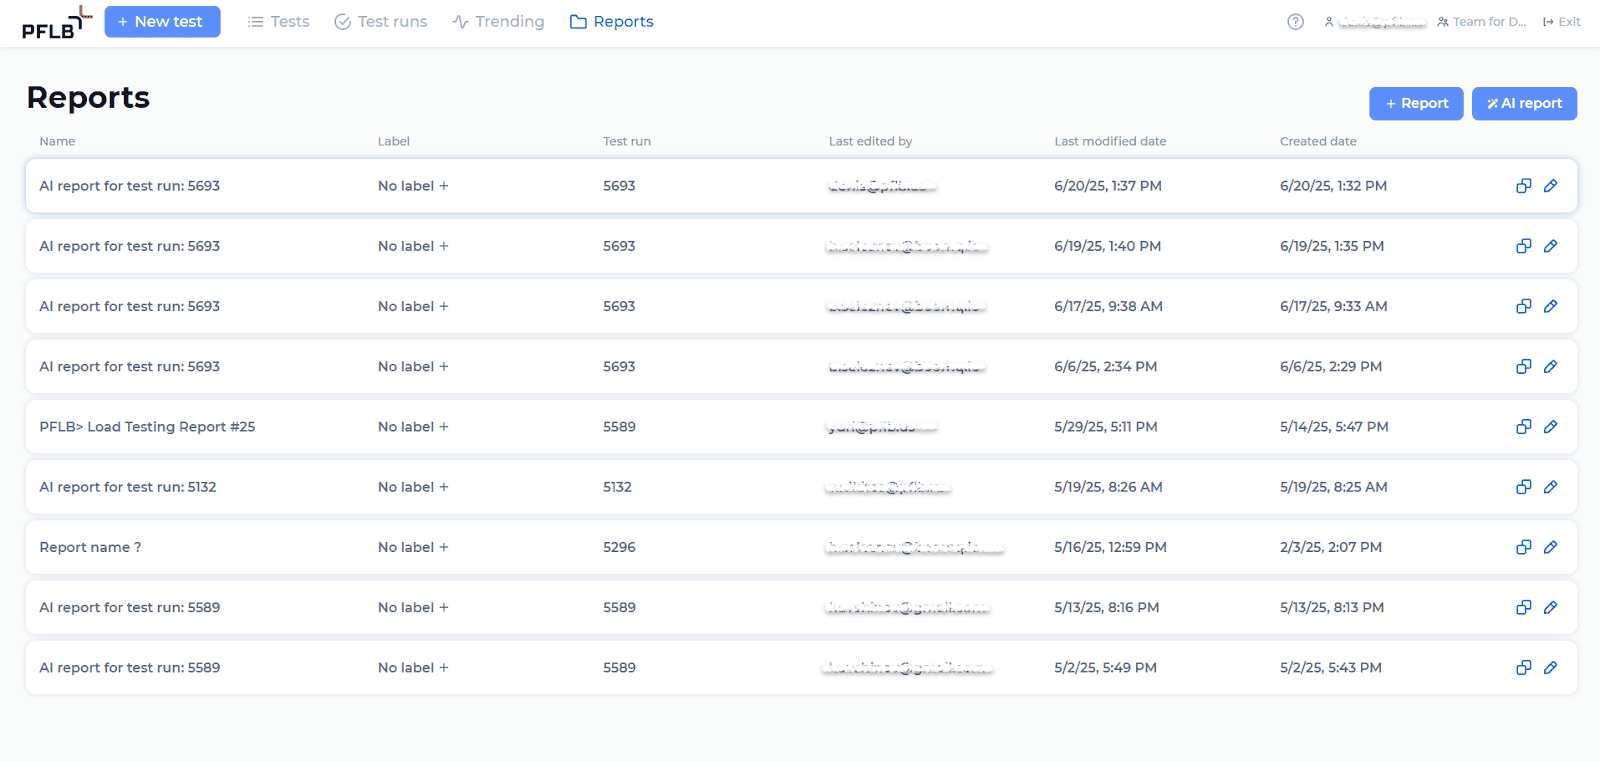
Click on the “Reports” tab at the top of your screen.
On the Reports page, click the “AI report” button.
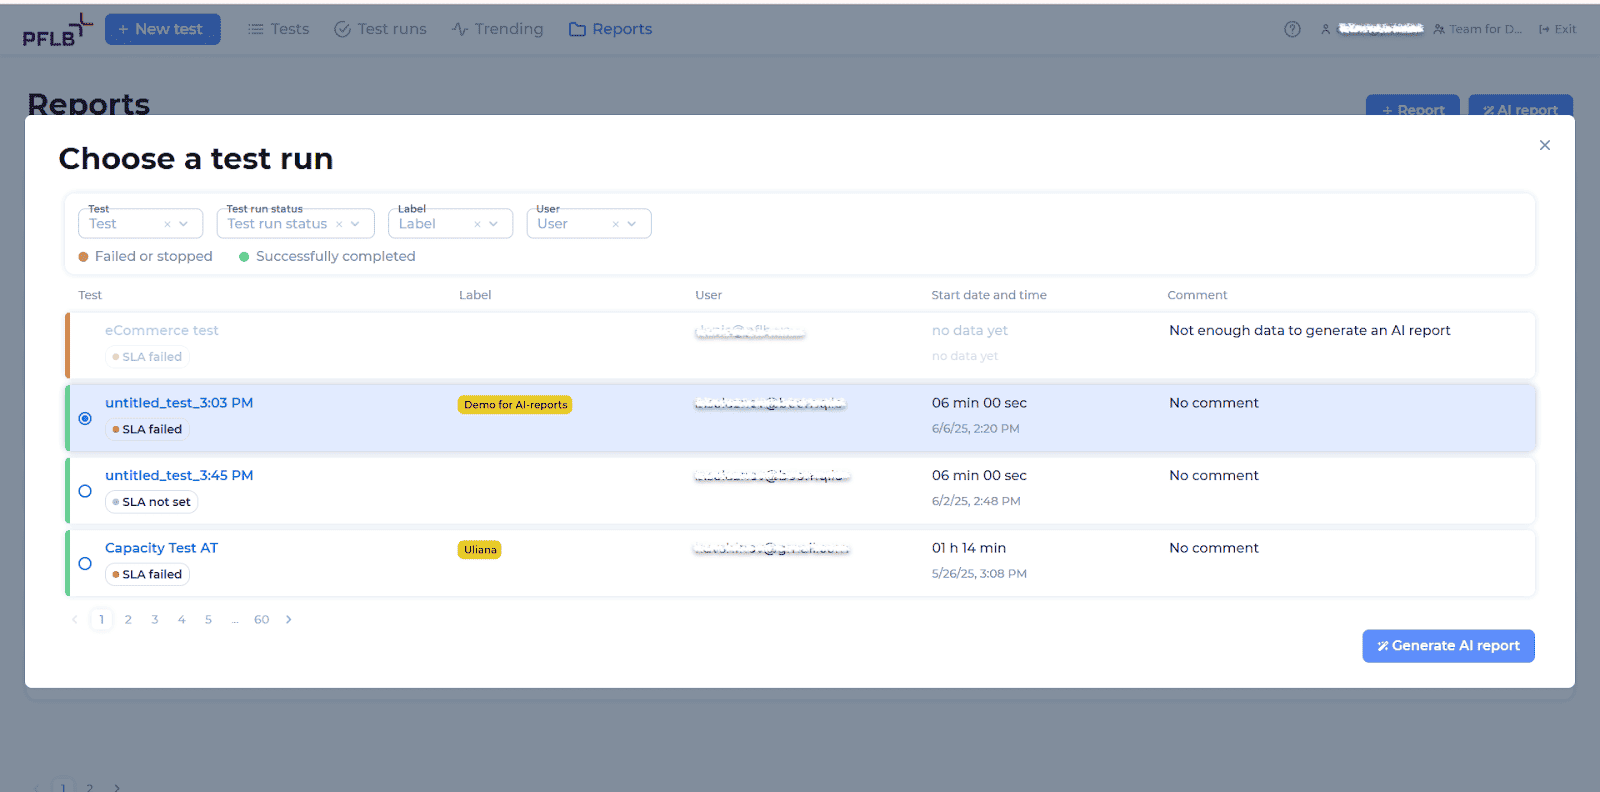
From the pop-up window, select the completed test run you want a report for, then click on “Generate AI report”.
The platform will begin analyzing your test data automatically. This process may take a few minutes, during which you’ll see the status as “Might take a few minutes”.
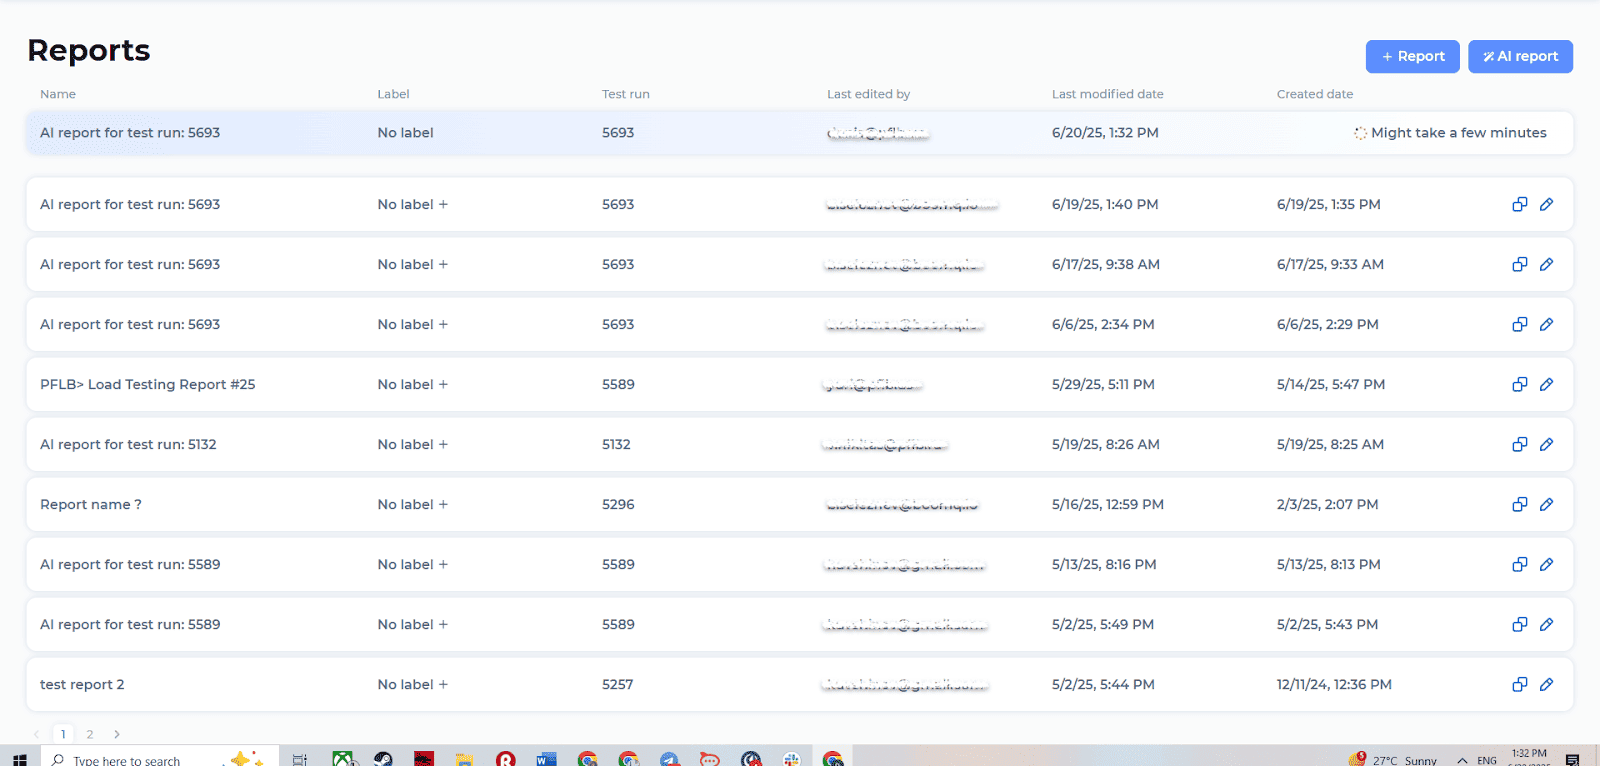
Once your report is ready, you’ll receive a notification.Return to the “Reports” tab and find your newly created AI report in the list.
Click and open it.
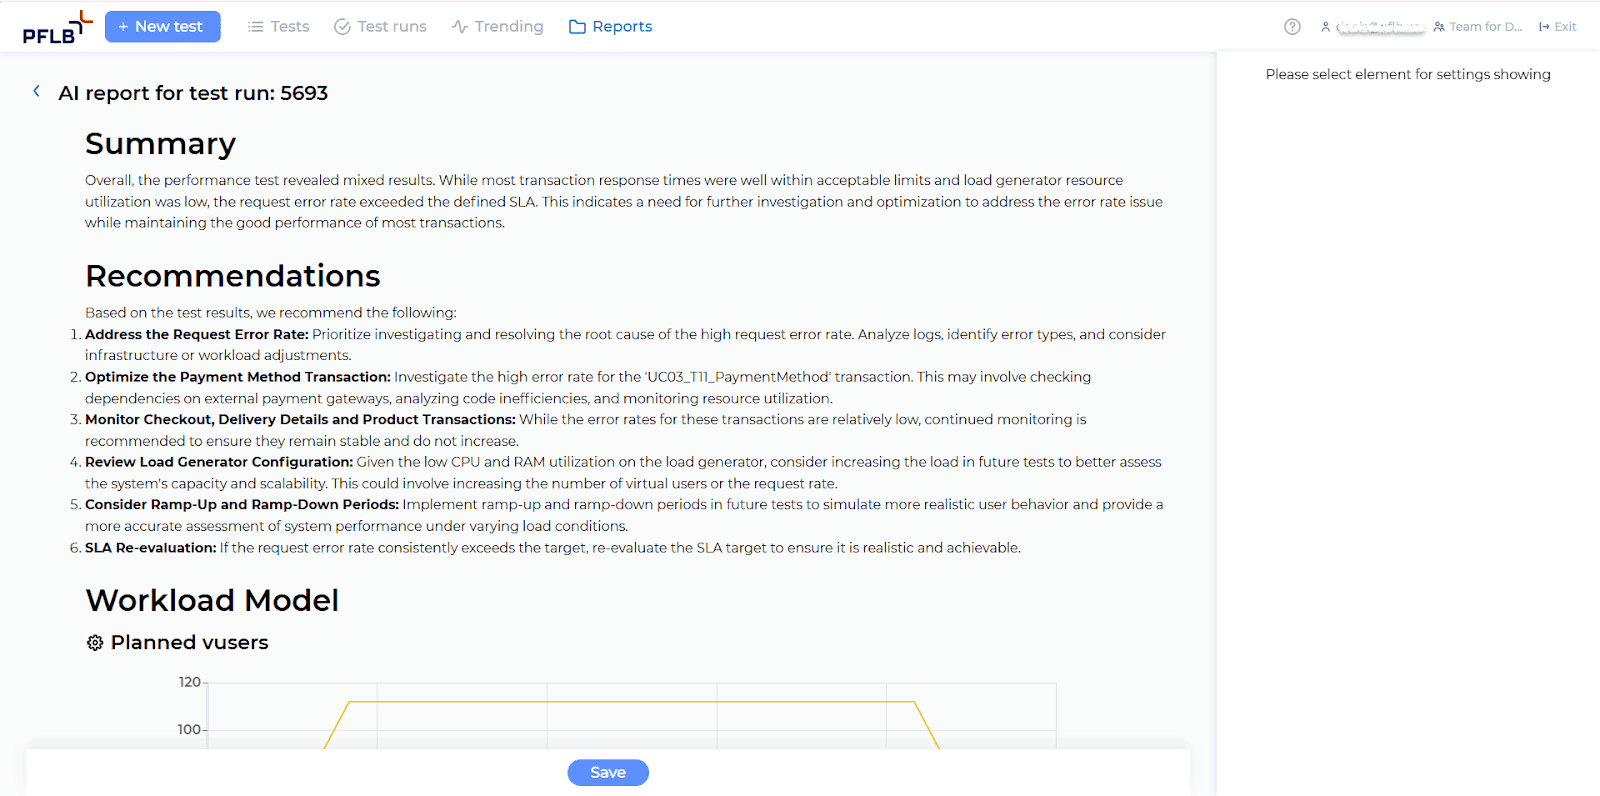
Your AI-generated performance analysis, complete with insights and recommendations, is now ready to review and share with your team. Read more about AI in Load Testing.