APIs drive today’s applications, connecting services and delivering the responses users expect instantly. To make sure they run smoothly under real-world conditions, teams turn to performance testing. JMeter API testing is a proven approach that allows QA engineers to simulate traffic, measure response times, and identify bottlenecks early.
This guide explains the essentials of API testing using JMeter: why JMeter is a trusted tool, how to set it up, build your first test plan, configure tests for accurate results, and analyze performance metrics. You’ll also find expert tips and learn how PFLB applies JMeter in large-scale projects to deliver reliable, high-performing systems.
Why Choose JMeter for API Performance Testing?
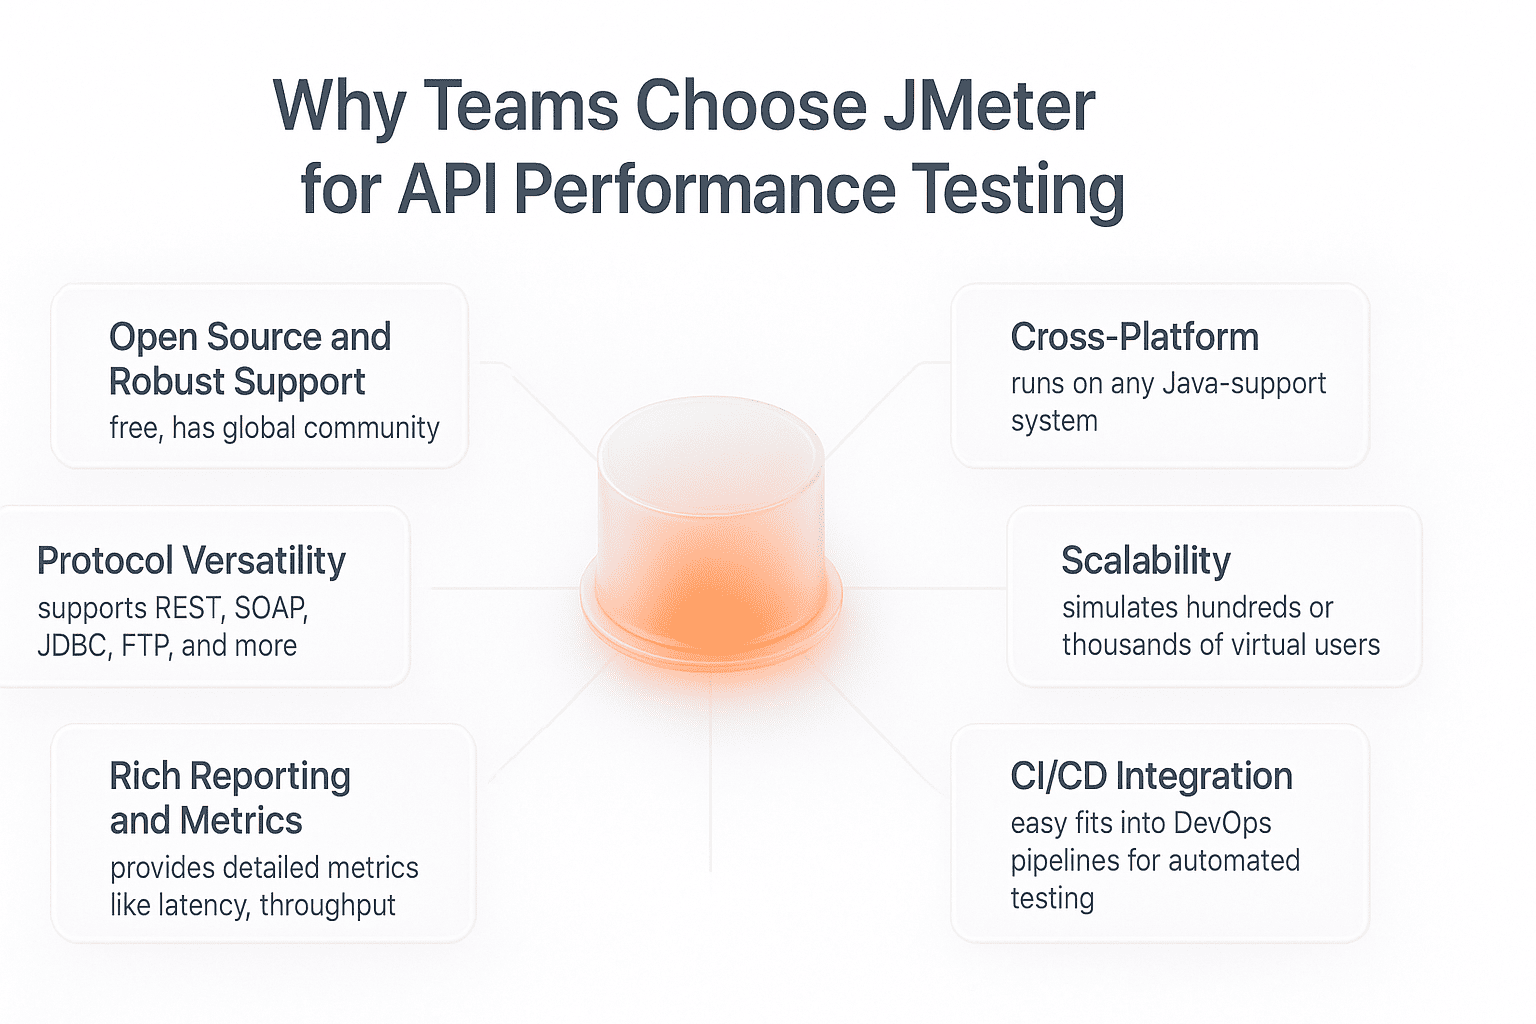
When it comes to evaluating how APIs behave under load, JMeter stands out as one of the most reliable and accessible tools available. It combines flexibility, scalability, and a strong open-source community, making it a go-to choice for developers and testers alike.
Key features that make JMeter suitable for API performance testing:
For teams needing to validate API reliability, JMeter for API testing offers a combination of speed, accuracy, and scalability that few tools can match.
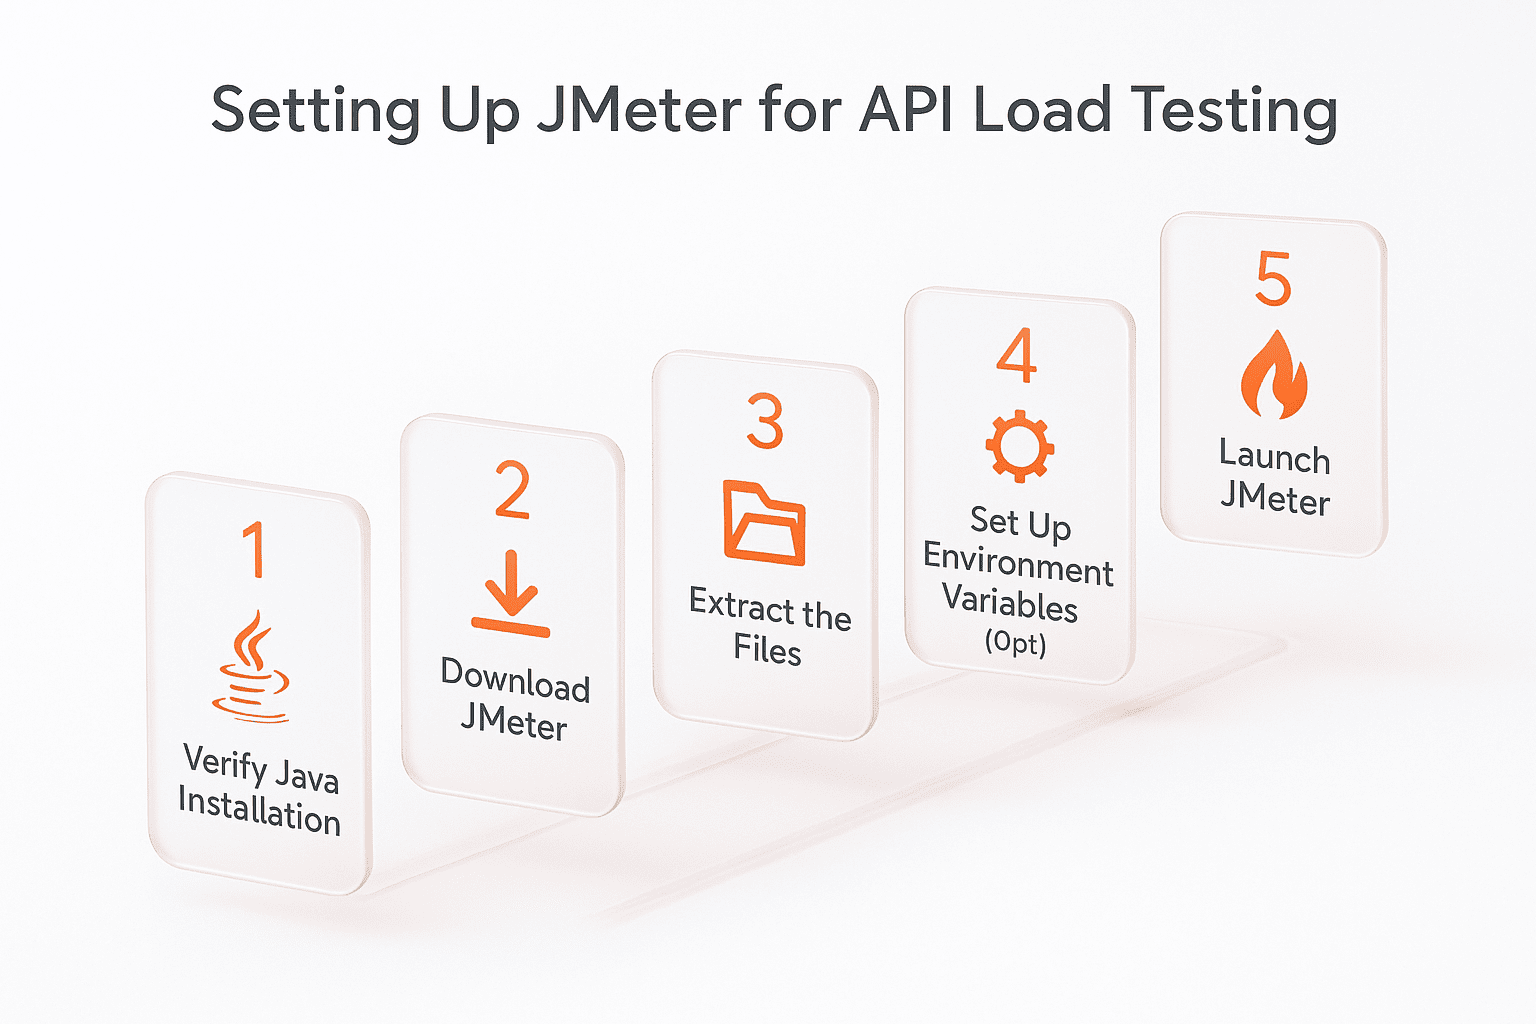
Setting Up JMeter for API Load Testing
Before you begin API testing using JMeter, you need to install and configure the tool properly. A correct setup ensures smooth execution of test plans and accurate performance results. Here’s a detailed walkthrough:
1. Verify Java Installation
JMeter is built on Java, so you’ll need a working Java installation.
Open the terminal (Linux/Mac) or command prompt (Windows) and run:java -version
2. Download JMeter
3. Extract the Files
The extracted folder will include a bin directory containing all the executables and configuration files.
4. Set Up Environment Variables (Optional but Recommended)
To simplify launching JMeter:
On Linux/Mac, you can add the following to your ~/.bashrc or ~/.zshrc:
export JMETER_HOME=/usr/local/apache-jmeter
export PATH=$JMETER_HOME/bin:$PATH
5. Launch JMeter
From here, you can start creating JMeter REST API testing scenarios and building test plans.
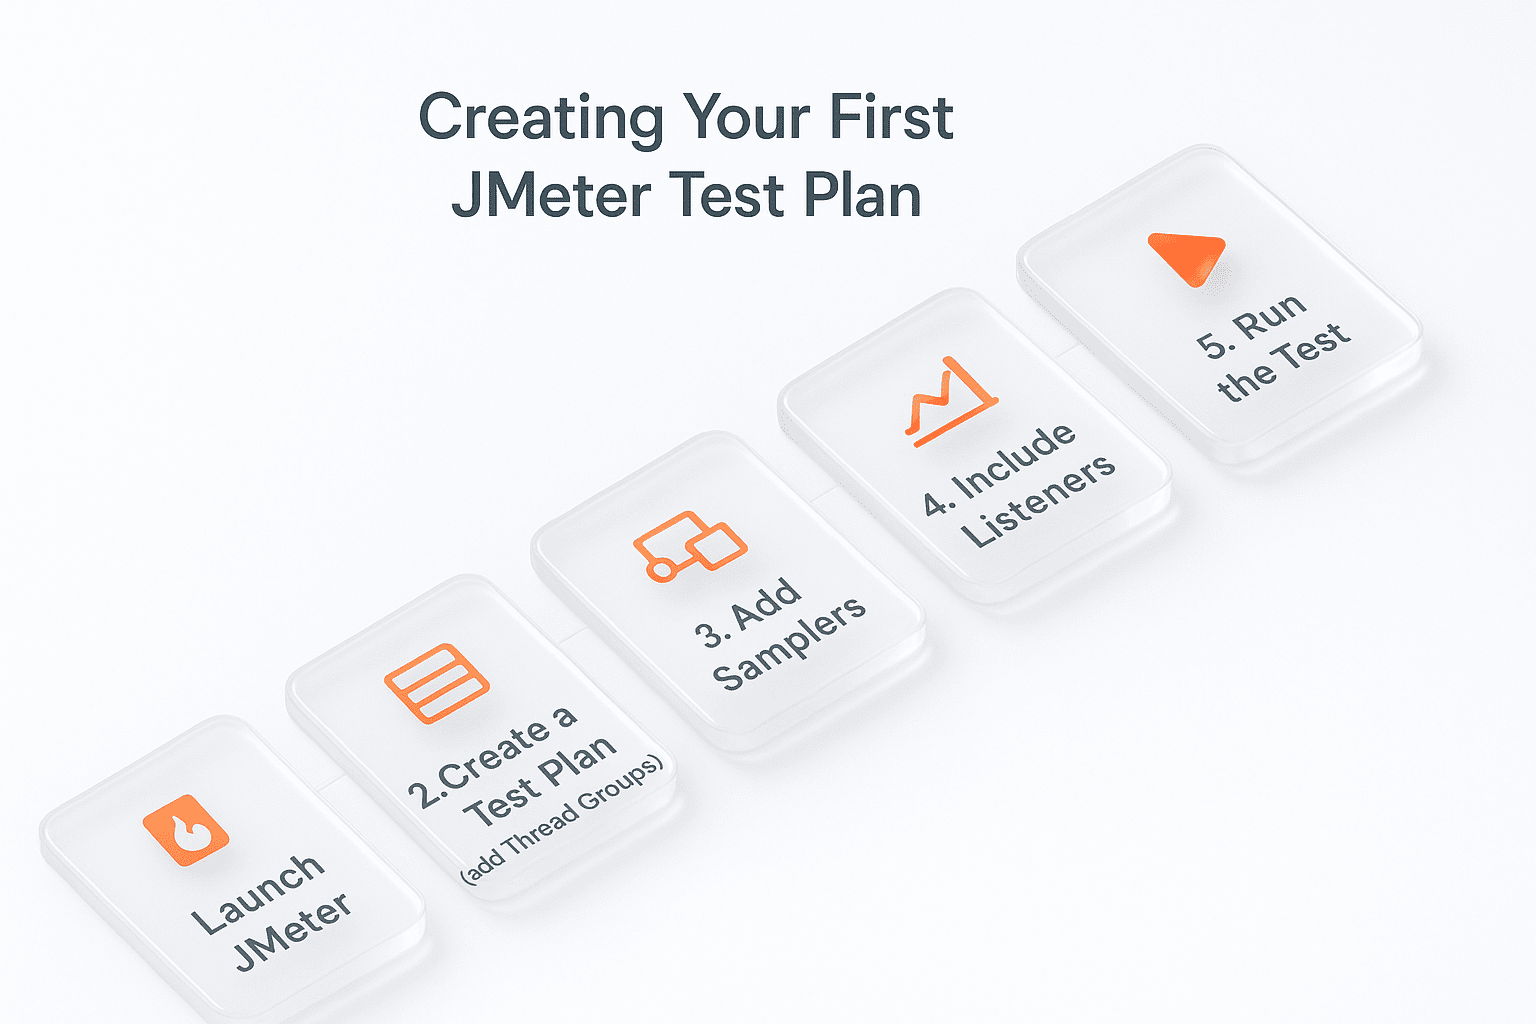
Creating Your First JMeter Test Plan
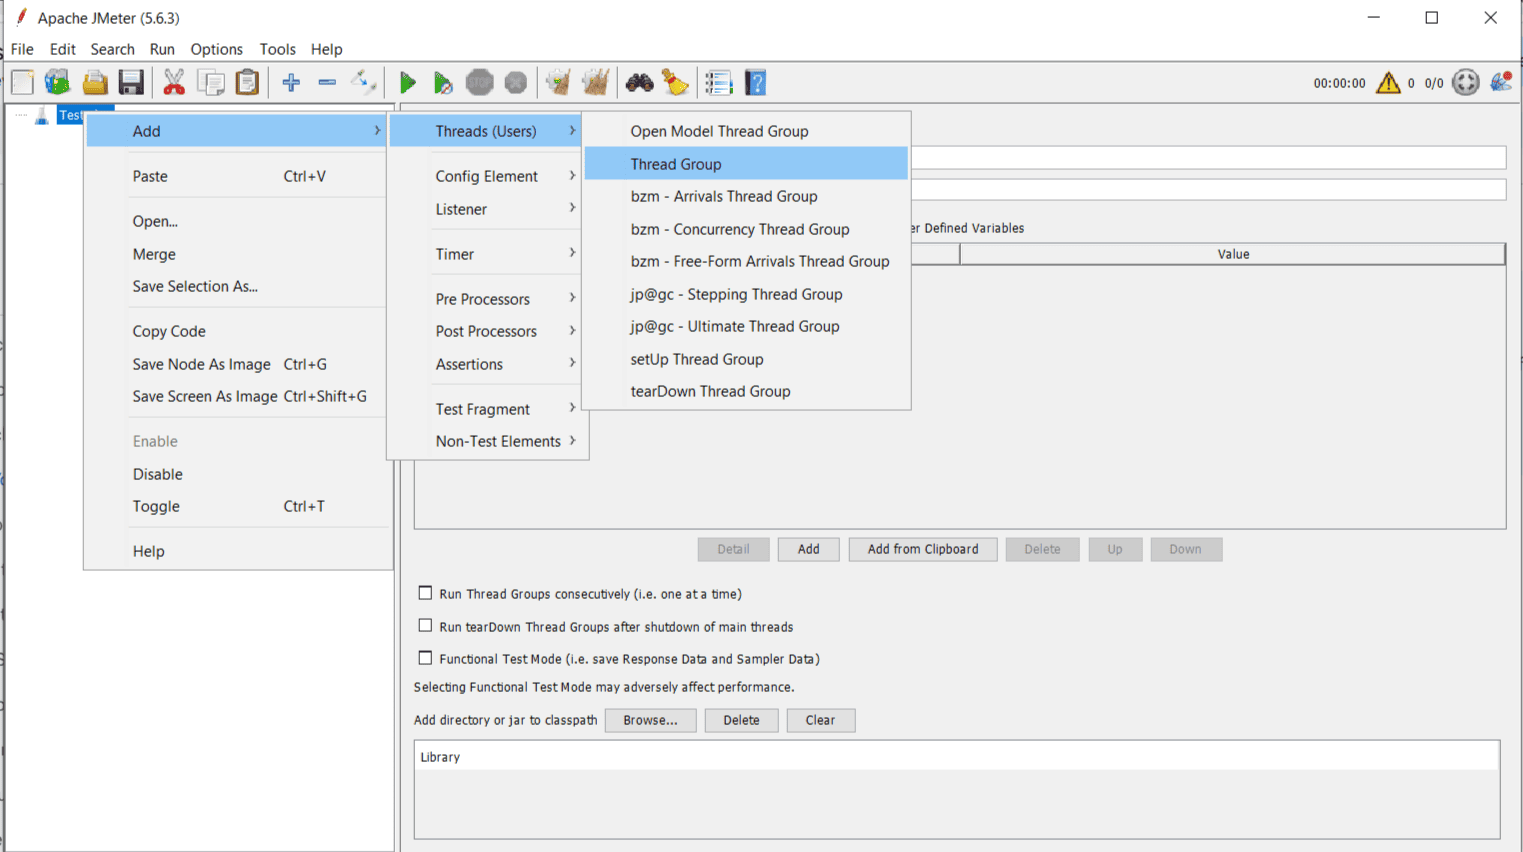
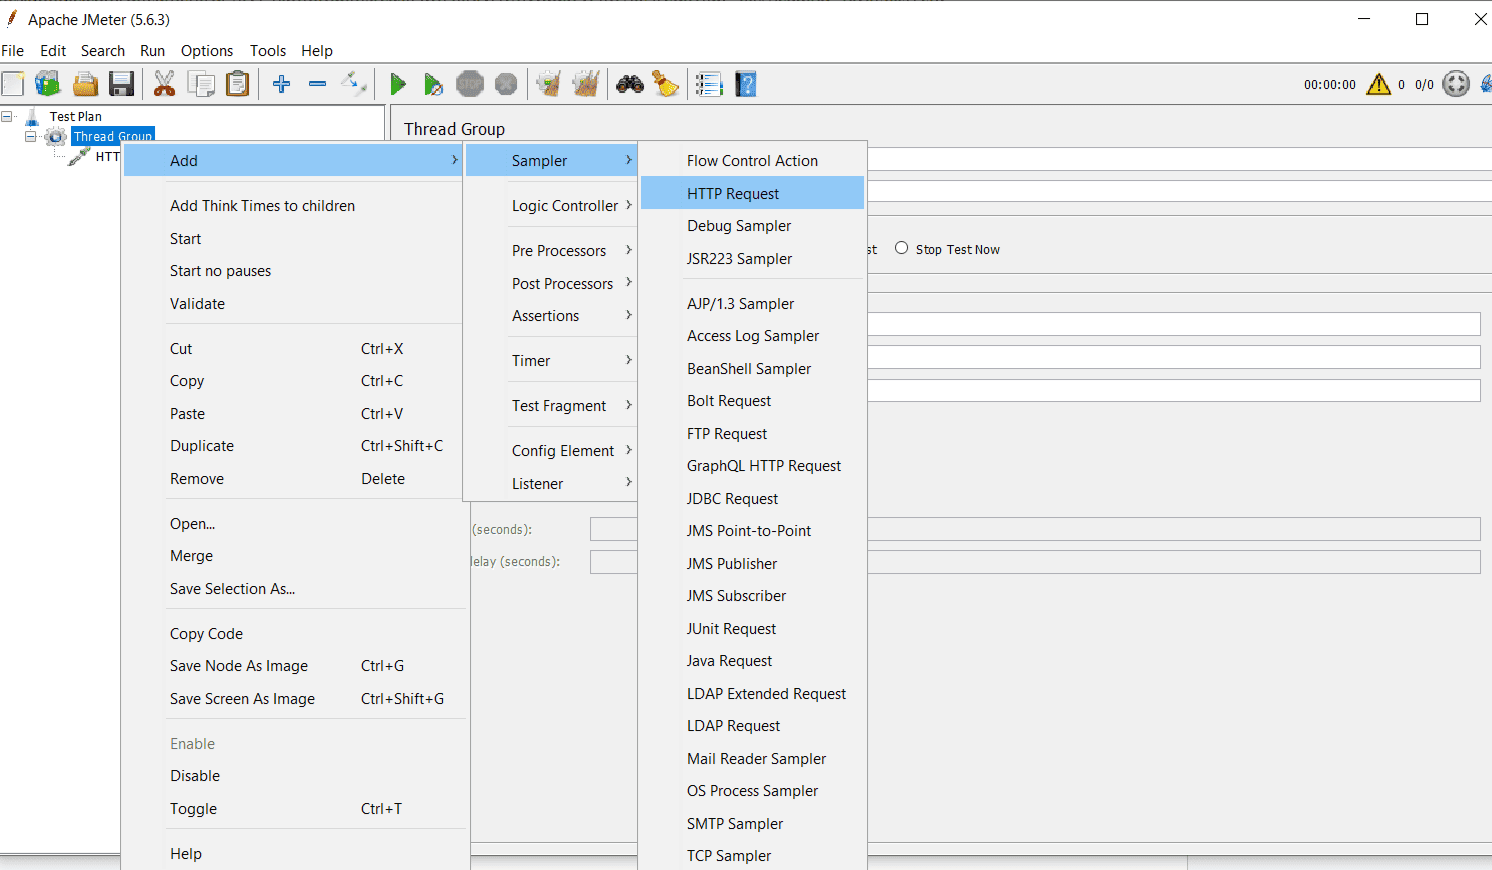
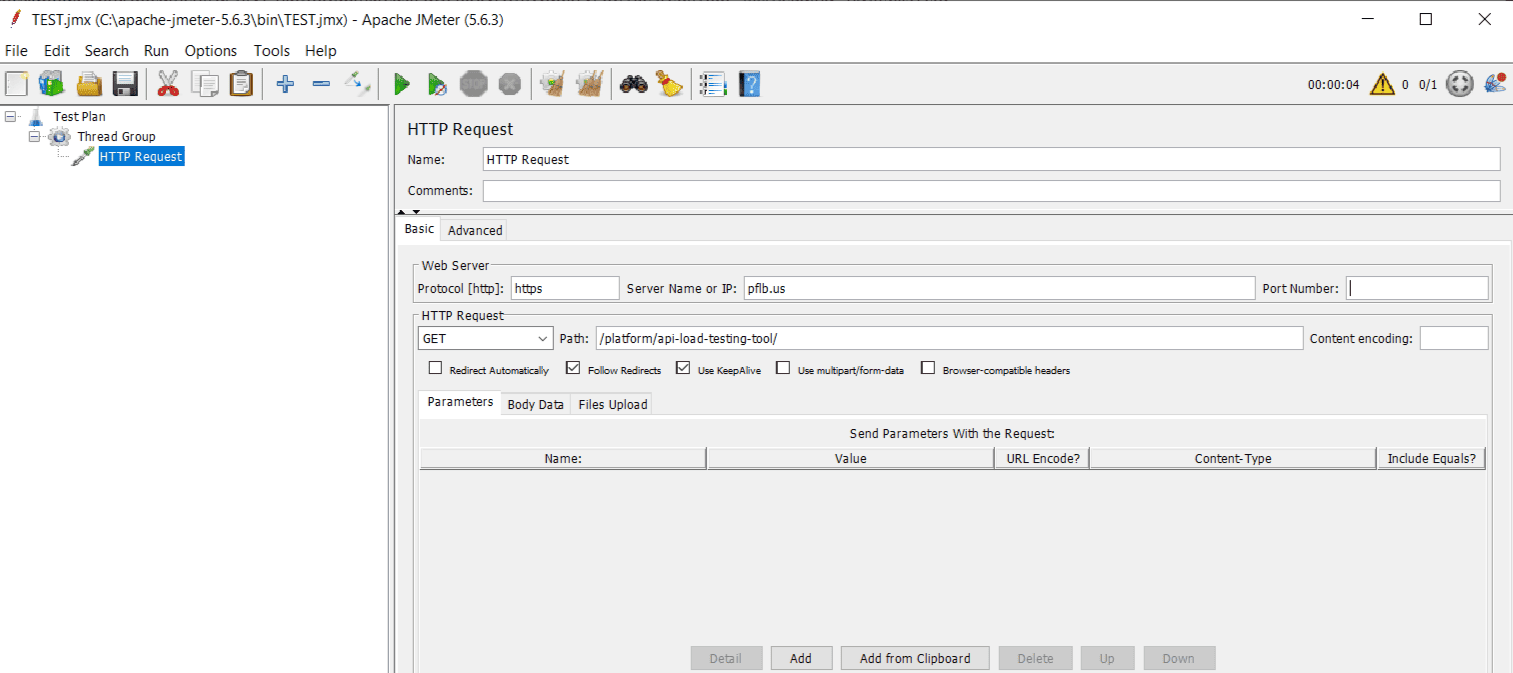
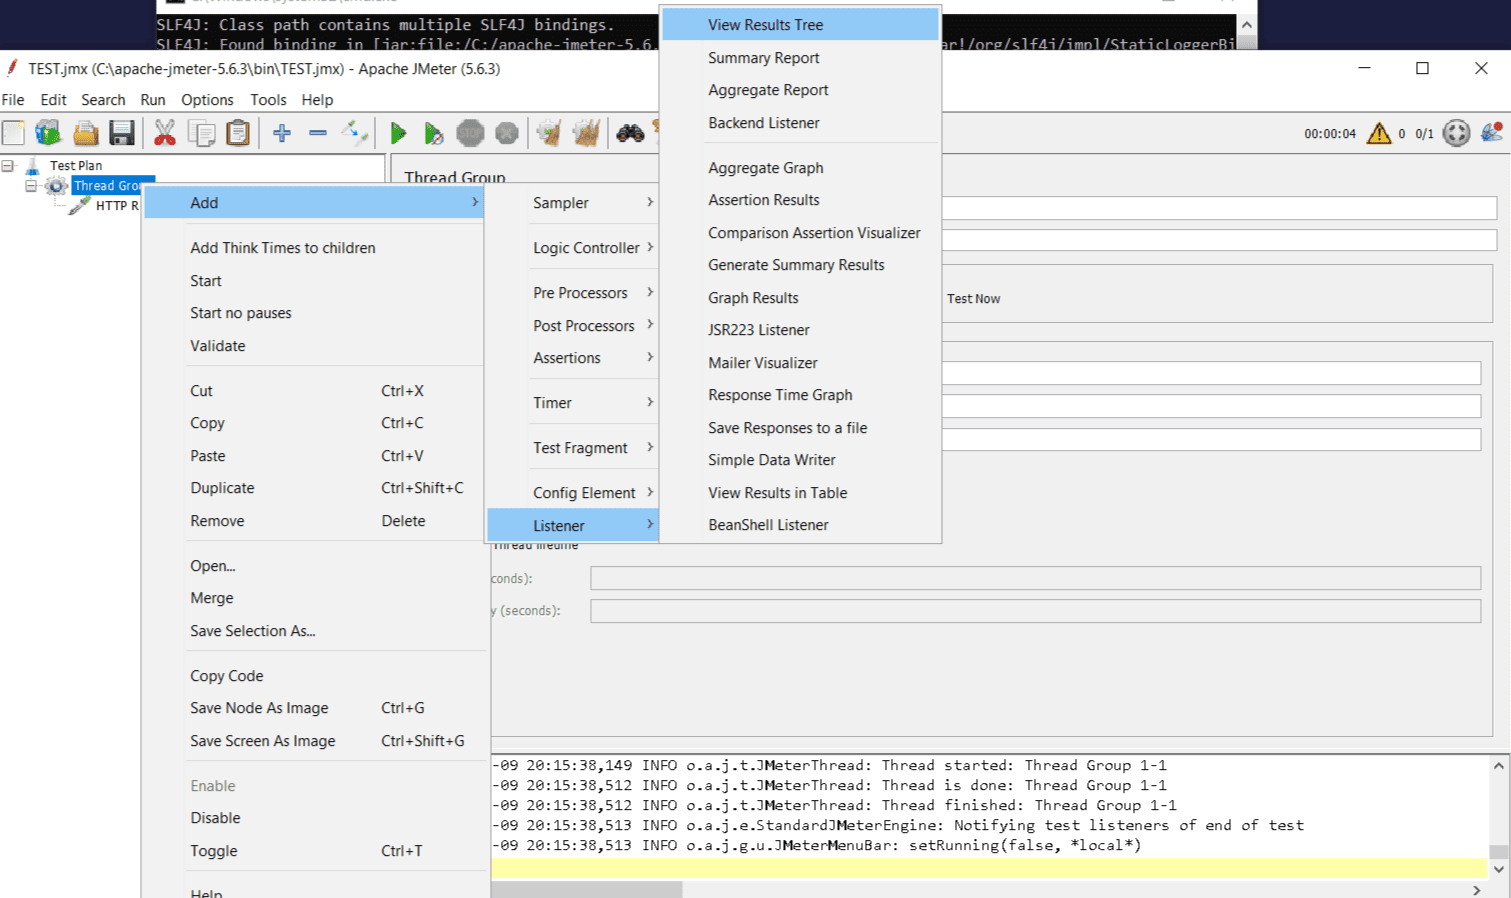
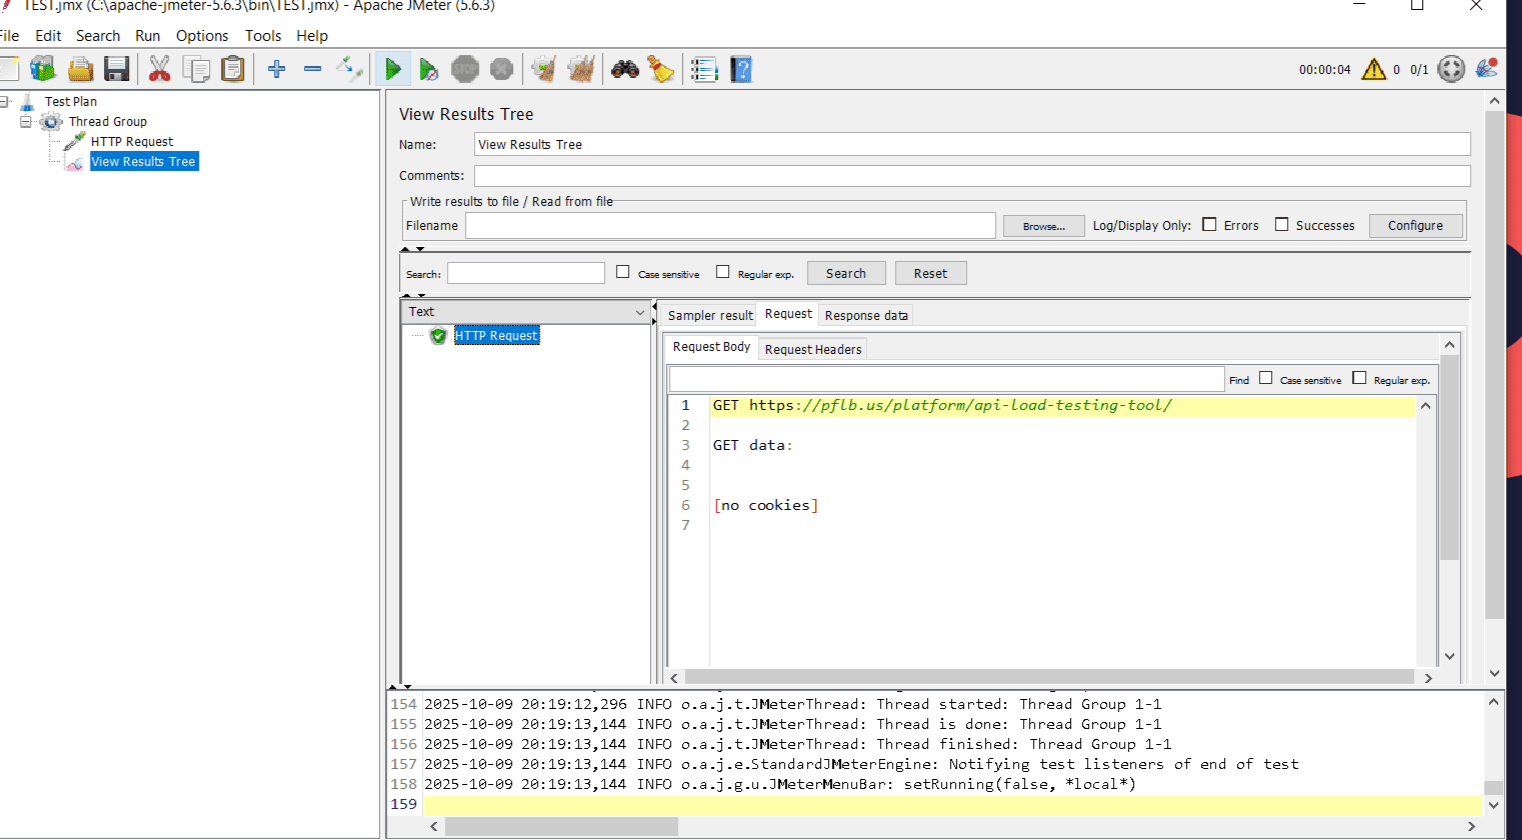
Once JMeter is installed, the next step is to build your first test plan. A test plan defines what will be tested, how requests are sent, and what results are collected. Here’s how to get started with API testing in JMeter:
With this simple setup, you’ve performed your first API load testing in JMeter. From here, you can expand the plan by adding timers, assertions, and multiple endpoints to simulate more complex scenarios.
Setting Up JMeter for Accurate Performance Testing Results
Getting meaningful results from API performance testing using JMeter depends heavily on how you configure your test plan. A poorly tuned setup can generate misleading numbers, while a properly designed one gives accurate, production-ready insights.
Start with HTTP Request Defaults to centralize common parameters such as server name, protocol, and port. This ensures all samplers inherit the same configuration and reduces errors in large-scale test plans. Once your requests are defined, introduce timers. Without them, JMeter will fire calls as quickly as the system allows, creating unrealistic traffic. Adding a Constant or Random Timer simulates human-like pauses between requests, making your REST API load testing in JMeter more realistic.
Next, use assertions to verify not just speed but correctness of responses. For example, confirm that a login API returns 200 OK with “success": true. Assertions help catch cases where an API responds quickly but delivers the wrong payload.
For monitoring, configure listeners wisely. Heavy listeners like “View Results Tree” are useful for debugging but consume too many resources during full load tests. Instead, rely on lighter options such as “Summary Report” or integrate JMeter with Grafana and InfluxDB for real-time dashboards.
Finally, tune your Thread Group settings carefully. Define the number of users, ramp-up period, and loop count based on your goals. For example, 500 users ramping up over 100 seconds provides a smoother load pattern than an immediate spike. Use gradual ramps for load testing, incremental increases for stress testing, and long durations for endurance testing.
When configured this way, JMeter for API testing delivers results that not only reflect how your system handles heavy load but also how accurately it processes requests.
Analyzing the Results: Key Metrics You Need to Know
Executing a test in JMeter is only half the job — the real value comes from interpreting the results. JMeter provides a variety of statistics, but a few core metrics consistently give the clearest picture of API performance.
Key JMeter Metrics for API Testing
| Metric | Definition | What It Reveals |
| Response Time | Average time for the server to process and return a request. | Indicates server speed and efficiency under load. |
| Throughput | Number of requests handled per second (or minute). | Shows scalability and system capacity. |
| Error Rate | Percentage of failed requests during the test. | Highlights system instability or resource exhaustion. |
| Latency | Delay between sending a request and receiving the first byte of the response. | Reflects network performance or back-end service delays. |
| Connect Time | Time required to establish a TCP connection with the server. | Identifies issues with networking, firewalls, or connection pools. |
Making Sense of the Data
By monitoring these metrics together, testers get a multi-dimensional view of API behavior; from server processing efficiency to infrastructure stability. This makes API testing in JMeter a diagnostic tool for improving system resilience.
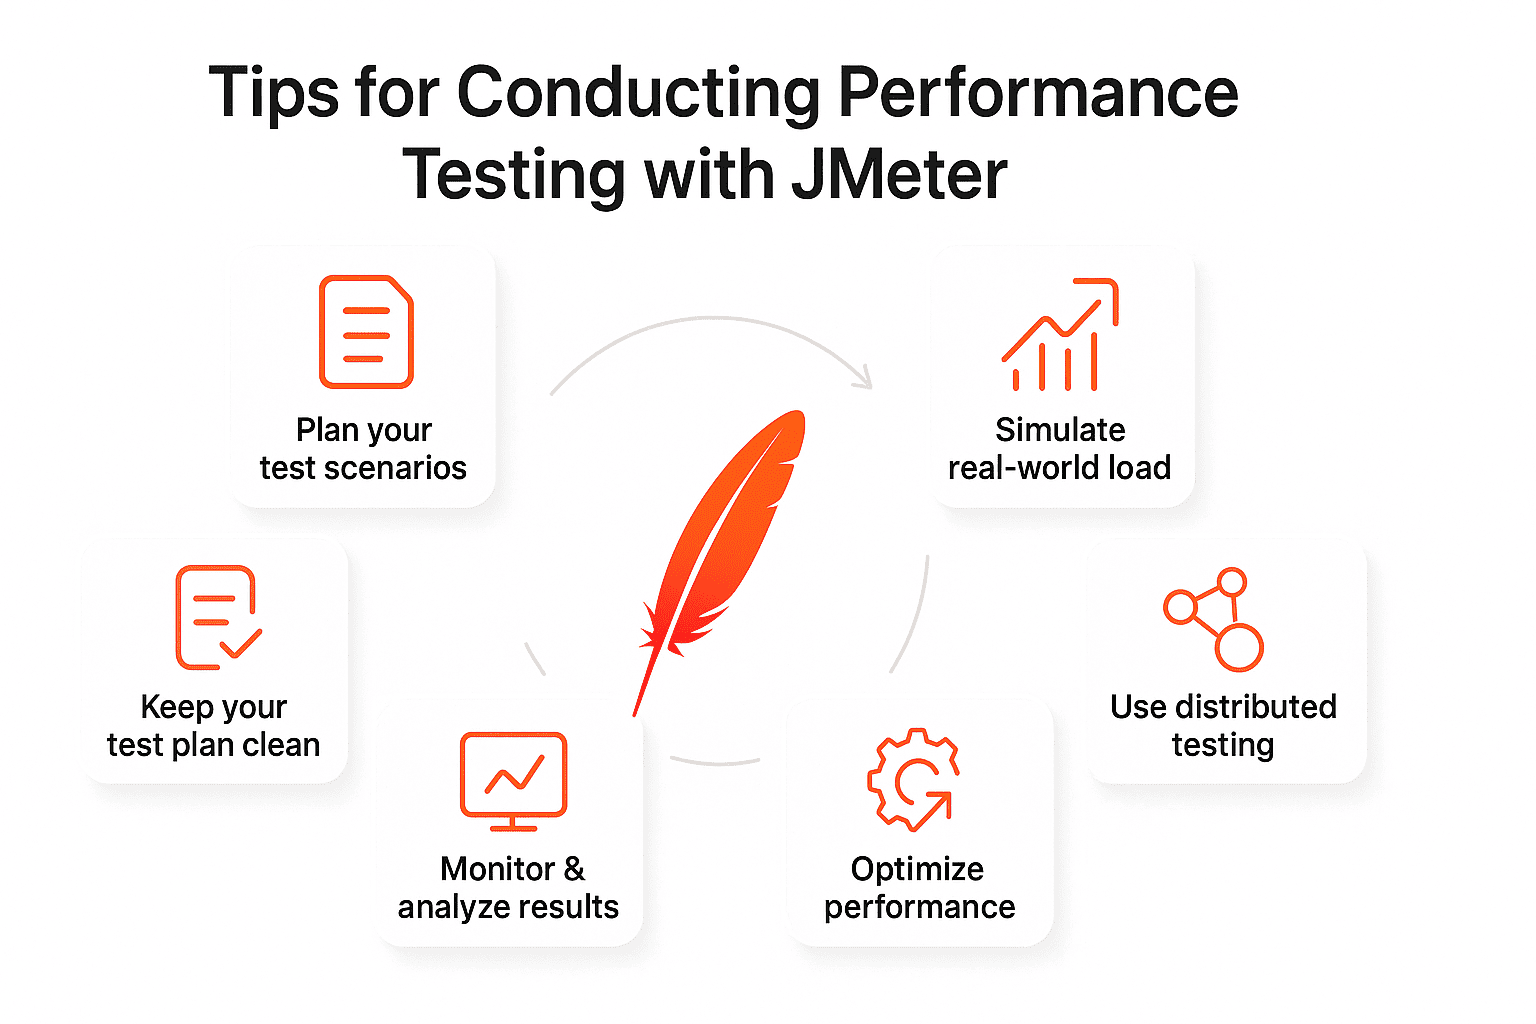
Tips for Conducting Performance Testing with JMeter
Running a JMeter test plan is straightforward, but running it effectively requires attention to detail. Here are expert practices to ensure your API testing in JMeter delivers reliable insights.
Plan Your Test Scenarios
Define realistic user journeys before you start. For example, a REST API test may include login, data retrieval, and logout requests in sequence. Planning ensures your test reflects real-world usage instead of isolated endpoints.
Keep Your Test Plan Clean
Avoid cluttering test plans with redundant samplers or unnecessary Listeners. Use HTTP Request Defaults to centralize configuration, and separate different scenarios into distinct Thread Groups for clarity.
Simulate Real-World Load
Introduce timers to replicate human think-time and set ramp-up periods that mimic gradual traffic growth. For REST API load testing using JMeter, this helps prevent unrealistic traffic spikes.
Use Distributed Testing for Scalability
For large-scale projects, run JMeter in distributed mode across multiple machines. This allows you to simulate thousands of concurrent users without overloading a single client machine.
Monitor and Analyze Results Thoroughly
Don’t rely only on JMeter’s built-in reports. Integrate with Grafana, InfluxDB, or Prometheus to monitor system health alongside JMeter metrics. Watching CPU, memory, and database utilization in parallel helps correlate API bottlenecks with resource issues.
Optimize for Better Performance
Iterate based on findings. If response times increase with user load, fine-tune server configurations, database queries, or caching strategies. Rerun tests to confirm improvements, making JMeter a continuous feedback loop for system optimization.
Looking for More Tools?
While JMeter for API testing is one of the most popular solutions, it’s not the only one. Depending on your project, you may need to compare features, scalability, and integrations across different platforms.
How PFLB Can Help with API Load Testing Using JMeter
At PFLB, we know that running JMeter tests is more about building reliable, enterprise-grade performance strategies. With over 15 years of experience in load testing and performance engineering, our team helps companies design, execute, and analyze API load testing in JMeter with precision.
What sets PFLB apart:
Explore Our Case Studies
Curious how these solutions work in practice? PFLB has partnered with leading banks, telecoms, healthcare providers, and software companies to solve complex performance challenges with JMeter and other tools.
Final Thoughts
JMeter API testing gives teams the control they need to validate API performance under load, analyze key metrics, and optimize for scalability. With the right setup and practices, it becomes not just a testing tool, but a foundation for building resilient applications.
At PFLB, we help organizations turn these tests into real business outcomes; faster systems, lower risks, and confident releases.


