Considering how much modern business now depends on cloud platforms, performance testing has become less of a “nice extra” and more of a basic requirement. That’s why our team at PFLB decided to put together this practical guide to performance testing of cloud applications in B2B environments.
Cloud systems behave differently from traditional setups. Resources scale automatically, traffic shifts across regions, and workloads often share underlying infrastructure. Because of this, performance problems tend to appear at the exact moments when systems are under pressure; during traffic spikes, scaling events, or sudden changes in demand. Testing auto-scaling policies under realistic load helps cloud applications stay available while keeping infrastructure costs under control. In our experience, these are the situations where hidden bottlenecks and misconfigured scaling rules are most likely to surface.
This guide focuses on modern cloud platforms and application backends, and it does not cover on-premise web performance testing or mobile app performance. It explains the core challenges of cloud performance testing, the test types that matter most, how to select the right tools, and how observability, cost awareness, and emerging models like serverless and edge computing fit into a cloud-native testing strategy.
Why Cloud Performance Testing Is Different
Performance testing in cloud environments follows a different set of rules than testing on fixed, on-premise infrastructure. The difference appears when we check how resources are allocated, shared, and billed.
In the cloud, compute, memory, and network capacity are elastic. Resources are added and removed dynamically based on demand, often without direct operator involvement. This flexibility allows applications to handle variable traffic, but it also makes performance behavior less predictable. A system may perform well under one load pattern and respond very differently when scaling events are triggered or when background workloads change.
Another defining factor is multi-tenancy. Cloud platforms rely on shared infrastructure, which means performance can be influenced by factors outside the application itself. From our experience, intermittent latency spikes and I/O variability are often linked to shared resource contention rather than application logic alone. Traditional performance tests that assume isolated infrastructure frequently fail to surface these effects.
If you want a deeper look at why backend load testing has become a core reliability requirement (not a “nice-to-have”), this guide explains it well: Why Application Load Testing Is Critical Today.
Cloud performance testing also introduces a closer relationship between stability and resource usage. An application can remain responsive during traffic spikes by scaling aggressively, but that behavior may also lead to inefficient resource consumption. Effective cloud performance testing should therefore examine not only whether a system remains available under load, but how it scales and whether that scaling behavior aligns with operational and cost expectations.
Finally,
cloud architectures are inherently distributed. Users, services, and data often span multiple regions, making network latency and cross-region dependencies a core part of performance behavior. Testing from a single location or with static assumptions rarely reflects real production conditions.
Together, these factors mean cloud performance testing is less about validating fixed limits and more about understanding system behavior under changing conditions.
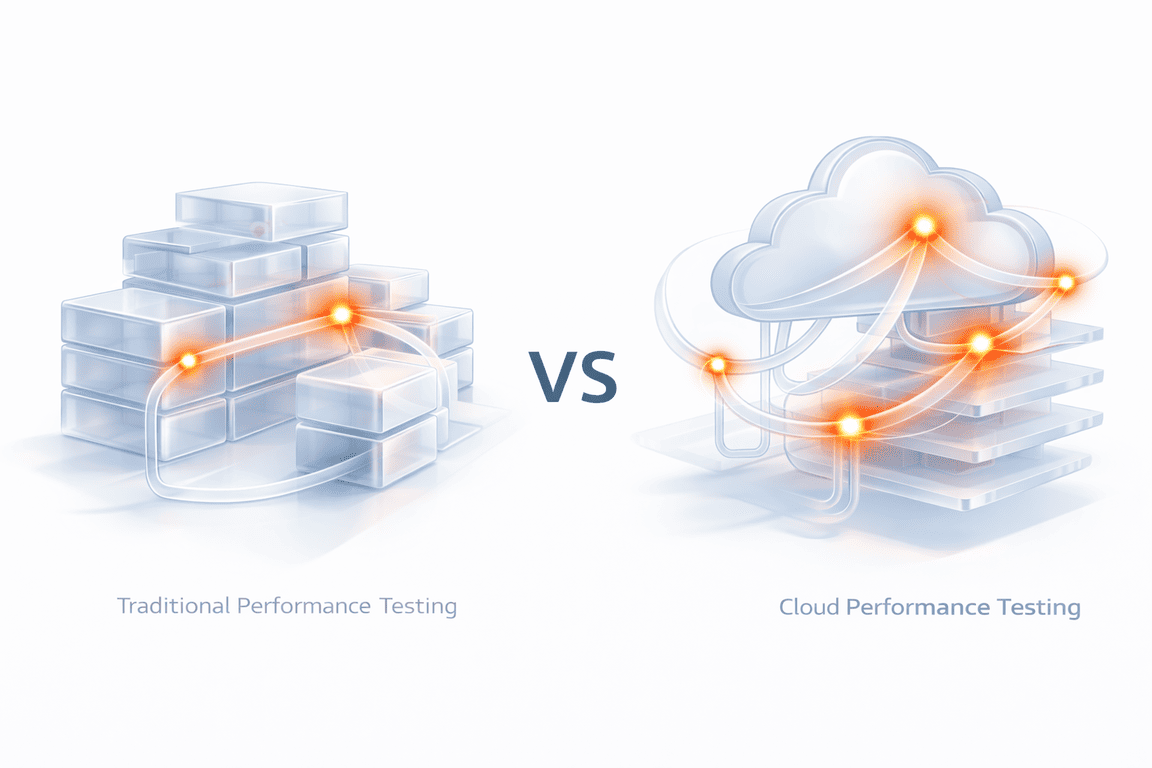
Cloud Performance Testing vs. Traditional Performance Testing
| Traditional | Cloud | |
|---|---|---|
| Infrastructure | Fixed servers | Elastic/shared |
| Scaling | Mostly manual | Auto via policies |
| Predictability | Higher | Variable |
| Latency | More stable | Region-dependent |
| Cost model | Mostly fixed | Usage-based |
| Environment | Long-lived | IaC + ephemeral |
| Observability | Basic often OK | Deep metrics/traces |
| Main risk | Hitting capacity | Bad scaling = outages or cost spikes |
Key Focus Areas and Metrics
Cloud performance testing only becomes useful when teams are clear about what success actually means.
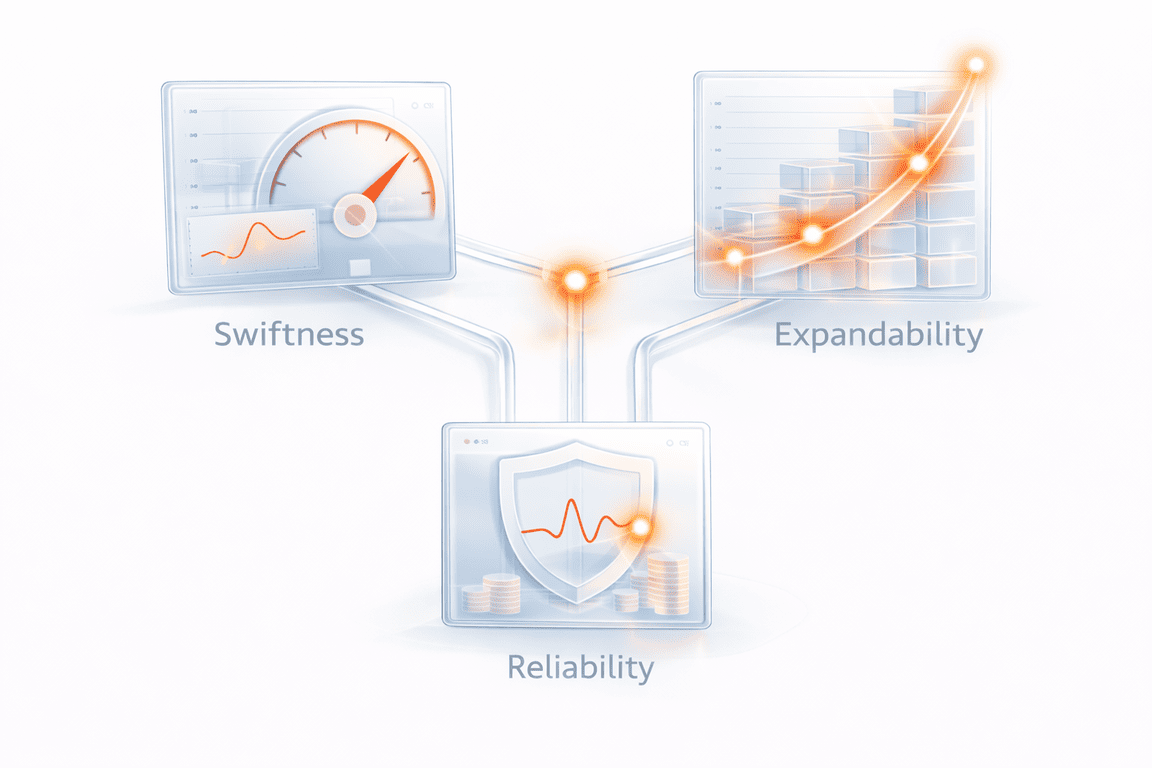
In fixed environments, performance is often reduced to speed and maximum load. In the cloud, the picture is broader. Systems scale dynamically, share infrastructure, and generate cost as they grow. Because of this, meaningful testing usually revolves around three connected dimensions: swiftness, expandability, and reliability; all interpreted through real operational impact.
Swiftness: Latency and Response Behavior
Speed is still the most visible sign of performance, but in cloud systems the distribution of latency matters far more than the average.
Percentile measurements, especially p95 and p99 response times, show whether a small portion of requests becomes dramatically slower during scaling events, regional congestion, or dependency delays. These tail behaviors are often what users actually feel.
In fact, the stakes for tail latency are incredibly high. Industry benchmarks for 2026 from WIRO Agency show that a mere one-second delay in load time can cause a 7% drop in conversions, while a three-second delay can slash them by 20%.
Additional signals such as cold-start latency in serverless functions, regional network delay, and available bandwidth help explain why response time changes under different conditions.
In our experience at PFLB,
incidents rarely begin with a total outage. They begin with a gradual widening of tail latency that traditional averages fail to reveal.
Swiftness metrics to track:
- p95 / p99 response time for key endpoints (not just average)
- Time to first byte (TTFB) for API responses (when relevant)
- Error + timeout rate during latency spikes (to separate “slow” from “failing”)
- Cold-start latency for serverless functions (first request vs warm)
- Regional latency split (same request, different regions)
- Network throughput / bandwidth usage during peaks
- Queue or dependency latency (DB, cache, message broker) when it affects response time
Expandability: Scaling and Throughput
Elasticity is one of the defining promises of cloud architecture, but real scalability depends on configuration, workload patterns, and downstream service health.
Testing must therefore examine whether throughput, typically measured in requests or transactions per second, increases smoothly as demand grows.
To understand scaling behavior, teams should observe CPU utilization, memory consumption, network bandwidth, and disk I/O, alongside the auto-scaling trigger thresholds that control when new capacity appears.
Across many real cloud investigations, the issue is not that systems fail to scale, but that they scale too late, too aggressively, or inefficiently, creating instability or unnecessary cost.

Testing scaling timing is critical because ‘instant’ scaling is a myth. Recent benchmarks from TheCodev (2025) reveal that median VM ‘cold start’ times range from 25 seconds (GCP) to 35 seconds (AWS). If your traffic spikes faster than your provider can spin up resources, users will experience a bottleneck.
Expandability signals to track:
- Throughput (requests/sec or transactions/sec) as load increases
- CPU utilization before and after scale-out
- Memory consumption and GC/memory pressure trends
- Network bandwidth (ingress/egress) during peak traffic
- Disk I/O and storage latency (especially for DB-heavy systems)
- Auto-scaling trigger thresholds (what metric triggers scaling, and at what value)
- Scale reaction time (how long it takes from trigger → added capacity)
- Scaling efficiency (throughput gained vs resources added)
Reliability: Stability Under Changing Load
Reliability in the cloud is less about sudden crashes and more about gradual degradation.
As pressure builds, small signals, rising error rates, increasing retries, or growing queues, often appear before any visible outage.
Performance testing must therefore evaluate how the system behaves over time, not only at peak throughput.
This includes understanding how resource saturation, dependency slowdowns, or partial regional failures influence overall stability.
From practical testing experience, the most damaging failures are usually the slowest to appear.
Reliability signals to watch during a run:
- Error rate (5xx, failed transactions) as load increases
- Timeout rate and where timeouts happen (API gateway, service, DB)
- Retry volume (retries hiding a deeper issue)
- Queue depth / backlog growth (and processing lag)
- Resource saturation: CPU throttling, memory pressure, disk I/O limits
- Connection pool exhaustion (DB, cache, outbound HTTP)
- Thread/worker saturation (request workers, async workers)
- Regional imbalance (one zone/region degrading earlier than others)
Reliability often fails not at the code level, but at the configuration level. The 2026 Cloud Security Trends Report highlights that 70% of security and performance incidents are now driven by cloud misconfigurations, underscoring the need for testing that validates infrastructure-as-code (IaC) settings.
| 🛡️ Reliability Action: Implement Circuit BreakersIn a cloud environment, a slow dependency (like a third-party API) is more dangerous than a dead one. If your performance test shows retries climbing, the system is at risk of a “retry storm” that will eventually crash your database. |
| The Action: During testing, validate that your Circuit Breaker pattern trips after 5 consecutive failures or a p99 latency spike of >2 seconds. The system should stop calling the failing service and return a cached response or an error immediately to preserve resources. |
Cost Awareness and Business Alignment
One dimension that is unique to cloud performance testing is cost visibility. Every scaling decision, retry loop, or inefficient resource allocation directly affects infrastructure spend. Measuring cost per test cycle helps teams understand whether stability is being achieved efficiently, or simply purchased through excessive scaling.
Ultimately, metrics only matter when they connect to SLAs, user experience, and business KPIs.
Without that alignment, performance testing produces numbers, but not insight.
Cost and efficiency signals to track:
- Cost per test cycle (total spend for the run)
- Cost per transaction (or cost per 1,000 requests)
- Scaling efficiency (throughput gained vs compute added)
- Over-scaling indicators (instances up, throughput barely moves)
- Retry cost (extra calls and compute caused by retries/timeouts)
- Cross-region traffic costs (egress, inter-zone transfer)
- Database and cache cost hotspots (read/write spikes, connection churn)
Types of Cloud Performance Tests
Cloud systems fail in more ways than traditional infrastructure, which is why a single “load test” is never enough.
Effective cloud performance testing combines several test types, each designed to answer a different reliability, scaling, or resilience question. Together, these tests help teams understand not just whether the system works under pressure, but how it behaves as conditions change.
Cloud Performance Test Type: Quick Overview
| Test type | What it really reveals | Scaling insight | Long-term stability | Cloud-specific value | Effort |
|---|---|---|---|---|---|
| Load | Normal user experience under expected traffic | ⚠️ Early signals | Limited | Validates SLAs | ⭐⭐ |
| Stress | Breaking points and recovery behavior | ✅ Clear limits | Short-term only | Tests auto-scaling and quotas | ⭐⭐ |
| Scalability | How smoothly capacity grows with demand | ✅ Core focus | Scenario-based | Reveals scaling efficiency | ⭐⭐ |
| Soak (endurance) | Failures that appear after hours | ⚠️ Indirect | Strong signal | Finds memory leaks and retry buildup | ⭐⭐⭐ |
| Capacity / volume | Practical operational limits | ✅ Maximum range | Snapshot view | Shows cost vs throughput boundary | ⭐⭐⭐ |
| Failover | Resilience during zone or region loss | ⚠️ Indirect | Event-driven | Validates multi-region design | ⭐⭐⭐ |
| Browser / client | Real user experience across devices | ❌ None | User-side only | Complements backend tests | ⭐⭐ |
| Latency (geographic) | Impact of distance and routing | ❌ None | Not stability-focused | Critical for global apps | ⭐⭐ |
| Edge / serverless | Cold starts, burst scaling, hidden cost | ✅ Rapid scaling | Concurrency limits | Unique cloud behavior | ⭐⭐⭐ |
1. Load Testing: Performance Under Expected Demand
Load testing validates how the application performs under normal, anticipated traffic levels.
The goal is not to break the system, but to confirm that key user journeys meet response-time targets, throughput expectations, and SLA requirements when real usage patterns are simulated.
In cloud environments, realistic load modeling is critical. From our experience, tests that ignore regional distribution, burst traffic, or dependency latency often pass in staging yet fail in production.
2. Stress Testing: Finding the Breaking Point
Stress testing deliberately pushes the system beyond expected limits to observe how it fails and recovers.
In the cloud, this is also where auto-scaling policies are truly validated. A system that survives stress by scaling correctly behaves very differently from one that collapses due to delayed scaling, exhausted quotas, or dependency overload.
The objective is not just failure, but controlled failure, understanding where degradation begins and whether recovery is predictable.
3. Scalability Testing: Verifying Elastic Growth
Scalability testing focuses on whether the system can expand and contract resources smoothly as demand changes.
Unlike stress testing, the emphasis here is not on breaking limits but on observing scaling efficiency, reaction timing, and stability during growth.
In practice, many cloud incidents stem from scaling logic rather than raw capacity, which makes this test type essential for modern architectures.
4. Soak Testing: Stability Over Time
Soak (or endurance) testing runs the system under sustained load for extended periods to uncover slow-forming problems such as memory leaks, connection exhaustion, or retry accumulation.
Cloud failures often emerge gradually rather than instantly. Long-running tests therefore reveal risks that short load spikes cannot expose.
5. Capacity and Volume Testing: Defining Practical Limits
Capacity testing determines the maximum concurrent users, transactions, or data volume the system can handle before performance degrades beyond acceptable thresholds.
In cloud systems, this is less about a fixed ceiling and more about identifying where scaling stops being efficient or reliable, which is often a more meaningful operational boundary.
6. Failover Testing: Resilience During Disruption
Failover testing validates whether the system remains available when instances, zones, or regions fail.
This includes verifying load balancing behavior, redundancy mechanisms, and recovery timing.
From real cloud investigations, partial regional failures are far more common than total outages, making failover behavior a critical reliability signal.
7. Browser and Client Testing: Real User Experience
Even perfectly scaling backends can deliver poor user experience if client-side performance varies across browsers, devices, or network conditions.
Testing from the client perspective ensures that backend resilience actually translates into usable performance for real users.
8. Latency Testing: Geography and Network Reality
Cloud applications are inherently distributed, which makes latency testing across regions essential.
Single-location tests rarely reflect real-world performance, especially for global user bases or cross-region service calls.
Understanding geographic latency patterns often explains production issues that infrastructure metrics alone cannot reveal.
9. Edge and Serverless Testing: New Execution Models
Serverless functions and edge computing introduce cold starts, concurrency limits, and regional execution variability that traditional testing never had to consider.
Performance testing must therefore simulate burst traffic, first-request delays, and distributed execution paths to capture realistic behavior.
These architectures reduce infrastructure management, but they also make testing strategy more critical, not less.
Planning a Cloud Performance Test Strategy
After working on performance projects across different industries, SaaS platforms, internal enterprise systems, and high-traffic APIs, one thing becomes clear: cloud testing only works when the strategy is built around how the system is actually used.
Below is the planning framework our team at PFLB typically follows. It’s practical, repeatable, and designed to prevent the most common “tests passed, production failed” situation.
If you’re also weighing whether to build this capability internally or bring in specialists for big releases, here’s a practical comparison for you: Outsourcing vs. In-House Application Load Testing.
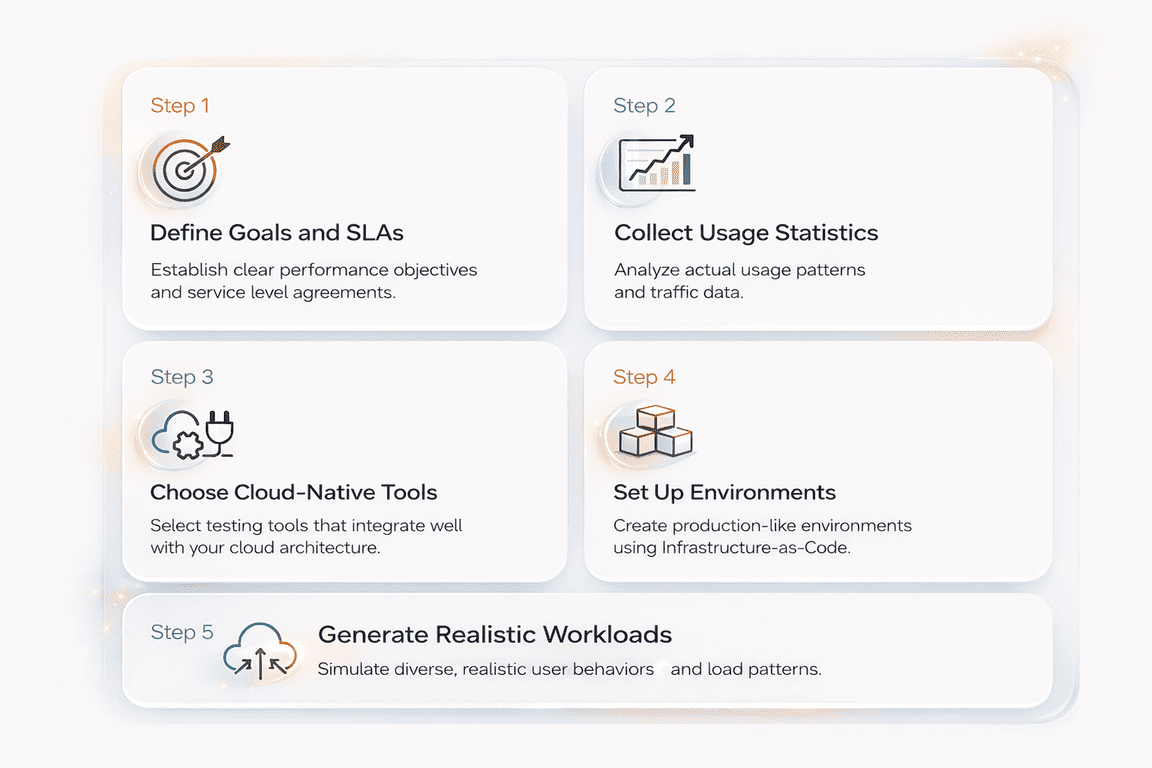
Step 1: Define Goals and SLAs First
Cloud performance testing should begin with the transactions that drive real business value, not individual pages or endpoints. Each critical flow must have clear, measurable expectations before any load scripts or tools are introduced.
For example,
a checkout workflow might require p95 latency below 2 seconds at 1,000 concurrent users with an error rate under 0.5%. This kind of definition makes performance testable and tied directly to revenue impact.
Defining SLAs for Key Transactions:
| Parameter | What to define | Example (Checkout flow) |
|---|---|---|
| Peak load target | Expected concurrency or throughput at peak usage | 1,000 concurrent users or 300 RPS |
| Latency objective | Target response time using p95/p99 | p95 ≤ 2 seconds |
| Acceptable error rate | Maximum failed or timed-out requests under load | ≤ 0.5% errors |
| Business KPI linkage | Real impact tied to performance | Maintain checkout completion and avoid SLA penalties |
Step 2: Collect Usage Statistics Before Designing Tests
Realistic cloud performance tests start with real traffic data, not assumptions. Without production signals, load models tend to be too smooth, too uniform, and disconnected from how the system is actually used.
From practical testing experience, the biggest gaps usually come from underestimating burst traffic, regional imbalance, or background workloads such as batch jobs and partner integrations.
Production Signals to Collect Before Designing Tests
| Signal | What it reveals | Why it matters for cloud testing |
|---|---|---|
| Peak and average concurrency | Real user load range | Prevents under- or over-estimating scale targets |
| Traffic distribution by endpoint | Which transactions dominate usage | Ensures workload weighting reflects reality |
| Geographic request patterns | Regional traffic concentration | Exposes latency, routing, and scaling differences |
| Time-based spikes | Bursts from campaigns, cron jobs, or reporting | Validates scaling and stability during sudden load |
| Retry and error behavior | Hidden amplification of traffic | Reveals cascading load and dependency instability |
Step 3: Choose Cloud-Native Tools That Match Your Architecture
Tool selection in cloud performance testing should be driven by system architecture, scale requirements, and observability needs, not popularity alone.
The most effective setups are those that teams can run repeatedly, scale easily, and integrate directly into CI/CD and monitoring pipelines.
Cloud-ready performance tools typically provide:
- Distributed load generation that can scale across containers or regions
- Container-native execution, often orchestrated through Kubernetes
- Flexible scripting for APIs, authentication flows, and complex transactions
- Native observability integration with platforms like Grafana, Prometheus, or cloud monitoring services
- Cost control mechanisms, such as short-lived environments and predictable execution time
Here are some of the cloud-native tools you can use:
| Tool / Platform | Best suited for | Key strengths in cloud environments |
|---|---|---|
| JMeter on Kubernetes | Large distributed load tests | Mature ecosystem, flexible scripting, horizontal scaling through containers |
| k6 + Grafana | CI/CD-driven performance testing | Lightweight execution, strong observability integration, developer-friendly scripting |
| Gatling | Code-centric scenario modeling | High throughput, precise workload control, good fit for API and microservice testing |
| NeoLoad | Enterprise performance programs | Advanced reporting, governance features, integration with enterprise toolchains |
| PFLB | End-to-end cloud performance strategy and execution | Realistic workload modeling, production-like environments, deep analysis tied to SLAs, cost, and business impact |
Step 4: Set Up Production-Like Environments Using Infrastructure-as-Code
Cloud performance tests are only reliable when the test environment closely matches production. Differences in regions, scaling rules, networking, or security can make results look healthy while real users still face failures.
To avoid this, mature teams use Infrastructure-as-Code (IaC) tools such as Terraform or CloudFormation to create reproducible, on-demand environments for testing.
Example: Minimal Terraform Test Environment
resource "aws_autoscaling_group" "perf_test" {
  desired_capacity     = 3
  max_size             = 10
  min_size             = 2
  vpc_zone_identifier  = var.subnets
  launch_template {
    id      = aws_launch_template.app.id
    version = "$Latest"
  }
  tag {
    key                 = "environment"
    value               = "performance-test"
    propagate_at_launch = true
  }
}
This kind of reproducible definition ensures performance tests run against real scaling behavior, not simplified staging infrastructure.
A production-like setup should mirror:
- Regions and routing configuration
- Instance types or concurrency limits
- Auto-scaling rules and thresholds
- Network topology and internal latency paths
- Security controls (IAM, RBAC, firewall rules)
In practice, many false-positive test results come from simplified staging environments that do not reflect real scaling or traffic behavior.
IaC helps ensure performance tests run against realistic conditions while allowing fast teardown to control cloud cost.
Step 5: Generate Realistic Workloads
Effective cloud performance testing depends on how accurately the workload reflects real user and system behavior. Testing a single endpoint at constant speed rarely exposes the issues that appear in production, where traffic is uneven, multi-step, and geographically distributed.
Workloads should model:
- End-to-end user journeys (for example: login → browse → purchase → confirmation)
- Weighted actions to reflect real usage patterns across features
- Think time and idle periods between requests
- Peak windows and sudden traffic spikes from campaigns or batch activity
- Multi-region request distribution using geographically distributed load generators
Example: Multi-Region, Weighted, SLA-Aware k6 Scenario
This example verifies whether globally distributed user traffic can complete real transactions within defined p95 latency targets, revealing scaling delays or regional performance asymmetry early.
import http from "k6/http";
import { check, sleep } from "k6";

export const options = {
  scenarios: {
    eu_users: {
      executor: "ramping-vus",
      startVUs: 10,
      stages: [
        { duration: "2m", target: 60 },
        { duration: "3m", target: 60 },
        { duration: "1m", target: 0 },
      ],
      tags: { region: "eu-central-1" },
      exec: "userJourney",
    },
    us_users: {
      executor: "ramping-vus",
      startVUs: 20,
      stages: [
        { duration: "2m", target: 100 },
        { duration: "3m", target: 100 },
        { duration: "1m", target: 0 },
      ],
      tags: { region: "us-east-1" },
      exec: "userJourney",
    },
  },

  thresholds: {
    "http_req_duration{region:eu-central-1}": ["p(95)<900"],
    "http_req_duration{region:us-east-1}": ["p(95)<700"],
    http_req_failed: ["rate<0.01"],
  },
};

export function userJourney() {
  const baseUrl = __ENV.BASE_URL;

  // Step 1: Browse catalog
  const browse = http.get(`${baseUrl}/catalog`);
  check(browse, { "catalog loaded": (r) => r.status === 200 });

  sleep(Math.random() * 2); // realistic think time

  // Step 2: View product
  const product = http.get(`${baseUrl}/product/sku-123`);
  check(product, { "product ok": (r) => r.status === 200 });

  sleep(Math.random() * 3);

  // Step 3: Checkout attempt
  const checkout = http.post(`${baseUrl}/checkout`, JSON.stringify({ sku: "sku-123" }), {
    headers: { "Content-Type": "application/json" },
  });

  check(checkout, { "checkout success": (r) => r.status === 200 });
}
Running region-specific scenarios helps expose latency asymmetry and routing delays that single-location tests rarely detect.
In our experience, the most serious cloud incidents often come from traffic patterns that were never simulated, rather than from raw load alone.
Realistic workload design is therefore one of the strongest predictors of whether a performance test will match production behavior.
Executing Cloud Performance Tests
Once the strategy, environment, and workloads are defined, execution should follow a controlled and observable progression rather than a single large test run.
This staged approach helps teams understand not only whether the system fails, but how performance changes as pressure increases.
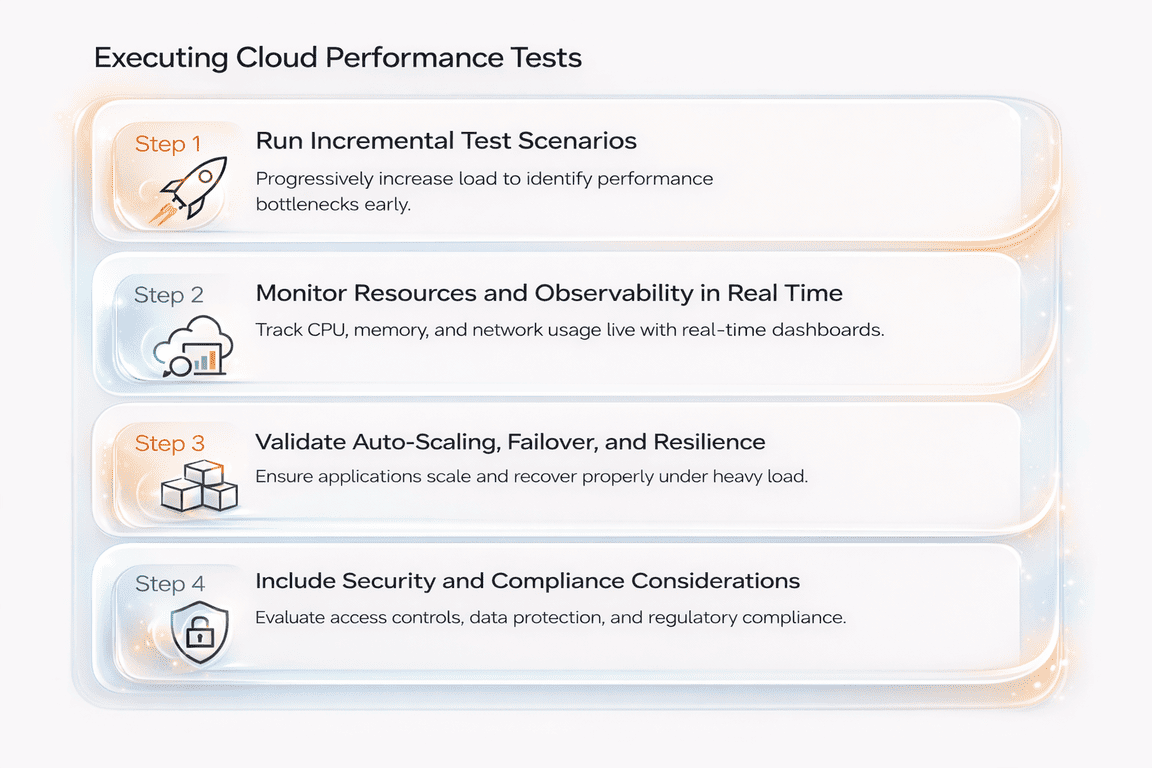
Step 1: Run Incremental Test Scenarios
Cloud performance tests should begin with a baseline load and grow step by step toward peak and extreme conditions.
Usually, execution stages include:
- Baseline load to confirm normal behavior and metric stability
- Gradual ramp-up to observe scaling response and latency trends
- Sustained peak load to validate SLAs under real pressure
- Spike testing to simulate sudden traffic bursts
- Recovery observation to verify stabilization after load drops
This progression reveals scaling delays, hidden bottlenecks, and instability that single-step stress tests often miss.
Step 2: Monitor Resources and Observability in Real Time
Execution without deep visibility provides limited value. Cloud-native monitoring platforms such as AWS CloudWatch, Azure Monitor, and Google Cloud Operations allow teams to track infrastructure metrics, application behavior, and scaling activity during the test.
Effective observability should include:
- CPU, memory, network, and disk utilization
- Latency percentiles and throughput trends
- Error rates and retry behavior
- Auto-scaling events and instance lifecycle changes
- Distributed traces and centralized logs for root-cause analysis
From practical testing experience, the most useful findings often come from correlating latency spikes with specific services, queries, or scaling delays, rather than from raw averages alone.
Step 3: Validate Auto-Scaling, Failover, and Resilience
Cloud execution must also confirm how the system behaves during dynamic infrastructure changes. This includes testing whether auto-scaling policies react at the right moment, whether failover mechanisms activate correctly, and whether multi-region routing maintains service continuity.
Key validation areas:
- Scaling trigger timing and capacity growth
- Behavior during instance termination or restart
- Regional failover and load balancing response
- Dependency resilience under partial failure
In many real incidents, systems technically scale, but too slowly or inefficiently, leading to degraded performance or unnecessary cost.
Step 4: Include Security and Compliance Considerations
Performance tests in cloud environments must also respect security and data protection requirements. Sensitive data should be masked or synthetic, authentication flows must remain valid, and infrastructure configurations should be checked for unintended exposure.
Common safeguards include:
- OAuth or token-based authentication during tests
- Role-based access control for test environments
- Secure handling of logs and captured data
- Configuration and vulnerability scanning where required
This ensures that performance validation does not introduce operational or compliance risk.
Analyzing Results and Optimizing
Running a cloud performance test is only valuable if the results lead to clear technical and business decisions. Raw metrics alone rarely explain what actually limits performance. The real insight comes from interpreting patterns, correlations, and cloud-specific behavior.
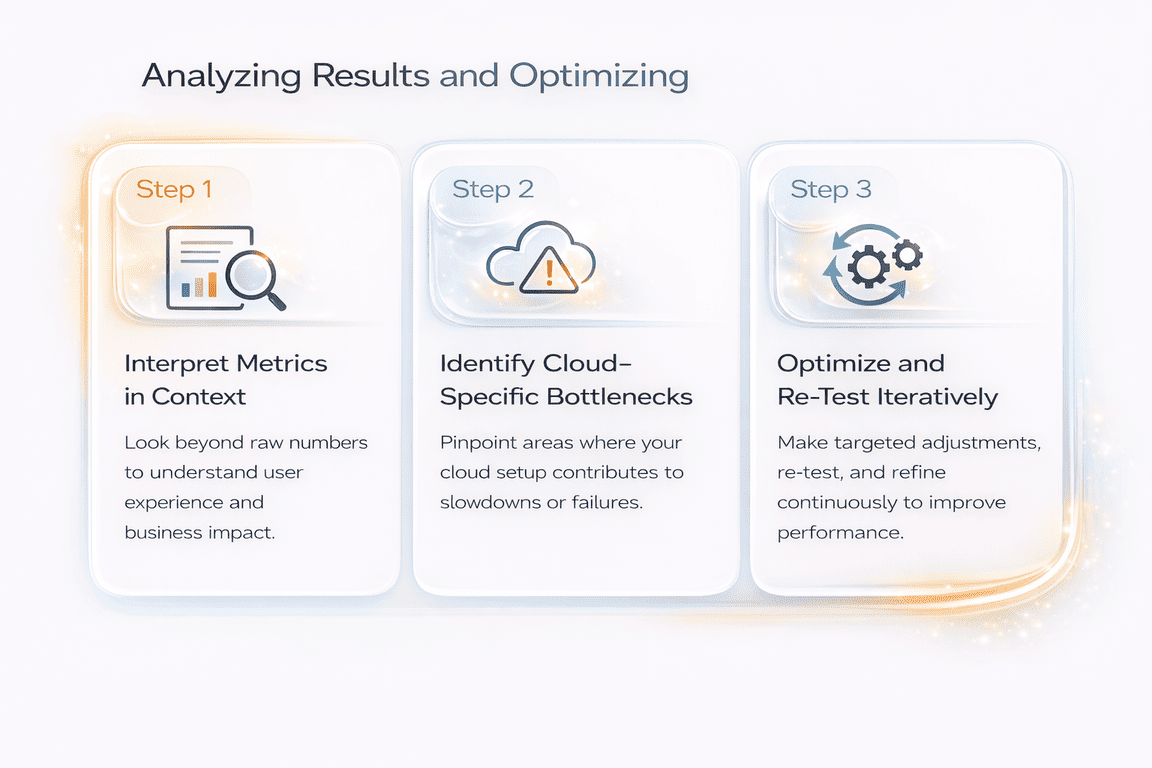
Step 1: Interpret Metrics in Context
Cloud performance data should be read as a system narrative, not a collection of numbers.
Latency distributions, throughput trends, and resource utilization must be analyzed together to understand where degradation truly begins.
Key interpretation areas include:
- Response time percentiles (p95, p99) to detect tail latency growth
- Throughput stability as load increases
- Error rate patterns and retry amplification
- CPU, memory, network, and disk saturation points
- Cost behavior as scaling expands infrastructure
In practice, engineers rarely interpret these signals manually.
They rely on observability queries that correlate latency, error rate, scaling behavior, and resource saturation in real time.
For instance, the following PromQL examples illustrate how tail latency can be analyzed alongside scaling activity and CPU throttling to identify the true source of degradation.
PromQL Example:
# p95 latency trend (service-level)
histogram_quantile(0.95, sum(rate(http_request_duration_seconds_bucket{service="api"}[5m])) by (le))

# error rate
sum(rate(http_requests_total{service="api",status=~"5.."}[5m]))
/
sum(rate(http_requests_total{service="api"}[5m]))

# scaling activity (Kubernetes example)
max_over_time(kube_deployment_status_replicas_available{deployment="api"}[10m])

# CPU throttling saturation signal
sum(rate(container_cpu_cfs_throttled_seconds_total{pod=~"api-.*"}[5m]))
/
sum(rate(container_cpu_usage_seconds_total{pod=~"api-.*"}[5m]))
In our example, p95 latency started climbing before the replica count increased, while CPU throttling spiked at the same time. That combination usually points to scaling reacting too late under sudden load.
These correlations make it possible to determine whether rising latency is caused by delayed scaling, resource saturation, or application-level bottlenecks, turning raw metrics into actionable insight.
Step 2: Identify Cloud-Specific Bottlenecks
Unlike traditional environments, cloud systems introduce elastic scaling, shared infrastructure, and regional variability.
Common bottlenecks observed in real cloud testing include:
- Auto-scaling thresholds that react too late or too aggressively
- Cold-start delays in serverless functions
- Noisy-neighbor effects in multi-tenant services
- Region-specific latency or routing inefficiencies
- Database or cache contention under burst traffic
From experience, many outages begin as localized degradation rather than full system failure, making early detection critical.
Step 3: Optimize and Re-Test Iteratively
Cloud performance improvement is inherently iterative.
After identifying bottlenecks, teams typically adjust:
- Auto-scaling policies and capacity limits
- Application code or database queries
- Caching strategies and connection handling
- Network routing or regional placement
- Reserved or optimized resource configurations
Every meaningful change should be followed by a repeat performance test to confirm that stability, latency, and cost efficiency have improved.
In mature cloud environments, optimization becomes a continuous engineering cycle, not a one-time validation step.
Integrating Performance Testing into CI/CD and Cost Management
In cloud environments, performance testing becomes far more effective when it is treated as a continuous engineering safeguard rather than a one-time pre-release activity. Modern delivery pipelines change constantly, new code is deployed, dependencies evolve, and traffic patterns shift, so performance validation must keep pace with that rhythm.
For this reason, many teams introduce automated, threshold-based performance checks directly into CI/CD. Instead of running large manual load tests, engineers execute short, repeatable scenarios during pull requests or staging deployments. The goal is not to measure maximum capacity, but to detect early signs of regression before they reach production.
Tools such as k6 make this practical by allowing load stages, latency thresholds, and reliability checks to be defined directly in code. A simplified example below illustrates how an API-level checkout workflow can be validated inside a pipeline using p95 latency and failure-rate gates tied to service-level expectations.
Example: Threshold-Gated k6 Test Executed in CI
// perf/api_checkout.js
import http from "k6/http";
import { check, sleep } from "k6";

export const options = {
  scenarios: {
    ramp_api: {
      executor: "ramping-vus",
      stages: [
        { duration: "1m", target: 20 },
        { duration: "3m", target: 80 },
        { duration: "2m", target: 120 },
        { duration: "1m", target: 0 },
      ],
      gracefulRampDown: "30s",
    },
  },
  thresholds: {
    http_req_failed: ["rate<0.005"],
    http_req_duration: ["p(95)<800", "p(99)<1500"],
  },
};

const BASE_URL = __ENV.BASE_URL;
const TOKEN = __ENV.TOKEN;

function authHeaders() {
  return {
    headers: {
      Authorization: `Bearer ${TOKEN}`,
      "Content-Type": "application/json",
      "X-Request-Source": "k6-ci",
    },
    tags: { service: "checkout-api" },
    timeout: "30s",
  };
}

export default function () {
  const cartRes = http.post(
    `${BASE_URL}/cart`,
    JSON.stringify({ sku: "SKU-123", qty: 1 }),
    authHeaders()
  );

  check(cartRes, { "cart created": (r) => r.status === 201 });

  const payRes = http.post(
    `${BASE_URL}/checkout`,
    JSON.stringify({ paymentMethod: "card_token", cartId: cartRes.json("id") }),
    authHeaders()
  );

  check(payRes, {
    "checkout ok": (r) => r.status === 200,
    "has orderId": (r) => !!r.json("orderId"),
  });

  sleep(1);
}
In practice, scripts like this are not intended to discover absolute system limits. Their primary value lies in fast, automated feedback. If latency percentiles drift, error rates rise, or scaling behavior changes after a deployment, the pipeline can fail immediately, while the underlying issue is still easy to trace and resolve.
When these tests are connected to observability data and tagged with build metadata, they evolve into a continuous reliability signal rather than a periodic validation step. This shift is central to how mature cloud teams maintain both performance stability and cost control as systems evolve.
Future Trends in Cloud Performance Testing
Drawing on over 15 years of performance testing work, our team at PFLB has seen cloud validation move from “can it handle the load?” to “how does it behave when everything changes at once?” Elastic scaling, regional traffic shifts, and shared infrastructure mean the next wave of performance issues is less about raw capacity and more about timing, limits, and dependency behavior.
- Serverless and event-driven systems are pushing teams to test cold-start latency, concurrency ceilings, and burst handling as first-class concerns. The most common failures aren’t dramatic crashes; they’re sudden tail-latency spikes when functions scale up, queues back up, or concurrency throttling kicks in; often with a cost jump that looks fine in average metrics but is obvious in p95/p99.
- Multi-cloud and edge deployments are making geography part of the performance model. When services run across regions, providers, or edge nodes, latency and routing become variable, and partial degradation becomes more likely than full outages. Testing from a single region can hide the exact class of problems that appear when traffic is split across locations or when failover and routing convergence are imperfect.
- Finally, AI and observability are becoming tightly linked. Modern platforms increasingly use live telemetry to spot anomalies during a test run, correlate traces with percentile shifts, and surface likely bottlenecks faster. Large language models can also help generate test scenarios from real traffic patterns and summarize high-volume logs and traces, speeding up analysis, while engineering teams still make the final calls on architecture, scaling policy, and cost trade-offs.
Real-World Cloud Application Performance Cases
These architectural shifts are no longer theoretical. Across recent cloud performance engagements carried out by our team at PFLB, the same patterns are already visible inside production-critical applications.
[01] Serverless Checkout Latency Under Burst Traffic
A cloud-native commerce backend built on serverless functions showed stable average response times during normal load.
However, burst-driven testing revealed sharp p99 latency spikes during cold starts and concurrency throttling, especially when promotional traffic arrived simultaneously across regions.
Result: By tuning concurrency limits, warming strategies, and queue buffering, the application maintained consistent checkout latency during peak demand without excessive over-scaling costs.
[02] Multi-Region API Platform With Hidden Tail-Latency Risk
A globally distributed B2B API platform appeared healthy in single-region monitoring.
Multi-region performance testing exposed routing asymmetry and dependency latency that only affected a subset of users, creating severe tail-latency degradation despite acceptable averages.
Result: Traffic routing optimization and regional dependency isolation reduced p99 latency and stabilized SLA compliance across all active regions.
[03] Event-Driven Processing Delays in Cloud Messaging Workflows
An event-driven backend responsible for asynchronous order processing scaled correctly at the infrastructure level but still produced delayed downstream transactions under sustained load.
Testing revealed queue backlog growth and retry amplification rather than compute saturation.
Result: Adjusting consumer scaling policies and retry timing restored predictable processing latency while reducing unnecessary compute spend.
[04] Observability-Led Detection of Scaling Inefficiency
In a large SaaS environment, performance regressions were not visible in traditional dashboards.
Correlation of latency percentiles, scaling events, and resource throttling through observability data exposed delayed scale-out behavior during traffic ramps.
Result: Refined auto-scaling thresholds and capacity buffers eliminated latency drift and improved cost-to-throughput efficiency during peak periods.
Conclusion
Cloud performance testing plays a central role in keeping modern applications scalable, reliable, secure, and cost-efficient as demand and architecture complexity grow.
Unlike traditional on-premise validation, cloud environments require continuous testing, observability-driven insight, and automation-first strategies that evolve alongside the system. This is also where structured support from a specialized team helps, for example, Performance Testing Services designed for cloud and application-level workloads.
Teams that treat performance as an ongoing engineering discipline are better prepared to manage scaling behavior, prevent instability, and control infrastructure cost before issues reach production. For organizations looking to strengthen their cloud performance strategy, exploring proven practices and expert support from PFLB can provide a practical next step.