AI is quickly becoming the most overused promise in software testing — every platform now claims it, but few can prove it.
Some “AI load testing tools” genuinely analyze data, learn from patterns, and generate meaningful insights. Others stop at fancy dashboards and static scripts dressed in new terminology.
In this comparison, we’ll separate real machine intelligence from marketing language.
You’ll see which AI performance testing platforms are already using data models, anomaly detection, and generative logic to improve test design — and which ones still rely on conventional automation wrapped in buzzwords.
By the end, you’ll know which tools deliver real, working AI for load testing, where it helps most, and where it remains a concept waiting to mature.
Comparison Snapshot: AI Performance Testing Tools
Evaluation Criteria
The term AI is used broadly across testing platforms, so each tool here was evaluated against three clear criteria:
Only tools showing measurable capability in at least two of these areas were considered to have meaningful AI functionality. The rest were treated as automation enhanced by analytics, not genuine intelligence.
1. PFLB — Practical AI for Load Testing Reports and Anomaly Detection
PFLB, among all current vendors, is one of the few that applies AI in ways that genuinely reduce the manual work of performance testing.
Its implementation focuses on two areas where automation brings measurable value: report generation and metric-level anomaly detection.
AI-Generated Reporting
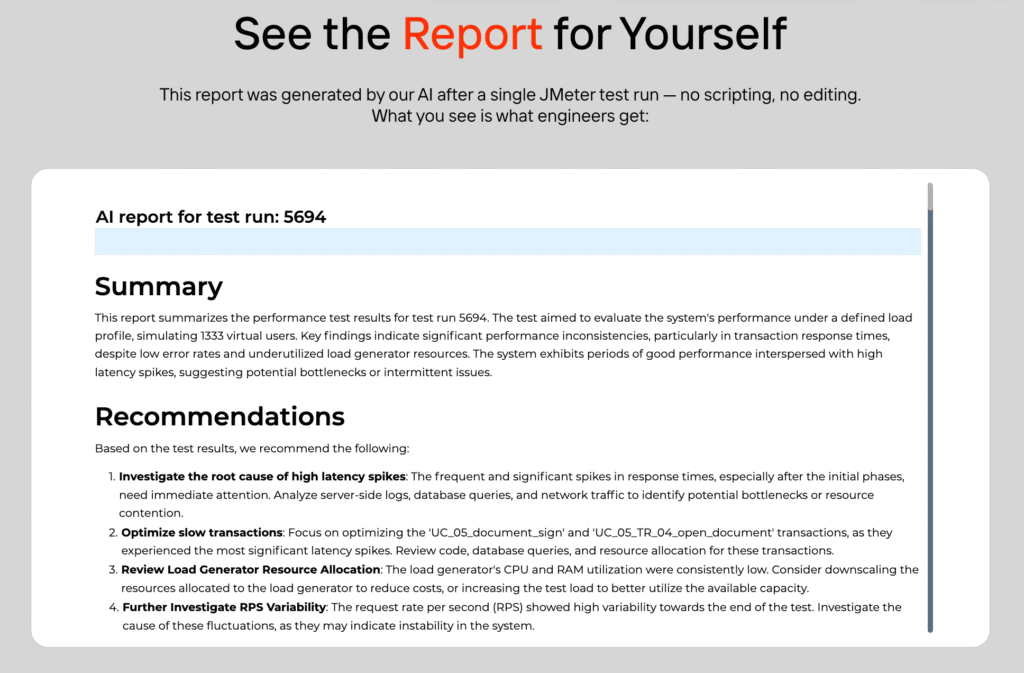
After a test run, the platform automatically produces a structured report that summarizes load curves, latency percentiles, throughput trends, and resource utilization.
Instead of template text or static dashboards, the system uses a large-language model trained on past test reports to generate a clear summary written in natural language.
The report highlights:
Engineers can edit, annotate, or export the output to share with managers or clients. The goal is not automation for its own sake but removing the repetitive step of transforming raw metrics into a readable analysis.
AI-Based Anomaly Detection and Insights
During and after test execution, PFLB applies statistical and machine-learning models to the metric stream.
These models establish dynamic baselines for each monitored parameter — latency, throughput, CPU, memory, I/O — and flag deviations that fall outside expected behavior.
Typical detections include:
The same subsystem powers the “AI Insights” view, which groups anomalies by probable cause and time window.
Instead of scrolling through dozens of charts, testers can start investigation directly from the insight summary.
How It Works
The process is transparent — all detected anomalies are visible in the underlying charts, so the user can verify each conclusion.
Practical Effect
Teams using PFLB often report that the AI layer saves several hours per test cycle.
Instead of spending time creating slides or digging through Grafana panels, engineers can focus on root-cause analysis and optimization.
For managers, the reports provide a consistent view of performance evolution between builds without requiring deep technical literacy.
Limitations
PFLB’s AI does not generate test scenarios or modify configurations.
It does not attempt to replace the engineer’s domain judgment; it assists in interpretation and documentation.
The accuracy of anomaly detection still depends on metric quality and proper test design — garbage data will lead to noisy results in any system.
Verdict
PFLB offers one of the most mature, production-proven implementations of AI in performance testing today.
Its strength lies in clear reporting and precise anomaly recognition — features that reduce friction in day-to-day QA work rather than promise full autonomy.
In a market crowded with overstated “AI” claims, this approach feels grounded and verifiable.
2. Tricentis NeoLoad — AI Assistance for Analysis and Natural-Language Queries
NeoLoad has been part of the enterprise load-testing landscape for years.
Recent versions introduce features that genuinely use AI rather than simply rebrand automation. The two most relevant are the Machine Co-Pilot (MCP) interface and the AI-powered analysis layer built into NeoLoad Web.
Machine Co-Pilot (MCP)
The MCP allows testers to interact with test data through natural-language queries.
A user can type or speak questions such as:
NeoLoad translates the request into the corresponding data queries and returns the answer as text and visual summaries.
This reduces the time spent navigating dashboards or exporting results to spreadsheets, particularly for teams that review many test runs each day.
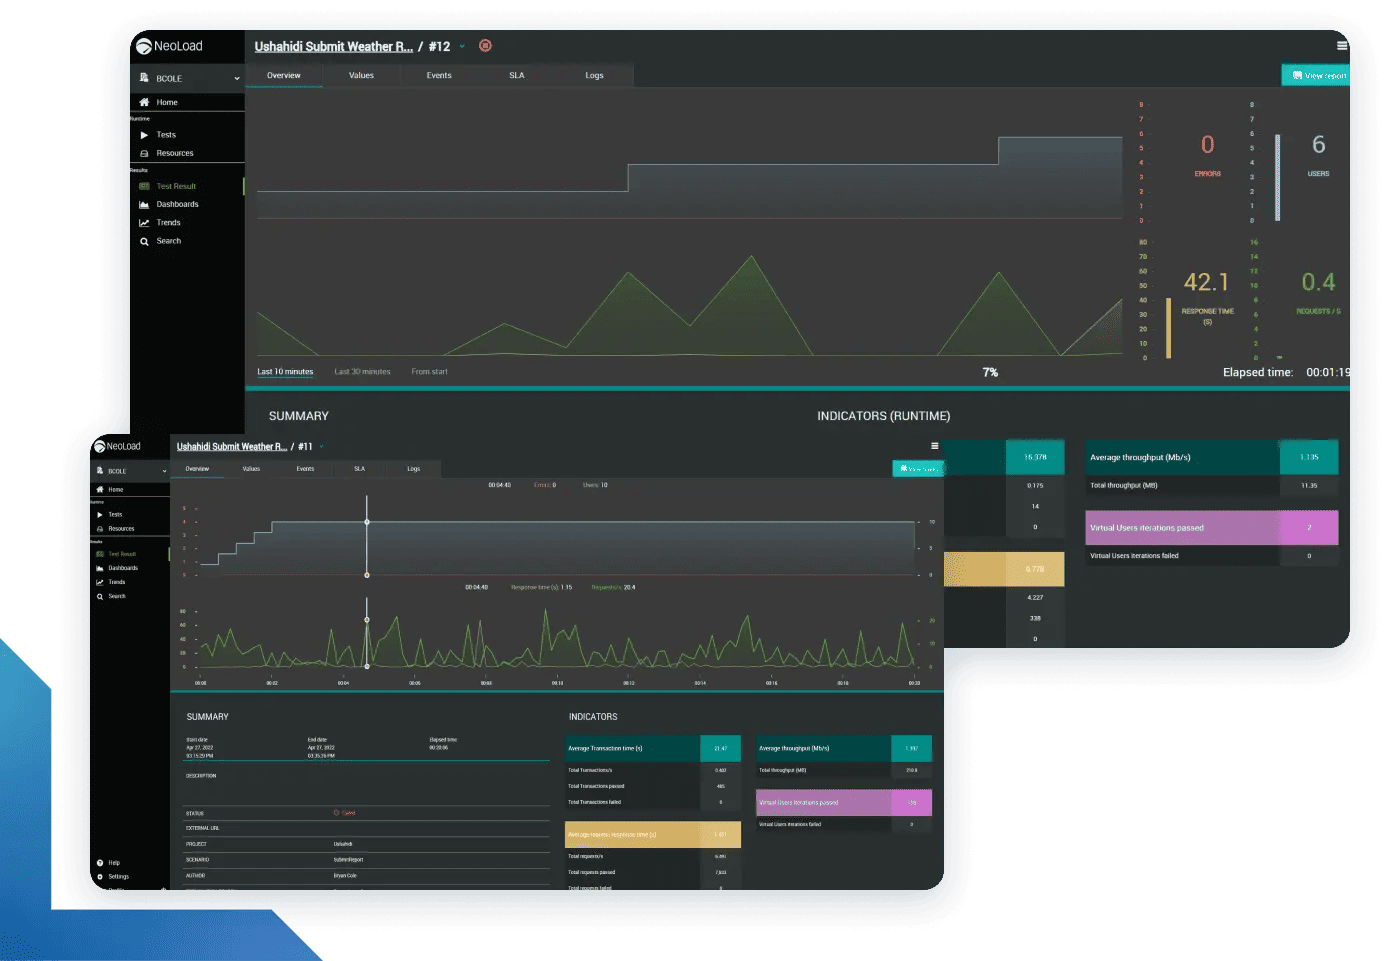
AI-Powered Analysis
Beyond the conversational layer, NeoLoad uses AI models to identify trends and regressions.
Instead of relying on fixed pass/fail thresholds, the system maintains statistical baselines for every metric and flags deviations that exceed learned tolerances.
When multiple anomalies occur together — for example, a latency increase accompanied by reduced throughput — the analysis engine groups them under a probable root cause such as “application bottleneck” or “infrastructure saturation.”
How It Works
NeoLoad combines three elements:
All detected anomalies remain visible in the raw data view, preserving transparency and traceability.
Practical Effect
These benefits are most visible in continuous-integration environments where tests run frequently and produce large volumes of data.
Limitations
NeoLoad’s AI layer assists interpretation; it does not design workload profiles, generate scripts, or tune environments automatically.
The quality of insight still depends on well-designed test scenarios and comprehensive monitoring coverage.
MCP responses rely on existing data; it cannot infer issues that were never instrumented.
Verdict
NeoLoad’s recent AI capabilities are substantive and measurable.
The MCP simplifies access to complex data, and the AI-powered analysis module reduces manual result review.
Both features complement rather than replace engineering expertise, and they make NeoLoad one of the few enterprise-grade platforms where the term AI reflects actual functionality rather than branding.
3. OpenText LoadRunner — Incremental Intelligence Through Aviator AI
LoadRunner has been part of enterprise performance testing for more than two decades.
Under OpenText, the suite has gained an AI layer called Aviator, which extends across several OpenText products, including LoadRunner Professional, Enterprise, and Cloud.
In practice, Aviator introduces measured but meaningful improvements — mainly in script creation, result analysis, and anomaly detection.
AI-Assisted Script Creation
Recording and correlation have long been two of the most time-consuming steps in LoadRunner scripting.
Aviator addresses this by using pattern recognition on captured traffic and log data to automatically identify dynamic parameters, repeatable sequences, and potential correlation points.
The tool then suggests or applies correlations, helping reduce human error and setup time.
For teams maintaining large test suites, this can eliminate repetitive work without changing existing scripting standards.
AI-Based Anomaly Detection and Trend Analysis
In the analysis phase, Aviator applies trained models to performance metrics from past and current runs.
These models establish behavioral baselines for throughput, latency, error rates, and resource consumption.
When a new run diverges from its baseline — for example, a gradual latency increase at constant load — the system marks it as an anomaly and highlights the related transactions.
This approach is more adaptive than the static thresholds that LoadRunner traditionally used.
It also helps surface subtle regressions that might not trigger explicit SLA failures but still indicate emerging instability.
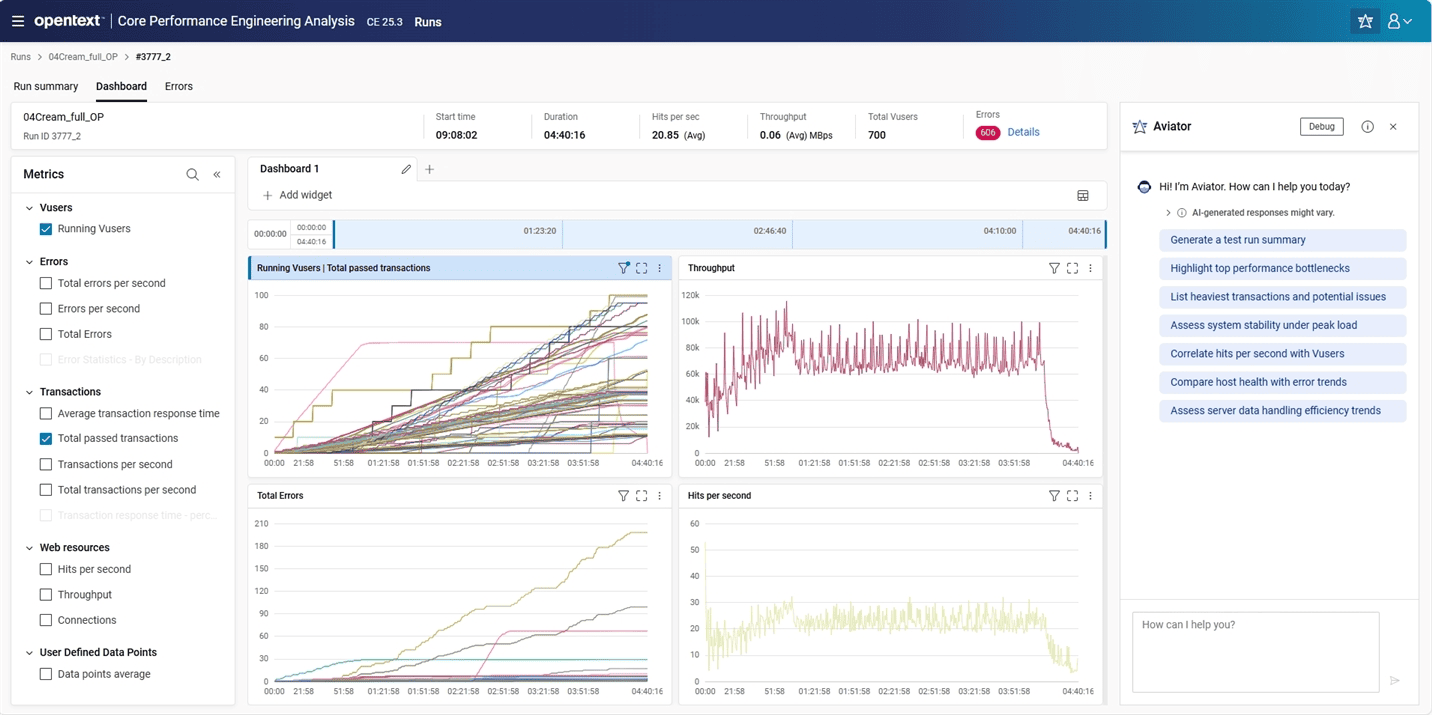
AI-Enhanced Reporting
Aviator supplements LoadRunner Analysis with automatically generated summaries.
These summaries outline main findings, anomalies detected, and possible causes inferred from the correlation between KPIs.
The goal is to give project managers and QA leads a concise narrative view without requiring deep familiarity with LoadRunner graphs.
Each AI comment is linked to the underlying dataset, so users can verify or adjust the conclusions manually.
How It Works
Aviator’s models update as more test results accumulate, gradually improving the accuracy of baseline predictions.
Practical Effect
For organizations with long-standing LoadRunner infrastructures, Aviator adds modernization without requiring a platform switch.
Limitations
Aviator’s AI capabilities vary by LoadRunner edition and are still evolving.
Script generation handles conventional HTTP workload profiles well but offers limited automation for complex or protocol-specific scripts (for example, SAP GUI or Citrix).
The AI analysis modules rely on historical data; new projects start from generic baselines until sufficient results accumulate.
Aviator does not change LoadRunner’s fundamental architecture or licensing model — it remains an enterprise-grade, heavyweight tool.
Verdict
OpenText’s Aviator AI represents a genuine yet incremental application of AI in a legacy platform.
It automates routine scripting and applies adaptive analytics to detect anomalies more intelligently than threshold rules ever did.
While not transformative, these features bring tangible efficiency gains and keep LoadRunner relevant in an industry shifting toward AI-assisted workflows.
4. BlazeMeter by Perforce — Generative Tools for Scripts and Test Data
BlazeMeter evolved from a JMeter-compatible cloud platform into a full-scale testing ecosystem.
Its recent AI additions focus on making test setup and data preparation faster.
Rather than attempting to “automate everything,” BlazeMeter applies AI where it solves specific, recurring pain points: creating API test scripts and generating realistic test data.
AI Script Assistant
The AI Script Assistant allows users to describe a desired test in plain language.
For example, entering a prompt such as:
Under the surface, BlazeMeter translates the description through a domain-tuned language model trained on JMeter and YAML syntax.
It identifies endpoints, request methods, validation rules, and concurrency levels, generating a draft that can be executed immediately or refined by an engineer.
This feature significantly reduces onboarding time for less technical users while keeping full control in the hands of experienced testers who can review or edit the output.
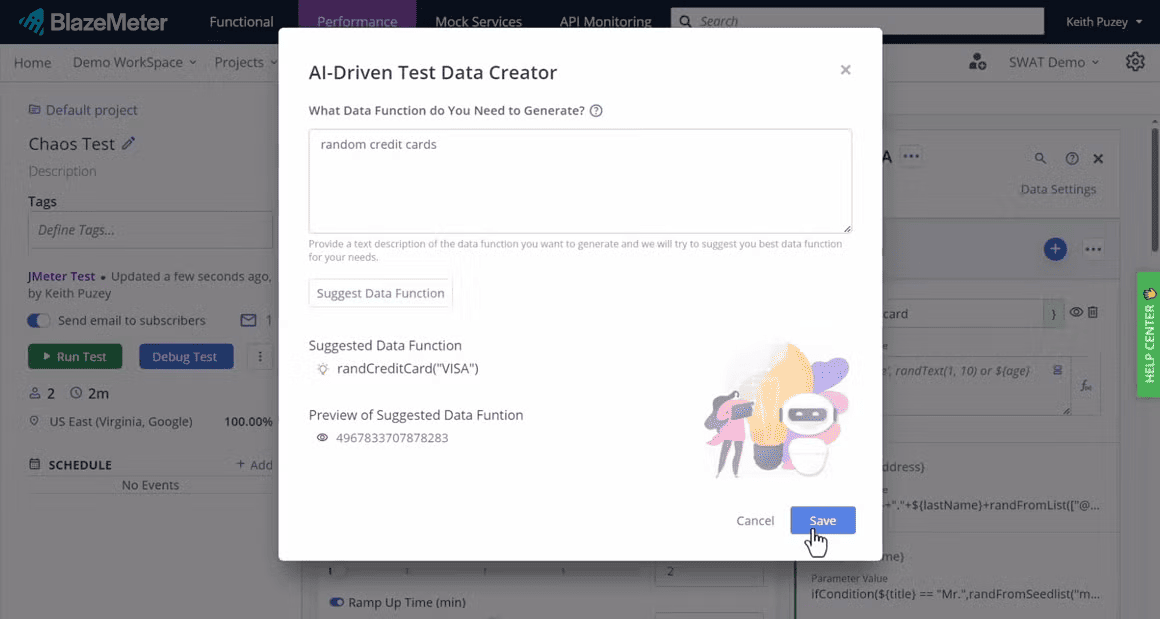
AI Test Data Pro
Another area where AI is practically applied is synthetic data generation.
The Test Data Pro module profiles existing datasets or API schemas to learn the structure and value ranges of each field.
It then generates new data that preserves statistical properties — such as typical string lengths, numeric ranges, or value distributions — without exposing any real customer information.
This helps maintain test coverage and compliance with data privacy regulations, especially when testing systems that handle sensitive records.
The generative model can also simulate edge cases, such as out-of-range values or malformed inputs, improving negative-test coverage without manual data engineering.
How It Works
Because both functions run within the BlazeMeter platform, users do not need to integrate external AI services or manage additional infrastructure.
Practical Effect
These advantages are especially noticeable in API-heavy applications, microservice testing, and continuous integration pipelines.
Limitations
The AI features assist test creation; they do not yet provide automated result interpretation or root-cause analysis.
Complex authentication flows, chained requests, or non-HTTP protocols still require manual configuration.
Generated data reflects the statistical properties of the input but cannot infer domain-specific relationships unless they are explicitly represented in the source sample.
Verdict
BlazeMeter’s use of AI is focused and functional.
Its script assistant and synthetic data generator address well-defined engineering needs without overselling autonomy.
By combining generative language models with structural validation, BlazeMeter reduces the friction of preparing performance tests while keeping control with the tester.
It stands out as one of the more practical, mid-tier implementations of AI in this field — genuinely useful, particularly for API-level performance and CI/CD automation.
5. Grafana k6 — Reliable Engine, Intelligent Ecosystem
Grafana k6 remains one of the most widely adopted open-source load-testing tools.
Its design philosophy favors transparency, scriptability, and integration over built-in automation.
While k6 itself does not include an AI engine, it fits naturally into an ecosystem where AI-based analysis can operate on its results.
The intelligence appears when k6 is connected to Grafana Cloud, Grafana’s AI Assistant, or observability platforms such as Dynatrace and Datadog.
Where AI Fits In
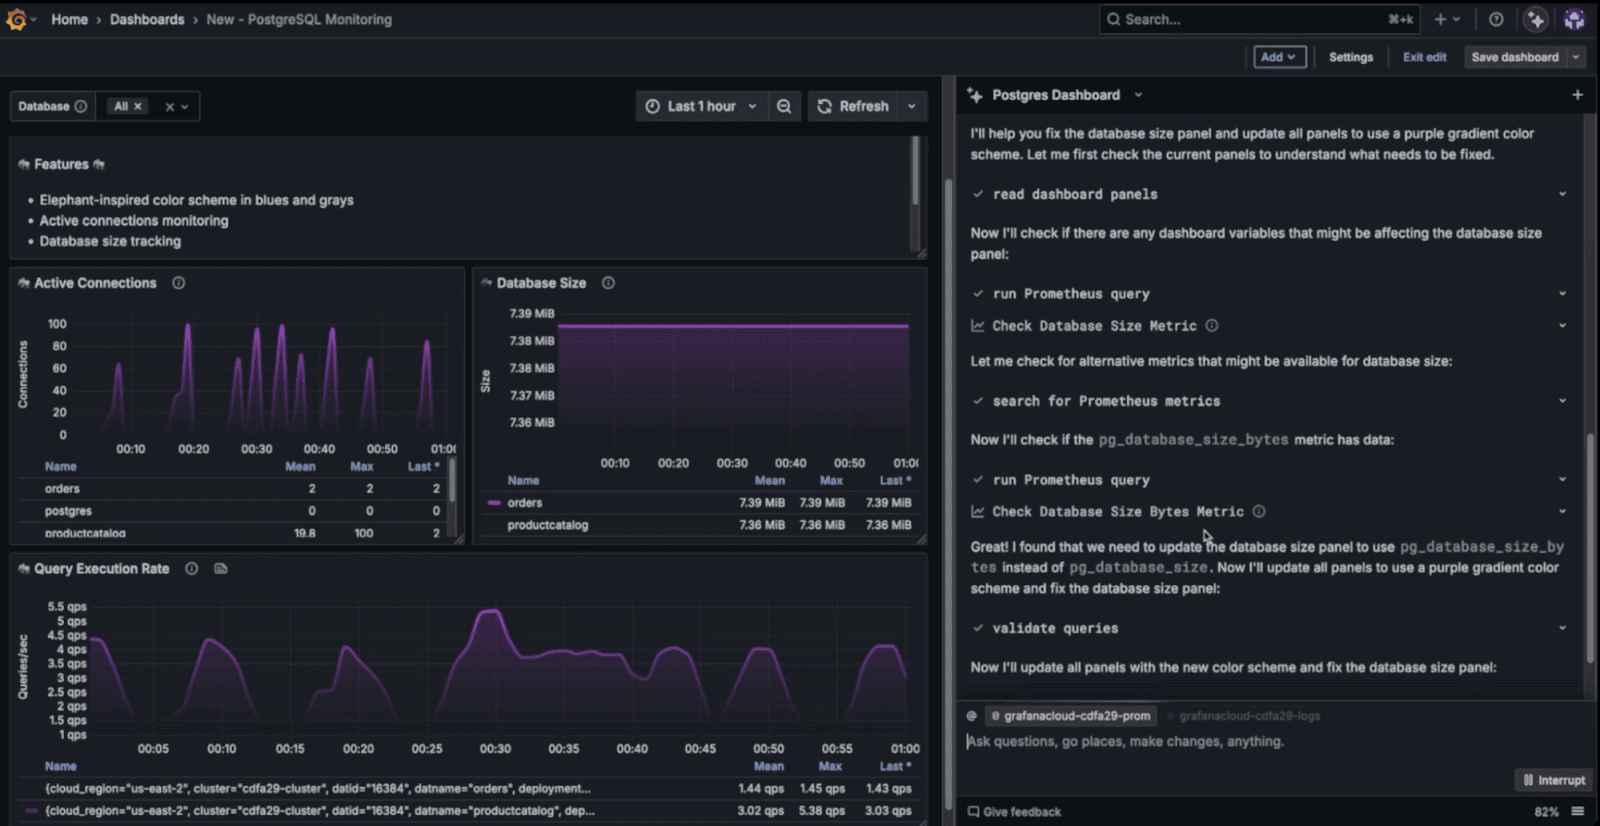
1. Grafana AI Assistant
Grafana Labs introduced an AI Assistant that allows users to query dashboards and metrics in plain language.
It interprets prompts like
2. k6 Cloud Insights
k6 Cloud provides statistical analysis of test runs, highlighting changes in throughput, latency distribution, or error rates.
Although it does not use deep learning, it applies adaptive detection methods to surface deviations between tests, functioning as a lightweight anomaly-detection layer.
3. External APM Integrations
When k6 is used alongside platforms such as Dynatrace or Datadog, AI comes from those systems.
Both employ machine-learning models to correlate application metrics, logs, and traces with load-testing events.
In this setup, k6 acts as the generator of traffic; the observability tools interpret the system’s response through their AI engines.
How It Works
This approach decouples the load-generation engine from the intelligence layer, keeping each component focused on its core purpose.
Practical Effect
For many organizations, this integration pattern provides more value than embedding an isolated AI feature inside the load tester itself.
Limitations
k6 does not currently offer AI-driven test generation, workload profile design, or self-tuning.
All intelligence depends on external systems, and the quality of the insights is directly tied to how well metrics are instrumented and labeled.
Teams seeking a single, all-in-one “AI testing tool” will not find it here.
Verdict
k6 exemplifies an open and modular approach to AI in performance testing.
Rather than replicating intelligence inside the runner, it allows specialized analytics platforms to interpret its data.
Paired with Grafana’s AI Assistant or an AI-enabled APM, k6 becomes part of a genuinely intelligent feedback loop — one that supports both engineering control and automated analysis without locking users into a closed ecosystem.
Conclusion
With AI platforms, as with any others, the real question isn’t which one looks smartest — it’s which one fits your work.
Each tool in this list takes a different approach to intelligence: some generate, some analyze, some optimize. None of them replace engineering judgment.
Before you decide, be clear about what you need, what problem you’re solving, and which goals actually matter to your team.
Don’t chase the AI buzz. Choose the platform that fits your workflow — not the one that shouts the loudest about being “intelligent.”