


At a glance
- Client: NOV, a global provider of equipment, components and IT products for the oil and gas industry, based in Texas
- Product: CTES Max Completions - a completions data manager delivering real-time well data, aligning disparate sources on a completions site into contextualised insight
- Symptom: during normal development the team saw performance problems when users opened multiple dashboards of technical data from well devices - with limited in-house performance-testing competence to chase it
- Found: at a specific load the system stopped scaling, because of a bottleneck in the SQL Server database's interaction with the application server, caused by multiple Async Network IO wait events
- Load profile: 45 concurrent users generating 5,560 requests per minute - roughly 93 requests a second - across three coiled-tubing job scenarios, a frac job scenario and report generation
- How it was measured: a one-hour baseline run, then a step-up capacity test of up to 10 steps held 30 minutes each, raising the load step by step to a ceiling of 1,000 concurrent users
- Timeline: about 10 weeks from kick-off to the final report - methodology, scripting, debug runs, qualifying runs, analysis
- Built for the engagement: HTTP/2 protocol testing support added to the PFLB platform, so the product could be tested the way it actually communicates
- Afterwards: NOV retained the ability to run performance testing themselves
Why real-time data is where performance goes wrong
NOV's reputation rests on the reliability of products that oil and gas operators depend on in the field. CTES Max Completions exists to make well data usable in real time - and real-time data is exactly the workload where performance problems appear, because every open dashboard is a live stream rather than a page that finishes loading.
The team spotted it themselves during a standard development cycle: opening several dashboards of technical data from well devices degraded performance. Knowing that something is slow, however, is not the same as knowing what to fix.
Why an external team, and what they needed
With limited internal competence and no spare performance engineers, Steve Opel, NOV's Principal Technology Manager, brought PFLB in. The goal was specific: find a tool that could consistently emulate the load on Max Completions, reproduce the problem, and locate the bottleneck - so that optimisation could be aimed rather than guessed.
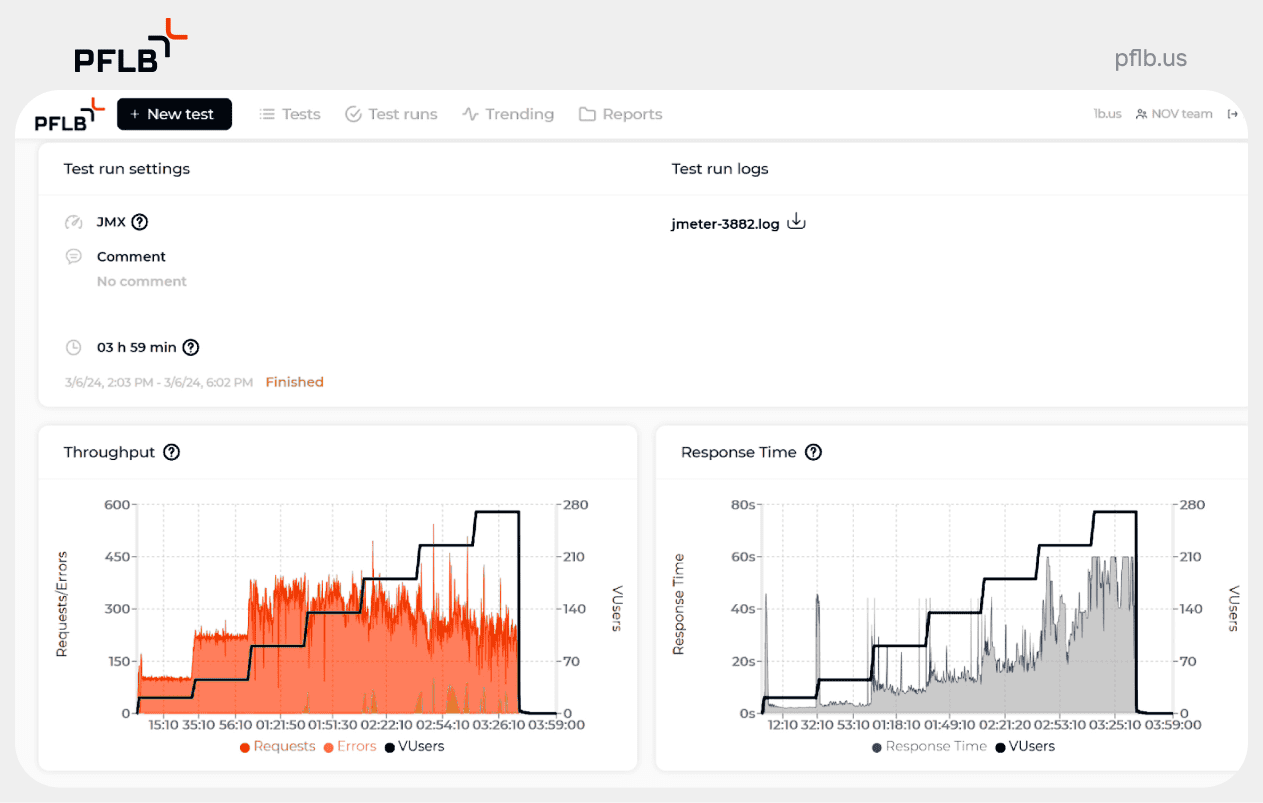
The test run in PFLB Platform: throughput and response time for the CTES Max Completions dashboards.
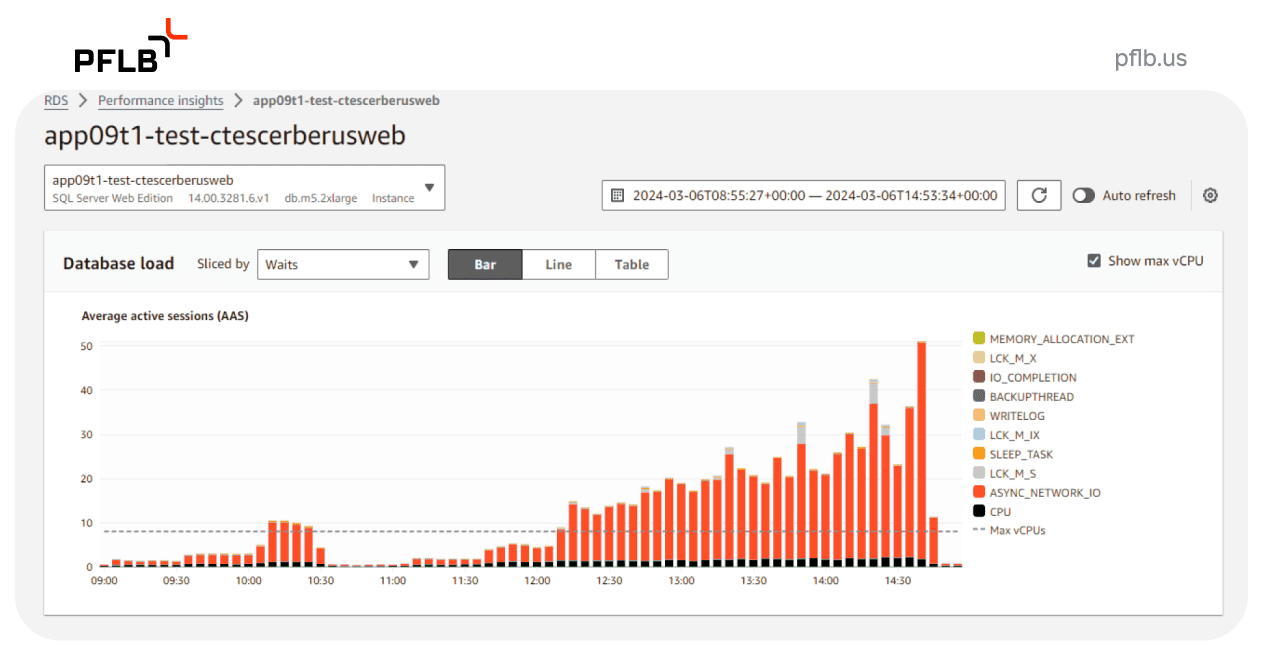
Database load by wait type - where the real-time drilling application actually stalls, rather than where it appears slow.
That quote contains the part worth noting: the tooling did not support the product's protocol, so the tooling changed. HTTP/2 support was added to the PFLB platform for this engagement.
“The urgency of the performance issues compelled us to take immediate and decisive action. Engaging an external team for this specialized testing was the most efficient option for us. The PFLB team exhibited professionalism and exceptional adaptability to our needs. They even added HTTP 2.0 protocol testing support to their platform, which allowed us to obtain timely results and view all the data in their cloud-based tool, reducing our infrastructure usage.”
Steve Opel, Principal Technology Manager, NOV
How the load was built
The dashboards refresh every 3 seconds, so a realistic profile could not be a page-reload loop - it had to reproduce a browser sitting on a live job and pulling data continuously. Load was generated with Apache JMeter from AWS in the US region, over HTTP/2, which is what the product actually speaks and the reason the protocol had to be supported in the PFLB platform before the first script could run.
There were no production usage statistics to build the profile from, so it was assembled from recorded traffic sessions: the first version assumed the refresh pattern was similar across jobs, and measurement showed it was not. The corrected profile was heavier than the original, and it is the one the tests ran against. Success criteria were agreed in a written methodology before the first run - not discovered after it.
What the testing found
Working with NOV's team, PFLB engineers built a customised testing methodology and ran load and stress testing on the PFLB platform.
The result was a precise diagnosis rather than a score: at a specific load level the system became non-scalable, and the cause was the SQL Server database's interaction with the application server, showing up as multiple Async Network IO wait events.
That is the difference between a performance report and a performance answer. "The system slows down under load" leads to an infrastructure argument; "the application server and SQL Server are stalling on Async Network IO at this concurrency" leads to a fix.
The headline bottleneck was not the only finding. Multi-user load surfaced a set of defects that a single tester would never see - endpoints that answered instantly for one user timed out under concurrency - and each went to NOV’s team as a reproducible defect with the load level at which it appeared.
Results
- The bottleneck was identified and localised, giving NOV the evidence to make optimisation decisions.
- Hiring an external team for a limited period proved cost-effective - the alternative was hiring performance engineers for a problem with a defined end.
- NOV can now run performance testing independently, which protects the reliability their customer relationships depend on.
- Cloud-based testing meant results were viewed in PFLB's tool, reducing NOV's own infrastructure usage.
Questions this engagement answers
What does "it slows down under load" usually turn out to be?
Something specific. Here, Async Network IO wait events in the database-to-application-server path - which no amount of adding capacity would have resolved.
What if your product uses a protocol the testing tool does not support?
It is solvable. HTTP/2 support was added to the platform for this engagement rather than testing an approximation of the product.
Is an external team worth it for one performance problem?
For a bounded problem, yes - and this client kept the capability afterwards, so the engagement bought both a fix and a skill.
How do you test real-time dashboards?
By emulating the load they actually create - multiple concurrent dashboard sessions streaming device data - because that is the condition under which the ceiling appears.
Real-time product slowing under real use?
The useful outcome is not a number, it is a named cause. That takes emulating the product's real protocol and real usage pattern, not a generic load.