Recently we have finished a truly interesting project for a big national bank, i.e. we’ve performed load testing for Robotic Process Automation, which is an automated system aimed to fully substitute any operational bank employee working on a PC.
It’s not important for the system, which task to perform or which software to work with, e.g. it can calculate a salary or order notebooks and pens from an e-shop. The idea was not for the robot to send hard-coded requests to somewhere, but to use the entry signals such as mouse and keyboard in the same way as an actual user does.
What We Had ahead of Us
The customer planned to increase the amount of virtual automated workspaces (VAW) with robots, at the same time increasing the amount of executing processes. PFLB team has been requested to perform load testing and to solve the following issues:
- what maximal amount of VAW and processes can the system afford with the current technical tool complex (TTC);
- compose the sizing table that contains mutual dependencies between the maximal performance and the server TTC;
- determine bottlenecks that reduce performance;
- reproduce, if possible, the incidents on production, such as the system crash when there are more than 700 elements in the queue.
The Main Project Difficulty
The production contains 1 database server, 14 application servers, 1 balancer and 700 VAWs.
The customer wanted to implement the idea to create a robot emulator that will emulate the work of 700 VAWs on one server.
The pseudo robots were to send requests that they are starting working in order to load the system. After giving it a thought, we’ve decided to reject this approach, because Jmeter can substitute the robots. Obviously, one user stands for one robot. In fact, the robot just sends requests to the application server, so it’s not important what it’s busy with for the load testing.
Solution
Interface for robots and the application server
It turned out to be a black box.
The solution was evident: traffic logging.
As the production uses .net-remotion secure protocol, we’ve transfered the load testing environment to insecure for simplicity. The traffic was written using WireShark, because .net-remotion sends TCP requests. A TCP request has the following structure: [adress – the amount of bytes to transfer – the body of the byte line – the symbol of the query ending].. The sniffer returned a hex line of the transferring bytes. At the beginning we’ve used a self-written convector for parametrization, afterwards we’ve just used to read the hex lines. In the end the load script contained a package of TCP samplers, where the body is a hex line, parametrization preprocessors, and post-processors for correlation.
An important discovery was that every not damaged TCP request becomes 200 response, even if in the response it’s written “Your query is useless”. To verify the response body, we used Jmeter’s asserts. Another nuance was the load script logic. We’ve decided that one script with branches inside is better than 20 scripts for different types, volumes, and intensities according to the load testing profile. In this way we’ve created an instrument that can reproduce the load given by real robots on the Blue Prism (BP) servers.
Interface for the BP server and the database
We’ve got only one BP server, whereas there are 14 of them on production. That’s not a problem: any SQL request is sent using TDS protocol, so we can log it and reproduce it. Now a Jmeter user substitutes a part of the BP server for us, i.e. it sends requests, caused by a robot.
This way, we’ve got:
- a script that emulates the robot activity, so that we can find out the maximal performance for a BP server.
- a script that emulates the BP server work, thanks to which we can reproduce the load on a BP server without having access to the sufficient number of BP servers.
- base hardware monitoring for load testing environment servers using telegraph, influx, or grafana.
- self-written operation runtime monitoring, based on constantly updated Jmeter logs.
Problems We’ve Encountered
While running the first maximal performance search test, we’ve seen that even though we’ve reached 100% of the load testing profile, the hardware resources are not loaded as much as on production. It turned out that:
- the processes are interconnected: e.g., to pay the governmental taxes, one needs to activate about 200 processes. As it is a big deal, each robot that runs a process from the package wants to ensure that there are enough resources, so it packs the whole package of XML processes. Which means that the traffic volume sent though the network increases several times, as well as the processor usage.
- the process developers are saving the local variables to the global variable table in the database; at the same time all the data from this table is requested several times by each process for every robot, which consumes 10% of the database server CPU.
- it seemed that almost every attempt to run a process succeeds, but actually only 2% of the attempts succeeded. Why has it been like that? The planner, which is a subsystem module that optimizes the amount of VAWs, correctly calculates that to run a process one needs 100 VAWs. But a robot run is a costly operation, so it is only started once in a period. 100 VAWs have started and processed the queue elements, but there is still some time left, so the following scenario takes place: take an element – is the element taken? – no – take the element. This leads to 233 iterations of getnextcase procedure per second, where just 4 of them are useful. This consumes 20% of the database server CPU.
- the influence of the neighboring subsystems: there is a question, in which order should the load testing components be executed. We have not taken into account that the web-interface significantly influences the database (using about 5% of the CPU ) while trying to configure the hardware resources utilization by the load testing environment.
- additionally one needs to note the changed protocol with the switched off encoding: we’ve taken 10% of the CPU load for that as a rule of thumb that we’ve got by asking our experienced colleagues.
Results
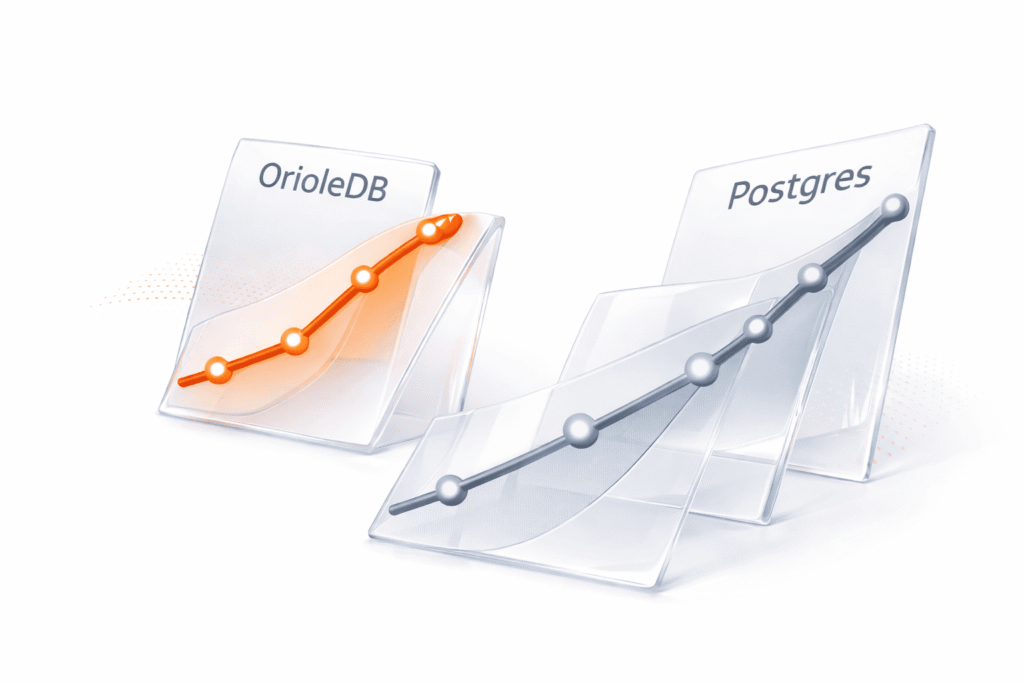
The current 100% production load utilizes almost all bandwidth (9 from 10 Gbps), as well as a significant amount of other hardware resources. As the amount of robots gets increased, the hardware resource utilization is growing linearly; this is also the case when the amount of processes or their load is increased. Obviously, if we multiply 2 linear functions, we’ll get a quadratic function that reveals us the maximal performance in 5 minutes using Excel.
But the maths turned out as not too helpful, so we wad to translate the test, where we’ve increased the amount of robots, as well as the amount of processes. The maximal performance result was 109% of the load testing profile with network restriction and 140% of CPU load, for which we had to slightly decrease the size of XML files. All that happened even though the 100% of the load testing profile lead to 40% of the database server CPU utilization. Which conclusions can we make? Widening the network channel, i.e. getting the “golden” cables, is not going to boost the performance
We’ve got the following results