Creating test reports in PFLB
Report editor
Cloud
Enterprise
We are excited to announce the release of the initial version of the report document editor! With this new feature, you can now easily generate reports for your tests directly within the PFLB.
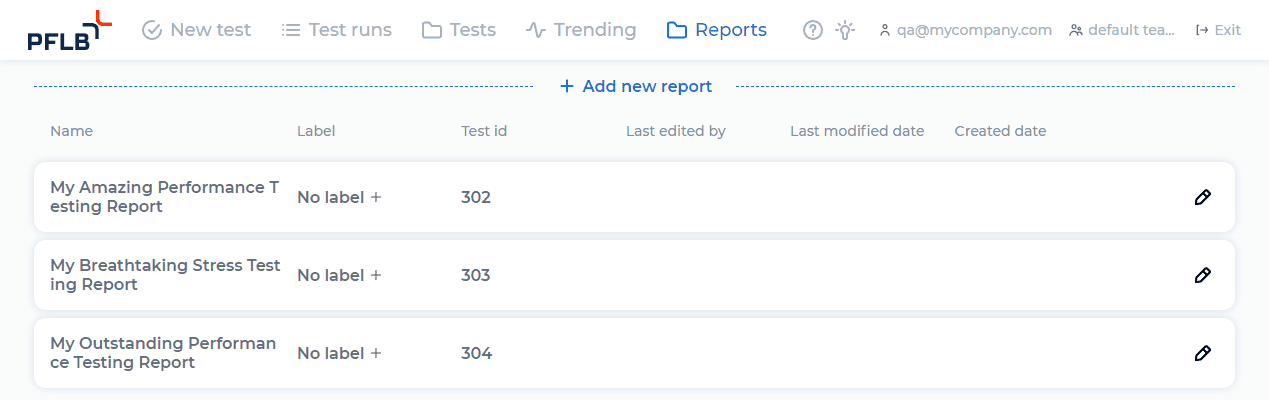
On the Reports page, you can create a new report, and view and edit existing reports:
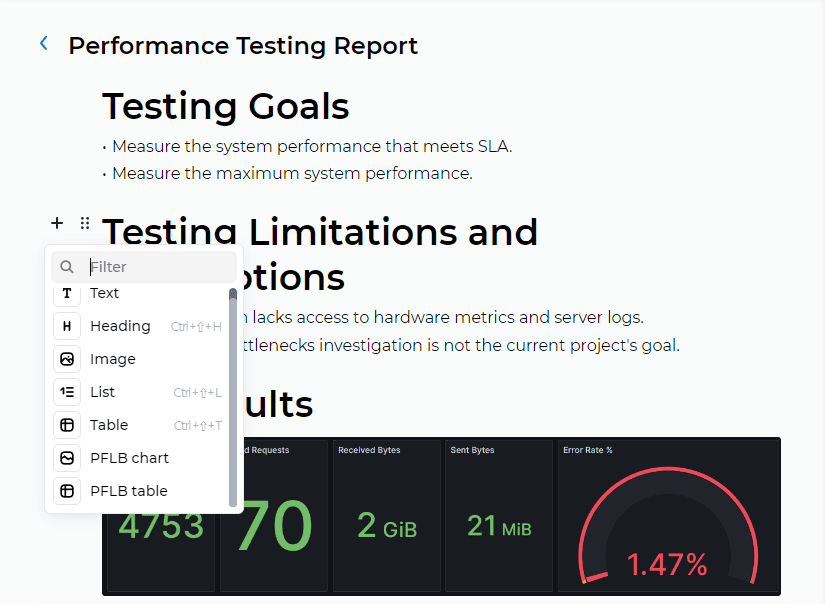
You can add different content blocks to the report document:
PFLB chart allows you to plot multiple metrics on the same chart. It could be metrics from the same or different test runs:
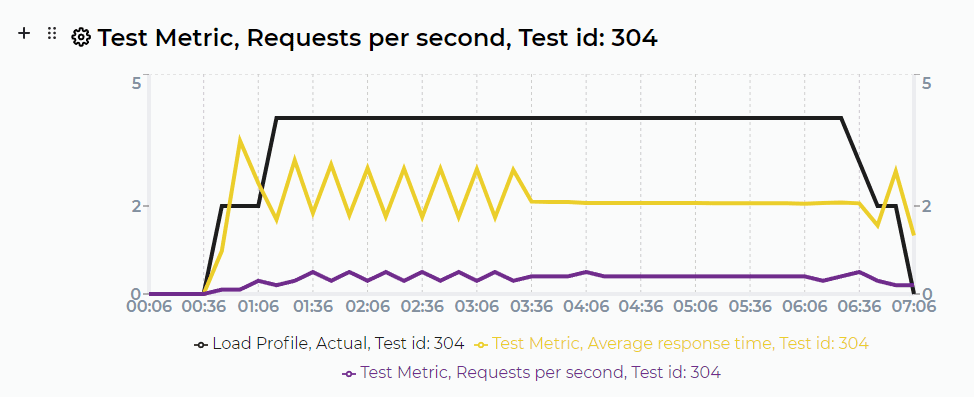
There are various metrics to plot in PFLB chart:
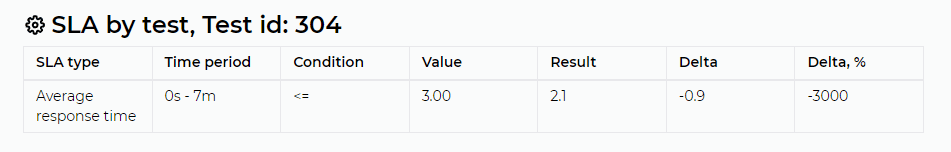
PFLB table contains SLA values on request, test, or transaction level.
We will continue to develop the Report Editor in future versions. Stay tuned for updates!
Customization of JMeter properties for your test
Cloud
Enterprise
Now you can specify or override JMeter properties for your test. We added the list of supported JMeter properties to the documentation.
Create a settings set and specify JMeter properties and their values in it:
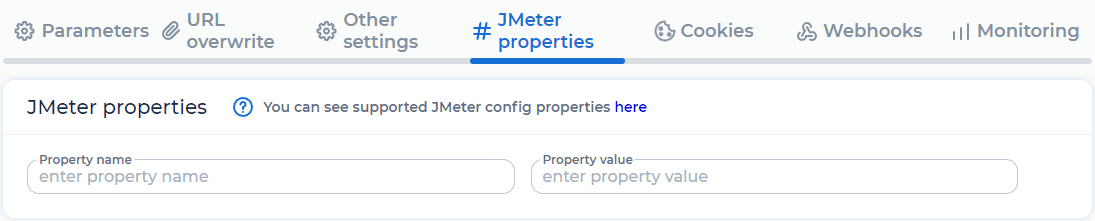
All that remains is to link the settings set to the test and run it!
Performance testing gRPC services