


With dozens of load testing tools on the market, choosing the right one feels overwhelming. Some platforms are overly complex or unintuitive, which often leads teams to skip performance testing altogether — or look for modern cloud-based alternatives to legacy solutions.
To make the decision easier, I’ve put together a list of the best load testing tools for 2026. This comparison intentionally focuses on cloud-based and browser-based solutions, rather than legacy desktop software.
The tools included here cover a mix of open-source and commercial options, making the list relevant for startups, mid-size companies, and large enterprises. Beyond raw load generation, I highlight features that matter today — AI-driven insights, browser-based testing, integrations with monitoring tools, and private cloud support.
Key Takeaways:
- The load testing tools eliminate the need for on-premise infrastructure.
- Popular options include both open-source and commercial solutions.
- Key evaluation criteria: scalability, ease of use, supported protocols, price, and reporting features.
- Load testing platforms enable distributed traffic generation across global regions.
- Many tools offer free tiers, but enterprise plans unlock advanced analytics and collaboration features.
- Choosing the right tool depends on project size, budget, and integration requirements.
Top Load Testing Tools Comparison Table
Before diving into detailed reviews, here’s a side-by-side look at the top load testing tools for 2026. The table highlights the core features that matter most when making a decision. Use it as a quick reference if you need to shortlist tools fast. Detailed notes for every tool follow in the next sections.
What is Load Testing?
Load testing is the process of verifying whether a system can handle the expected number of concurrent users, transactions, or data volume without breaking down. It measures how well an application performs under increasing demand, checking for slow response times, system crashes, or other bottlenecks that impact reliability.
By simulating real-world traffic, teams can assess performance against defined service-level objectives (SLOs) or service-level agreements (SLAs). Developers, QA engineers, and site reliability engineers (SREs) rely on load testing tools to confirm that web apps, APIs, and back-end systems meet performance requirements before release. For API-heavy environments, cloud-based load testing platforms make it easier to model request bursts, latency, and throughput issues at scale.
Modern DevOps teams integrate these tools directly into CI/CD pipelines, enabling continuous validation of speed and stability with every build. Business leaders and SaaS founders also benefit: they can plan capacity, prevent downtime during product launches, and make informed scaling decisions.
Traffic simulation is only part of the picture. Strong reporting and monitoring features are equally important, helping teams interpret results, pinpoint weak spots, and implement fixes. With the right toolset, performance testing becomes less of a one-off task and more of an ongoing safeguard for application health and user satisfaction.
How I Compared The Best Load Testing Tools
When I set out to review the best load testing tools for 2026, I focused on what actually matters to engineers, DevOps teams, and decision-makers. Documentation and marketing pages can be misleading, so I worked directly with each product: either through a free trial or by purchasing the lowest-tier paid plan. This way, I could see how the tools behave in real scenarios — what’s easy, what’s clunky, and what’s missing.
Here are the main criteria I used for comparison:
1. Price and Value
I calculated the cost per virtual user hour (VUH) whenever possible. This made it easy to see which platforms deliver the most realistic traffic for the money. For enterprise-scale scenarios, I also considered how pricing changes as concurrency scales up.
2. Hosted Load Generators
Managing your own load infrastructure adds friction. I prioritized tools that provide hosted load generators in multiple geographic regions, so you can run tests quickly without worrying about servers.
3. Private Cloud Options
Some organizations, especially in finance, healthcare, or government, need stricter security. For these use cases, I looked at whether a tool supports private cloud deployments or on-premises generators.
4. Data Management and Collaboration
A good load testing platform doesn’t just run traffic; it also stores test results, allows sharing across teams, and supports collaborative analysis. I noted how each tool handles data retention, reporting, and team workspaces.
5. Open-Source Compatibility
Many teams already use JMeter, Gatling, or Locust. Compatibility with existing open-source scripts was a big factor, since it reduces the effort needed to migrate or scale.
6. Protocol Coverage
Not every tool supports the same protocols. I checked for HTTP/HTTPS, REST, WebSocket, gRPC, GraphQL, SOAP, JDBC/JMS, LDAP, MQTT, Kafka/MQ, SMTP, TCP/UDP, and whether browser-based testing was available. This helps teams pick a tool that fits their actual tech stack.
7. SLA/SLO Tracking
It’s not enough to see response times. The best tools allow you to define service-level objectives (SLOs) or service-level agreements (SLAs) and flag tests as pass/fail against those thresholds. This is particularly valuable for SREs who rely on metrics to keep systems reliable.
8. CI/CD and Continuous Testing
I looked at how well each platform integrates into CI/CD pipelines — through APIs, plugins, or command-line tools. Continuous load testing is becoming the standard for DevOps, ensuring that every release is checked for performance regressions.
9. Trial and Accessibility
Finally, I considered whether you can try the tool without major commitments. Free tiers, pay-as-you-go models, or affordable entry packages make it easier to experiment and find the right fit.
1. PFLB 🏆 — Load Testing Tool with AI Insights and Production-Like Traffic
PFLB is a cloud-based performance testing platform designed for engineering teams that need to validate applications at scale. Unlike legacy systems that require heavy infrastructure management, PFLB provides hosted load generators and private cloud options, so you can focus on testing rather than setup.
A standout feature is its ability to replay real production traffic patterns using Google Analytics data. This makes tests more realistic than simple synthetic load profiles, helping teams uncover bottlenecks that only appear under real-world usage. Combined with AI-powered analysis, PFLB can surface anomalies and point out likely problem areas faster than manual review.
The platform is built for a wide range of users — from engineers writing JMeter scripts to CTOs who need clear dashboards for decision-making. Tests can be created through an intuitive no-code interface or by importing assets such as HAR files, Postman/Insomnia collections, or JMX scripts. Results can be explored in detail via Grafana dashboards, trend comparisons across runs, or custom report builders.
Best for
Teams that want production-like traffic simulation, strong JMeter compatibility in the cloud, and AI-driven insights without managing infrastructure.
Pros
- 🥇Hosted load generators for cloud-scale tests or private cloud execution.
- 🥇Production traffic replay via Google Analytics for realistic scenarios.
- 🥇AI-powered analysis to identify performance bottlenecks quickly.
- 🥇Rich results dashboards with Grafana integration and visual trend tracking.
- Flexible test creation: no-code builder, HAR imports, Postman/Insomnia collections, or JMX files.
- SLA/SLO definitions to mark tests as pass/fail automatically.
- API support for CI/CD integration; results can be pulled directly into pipelines.
- Option for professional services to design and execute performance strategies.
Cons
- Free tier is restrictive (very limited VUH and number of runs).
- Lacks native integrations with leading APM tools (e.g., Dynatrace, New Relic).
- No browser-based load testing.
Protocols supported
HTTP/HTTPS, REST, SOAP, gRPC, Kafka, MQ (IBM MQ, RabbitMQ, ActiveMQ), plus full JMeter protocol coverage.
Pricing snapshot (checked September 2025) – $$$$$
- Free plan: up to 5 test runs, capped at ~17 VUH.
- Paid plans start at $50/month, with scalable usage-based pricing beyond the base package.
Notes
PFLB is especially attractive for teams already invested in JMeter who want a smoother, cloud-based workflow and more advanced analytics. It is less suited if browser-based test coverage or deep APM integrations are critical to your setup.
2. BlazeMeter — Multi-Stack Load Testing Platform
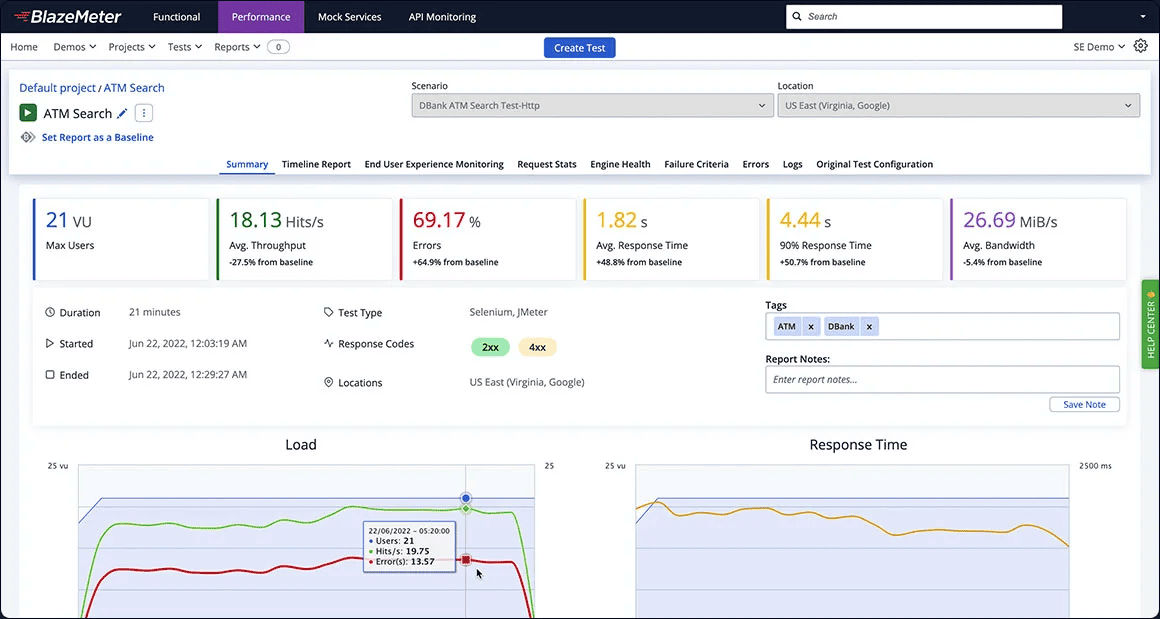
BlazeMeter is a commercial cloud platform that extends open-source performance testing tools with hosted execution, collaboration features, and analytics. Originally built around JMeter, it now supports other frameworks such as Gatling, Grinder, and Locust, allowing teams to reuse existing test assets without rewriting scripts.
One of its strongest points is the breadth of integrations. BlazeMeter ties into CI/CD workflows through Jenkins and other build tools, supports monitoring solutions like New Relic and AppDynamics, and can run mobile performance tests in partnership with Perfecto. For QA teams, it also provides functional and API testing capabilities, positioning itself as more than just a load testing tool.
The platform offers a scriptless test builder and a library of open-source plugins (including Taurus), which can make test design and automation more accessible. However, while BlazeMeter scales well, its reporting features are basic compared to competitors — you often need to pair it with external dashboards to perform deeper analysis. Pricing can also become steep once you exceed moderate concurrency levels.
Best for
Teams that want a single platform to run and extend JMeter, Gatling, or Locust scripts in the cloud, with strong CI/CD and monitoring integrations.
Pros
- Hosted load generators across multiple regions.
- Supports JMeter, Gatling, Grinder, and Locust scripts, minimizing migration effort.
- Integrates with monitoring and APM tools (New Relic, AppDynamics, DataDog, AWS CloudWatch).
- Provides functional and mobile testing alongside load testing.
- Open-source plugins like Taurus available for advanced automation.
- Scriptless test builder and GitHub resources for quick setup.
Cons
- Pricing grows quickly with large-scale tests (beyond ~1,000 concurrent users).
- Reporting is shallow; advanced analysis requires external tools.
- No built-in bottleneck detection or AI insights.
- Ensuring realistic traffic patterns requires manual tuning.
- Learning curve for advanced features can be steep.
Protocols supported
HTTP/HTTPS, REST, WebSocket, browser-based testing (via Selenium and Playwright), plus all JMeter and Gatling protocols.
Pricing snapshot (checked September 2025) – $$$$$
- Free tier: 170 VUH/month, max 20-minute test duration.
- $99/month: 1,000 VUH, max 1-hour test duration.
- $499/month: 6,500 VUH, max 5-hour test duration.
- Enterprise and custom plans available for higher loads.
Notes
BlazeMeter shines as a multi-stack runner for open-source tools, but it lacks the depth of analytics and bottleneck detection offered by newer platforms. It’s a good fit for teams standardizing on JMeter or Gatling and already using CI/CD pipelines, but less ideal if detailed performance diagnostics are a top priority.
3. Gatling — High-Concurrency Load Testing Tool
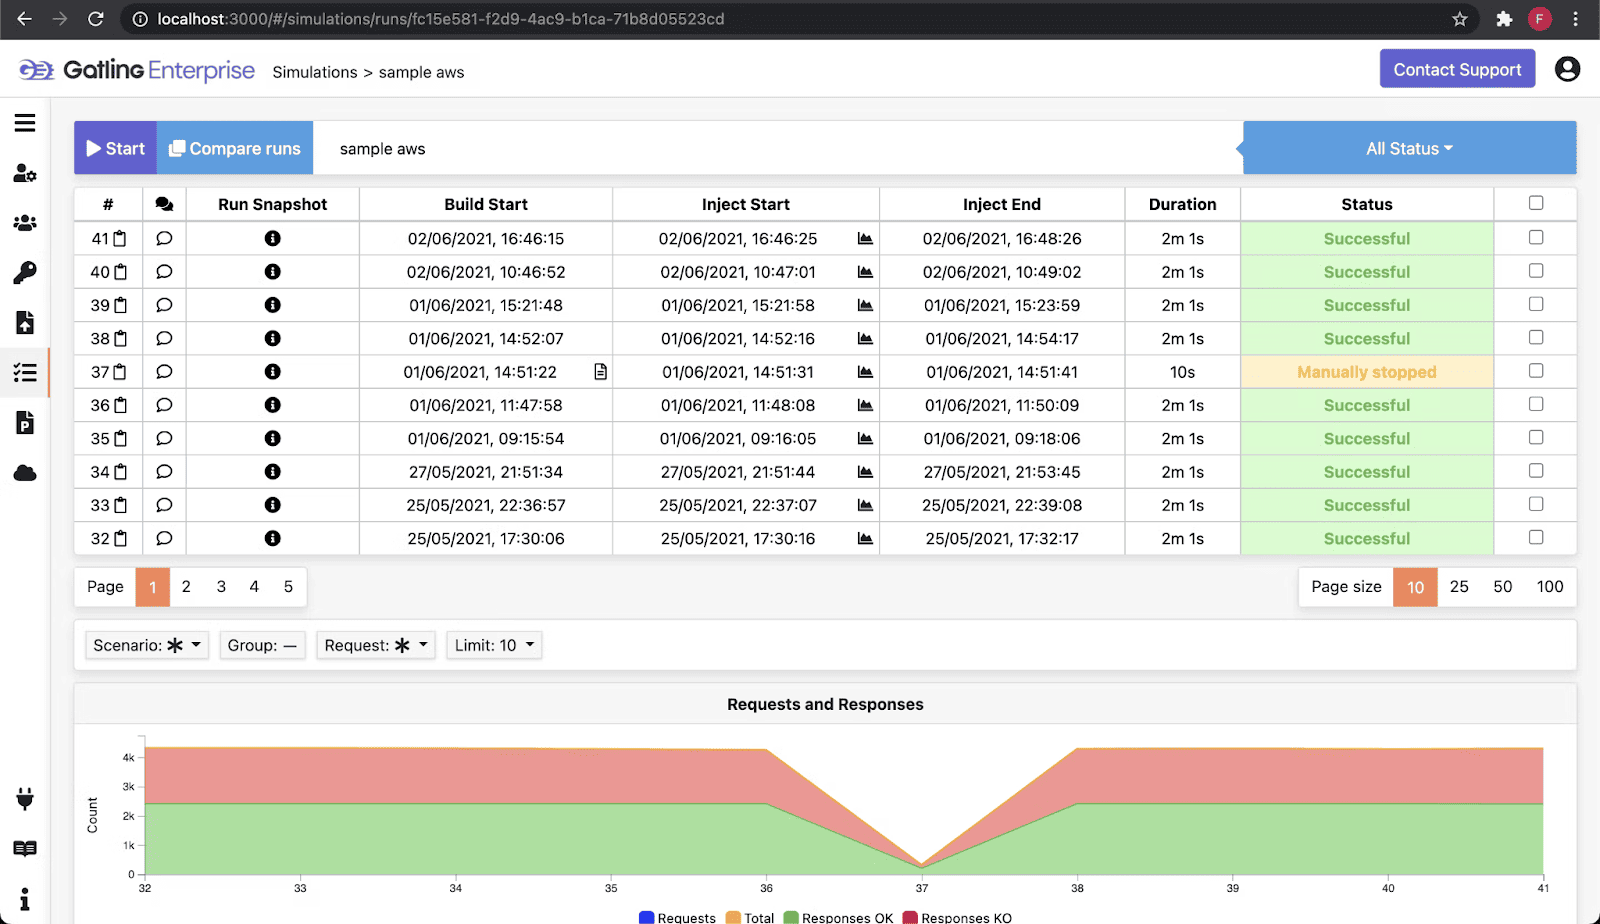
Gatling is a well-known load testing tool available in both an open-source edition and a commercial Enterprise Cloud offering. The open-source version relies on scripts written in Scala or Java, which makes it powerful but also demands programming skills. For teams that want scalability without managing infrastructure, Gatling Enterprise provides hosted load generators, a web interface, and seamless CI/CD integration.
The biggest advantage of Gatling is scalability at reasonable cost. Even at mid-tier plans, you can run very large numbers of virtual users, making it a strong choice for stress testing and benchmarking high-traffic systems. Gatling also offers plugins for protocols like Kafka, RabbitMQ, and JDBC, expanding its use cases beyond simple HTTP-based testing.
While Gatling is powerful, it has a steeper learning curve than some competitors. Test creation in the open-source version requires coding knowledge, and even the “no-code” options in Enterprise can feel less intuitive compared to other modern platforms. Reporting and analytics are also weaker out of the box — you often need to rely on integrations with APM tools or external dashboards to get deep insights.
Best for
Engineering teams that need to run very large-scale load tests with cost efficiency and don’t mind working with Scala/Java scripts or a less polished UI.
Pros
- 🥇 Scales to hundreds of thousands of concurrent virtual users.
- Available as both open-source and cloud-hosted enterprise versions.
- Plugins for Kafka, RabbitMQ, JDBC, and more.
- Web recorder to capture browser interactions.
- Integration with popular APM tools (Dynatrace, AppDynamics, New Relic, DataDog).
- Enterprise Cloud supports CI/CD workflows and distributed test execution.
Cons
- Requires knowledge of Scala or Java for open-source scripting.
- No-code interface in Enterprise is less intuitive than competitors.
- Setup complexity for beginners.
- Reporting and analytics weaker compared to Grafana-based solutions like PFLB or K6.
- Smaller community than JMeter, meaning fewer third-party resources.
Protocols supported
HTTP/HTTPS, REST, WebSocket, JMS, SOAP, MQTT, HTTP/2, JDBC.
Pricing snapshot (checked September 2025) – $$$$$
- 14-day free trial with 30,000 VUh included and a 30-minute max test duration limit.
- €99 per month for 60,000 VUh.
- €396 per month for 900,000 VUh.
- Custom pricing is available by quote.
Notes
Gatling is one of the most cost-effective options for extreme scalability, but it’s not the easiest tool for beginners. Teams that already have Java/Scala expertise or need to simulate massive concurrency will get the most value here.
4. Octoperf — JMeter-Centric Load Testing Platform
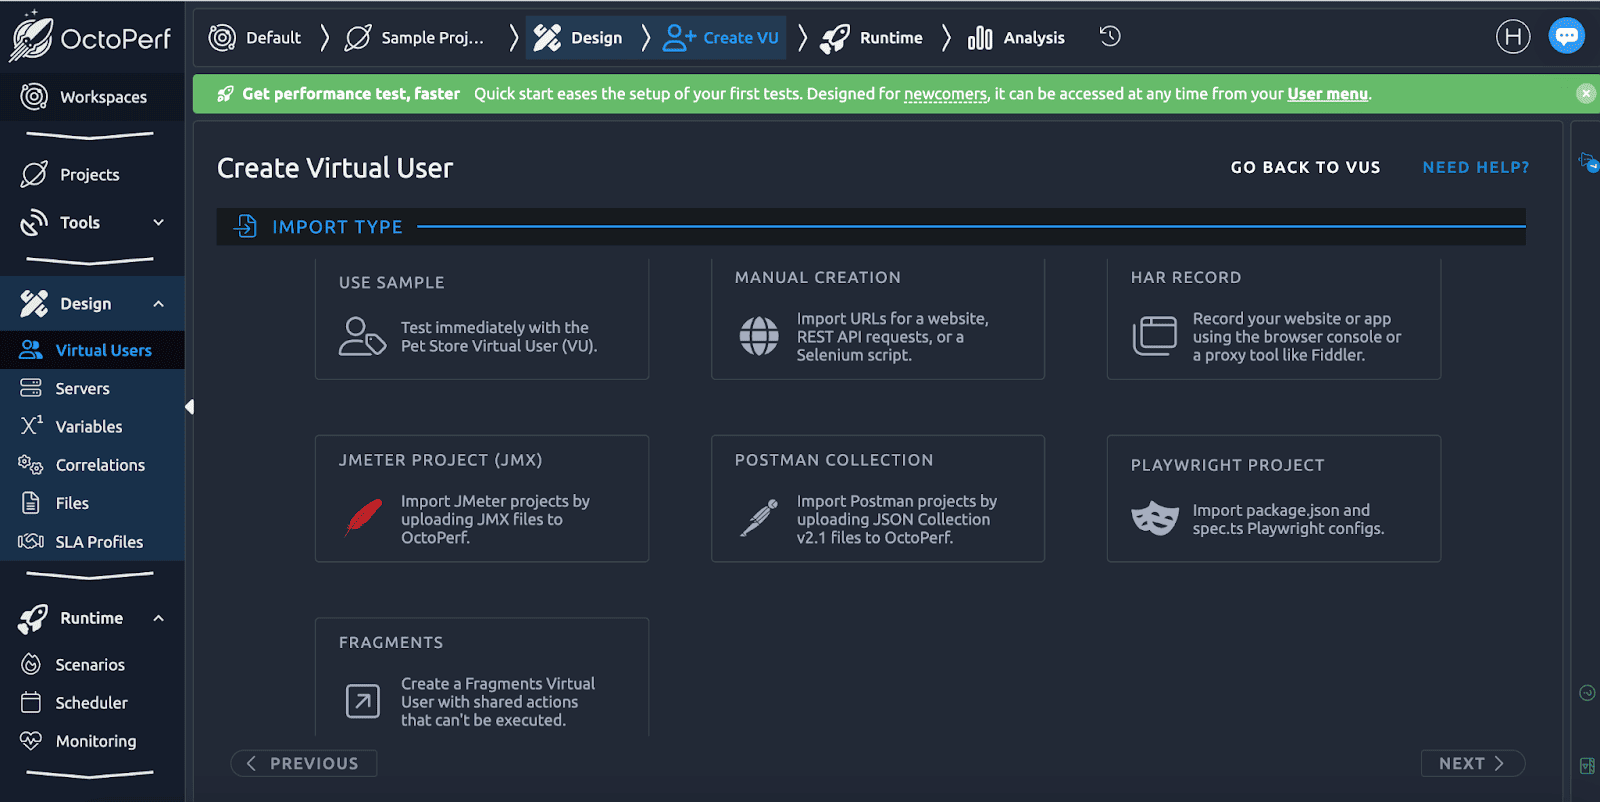
OctoPerf positions itself as a JMeter Performance Center — a professional-grade platform that brings JMeter testing into the cloud with advanced features and a polished interface. Instead of managing your own infrastructure, you can import existing JMeter scenarios or create new ones with a visual test builder. The platform also supports assets from Postman, HAR files, and Playwright scripts, giving teams flexibility in how they design tests.
One of OctoPerf’s strongest advantages is its reporting engine. Test results are presented with detailed breakdowns, trend analysis, SLA compliance checks, and customizable dashboards. For distributed testing, OctoPerf integrates with major cloud providers like AWS, Azure, and DigitalOcean, while also allowing hybrid setups with private or on-premises generators.
The platform is well suited for experienced performance engineers who want granular control. You can fine-tune load profiles with variables, data pools, IP spoofing, and advanced correlation options. However, the learning curve can be noticeable for less technical teams, and unlike some competitors, OctoPerf does not offer features like traffic pattern replay or automated bottleneck detection.
Best for
Teams already working with JMeter that need advanced cloud-based execution, professional reporting, and strong customization.
Pros
- Hosted and private load generators, including an on-premises configurator.
- Supports AWS, Azure, and DigitalOcean for distributed testing.
- Deep configuration options: load curves, correlation rules, IP spoofing, data pools, SLA tracking.
- Advanced reporting with trend analysis and customizable dashboards.
- Supports Playwright scripts for browser-based testing.
- Strong documentation, tutorials, and even certification programs.
- Integrates with APM tools such as Dynatrace, AppDynamics, New Relic, and Instana.
Cons
- Free version limited to 17 VUH and short test durations.
- Learning curve for advanced features.
- No production traffic replay.
- No built-in performance bottleneck detection.
Protocols supported
HTTP/HTTPS, REST, WebSocket, browser-based testing (via Playwright), and full JMeter protocol coverage.
Pricing snapshot (checked September 2025) – $$$$$
- Free tier: 17 VUH with limited features.
- Pay-as-you-go: from $69 for 1,000 VUH.
- Enterprise plans: e.g., €649/month for 720,000 VUH (capped at 1,000 VUH per test).
- Custom pricing available for large organizations.
Notes
OctoPerf stands out for teams that already rely heavily on JMeter and want a robust, cloud-based execution and reporting environment. It’s less suitable for teams seeking AI-driven insights or production traffic replay but remains one of the strongest JMeter-focused load testing tools available.
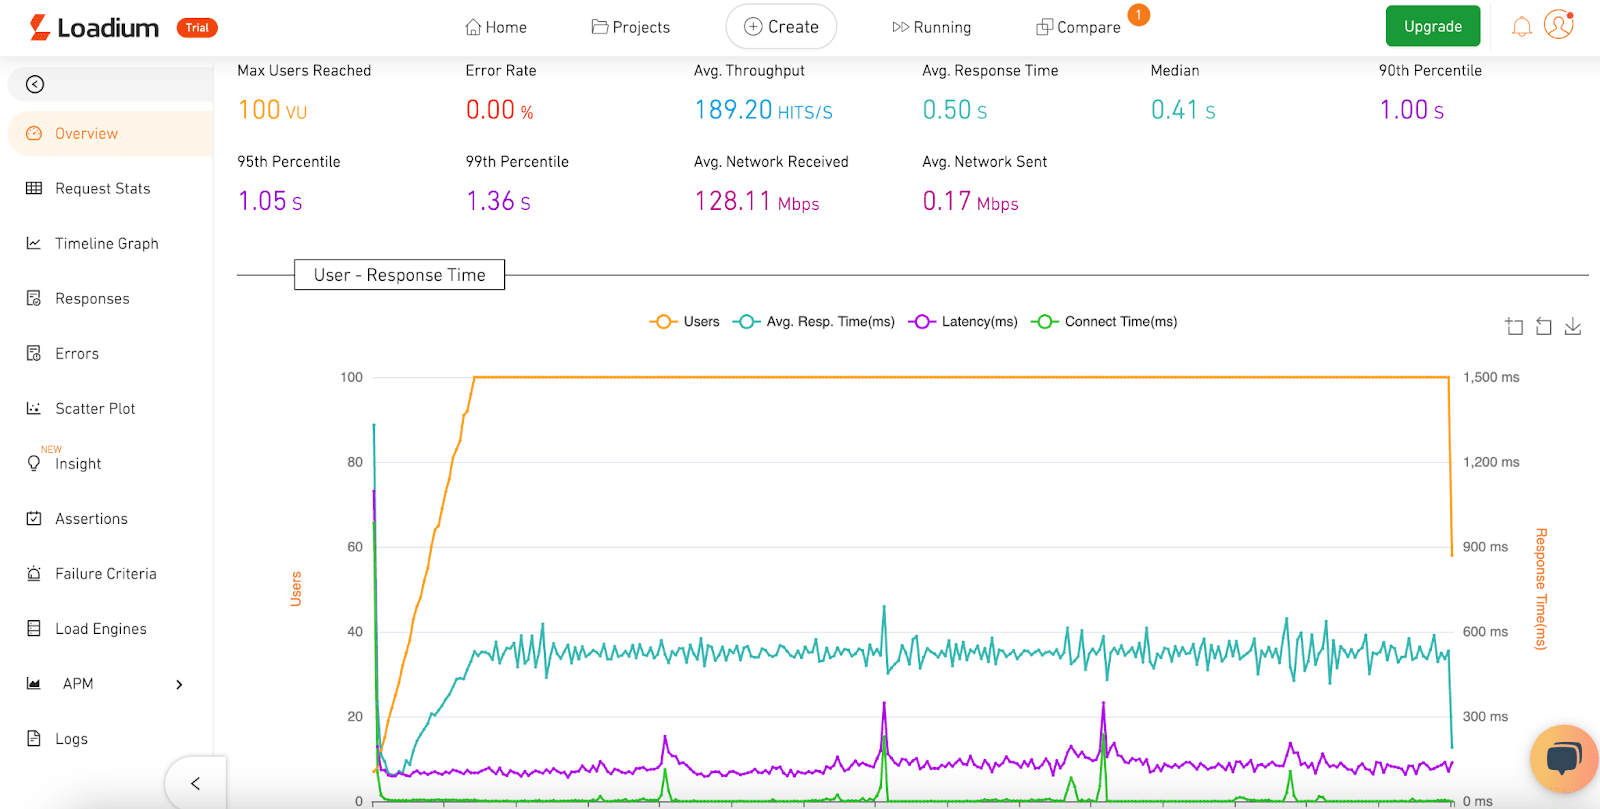
5. Grafana Cloud K6 — Developer-Focused Load Testing with Observability
K6 started as an open-source load testing tool written in Go, with tests defined in JavaScript. It quickly became popular among developers thanks to its lightweight design, scripting flexibility, and ability to handle modern protocols such as gRPC and WebSockets. The commercial Grafana Cloud K6 offering extends this foundation with hosted load generators, distributed test execution across 20+ regions, and seamless integration into the Grafana observability stack.
Where Grafana Cloud K6 really shines is in connecting load test results with system observability. You can correlate test outcomes with metrics, logs, and traces in Grafana, making it easier to understand not just that a failure happened, but why. Trend tracking across tests also helps teams spot regressions early. For organizations already invested in Grafana for monitoring, K6 becomes a natural extension of their ecosystem.
That said, the tool is developer-centric and comes with a learning curve. Writing scenarios requires JavaScript skills, and the platform does not support JMeter, Gatling, or Grinder assets. Pricing can also be confusing, as it mixes VU-hour billing with charges for logs, metrics, and data retention, making cost prediction harder compared to more straightforward models.
Best for
DevOps and SRE teams that already use Grafana for observability and want to align load testing directly with performance monitoring.
Pros
- Hosted load generators across 20+ global regions, plus private cloud support.
- Excellent scalability, up to millions of concurrent virtual users.
- Deep integration with Grafana for correlating test results with metrics, logs, and traces.
- SLO-based pass/fail criteria for clearer reliability checks.
- Browser testing possible via the
xk6-browserextension. - Trend tracking to compare performance over time.
Cons
- Requires JavaScript knowledge; less accessible to non-developers.
- No compatibility with JMeter, Gatling, or Grinder scripts.
- Learning curve even for experienced testers new to the ecosystem.
- Pricing model mixes VUH with observability data costs, making it complex to estimate.
- Occasional stability issues reported with long WebSocket sessions.
Protocols supported
HTTP/HTTPS, REST, WebSocket, gRPC, GraphQL, Kafka (via xk6 extension), and browser-based testing (via xk6-browser).
Pricing snapshot (checked September 2025) – $$$$$
- Free plan: 500 VUh per month.
- Starter: from $19/month (500 VUH + overage at $0.19/VUH).
- Growth: from $299/month (1,000 VUH + overage at $0.15/VUH).
- Additional charges for Grafana observability features (metrics, logs, traces).
Notes
Grafana Cloud K6 is a top choice if your team is developer-heavy and already relies on Grafana dashboards. It may not be the simplest or cheapest option for beginners, but for organizations focused on observability-driven performance testing, it’s one of the strongest tools available.
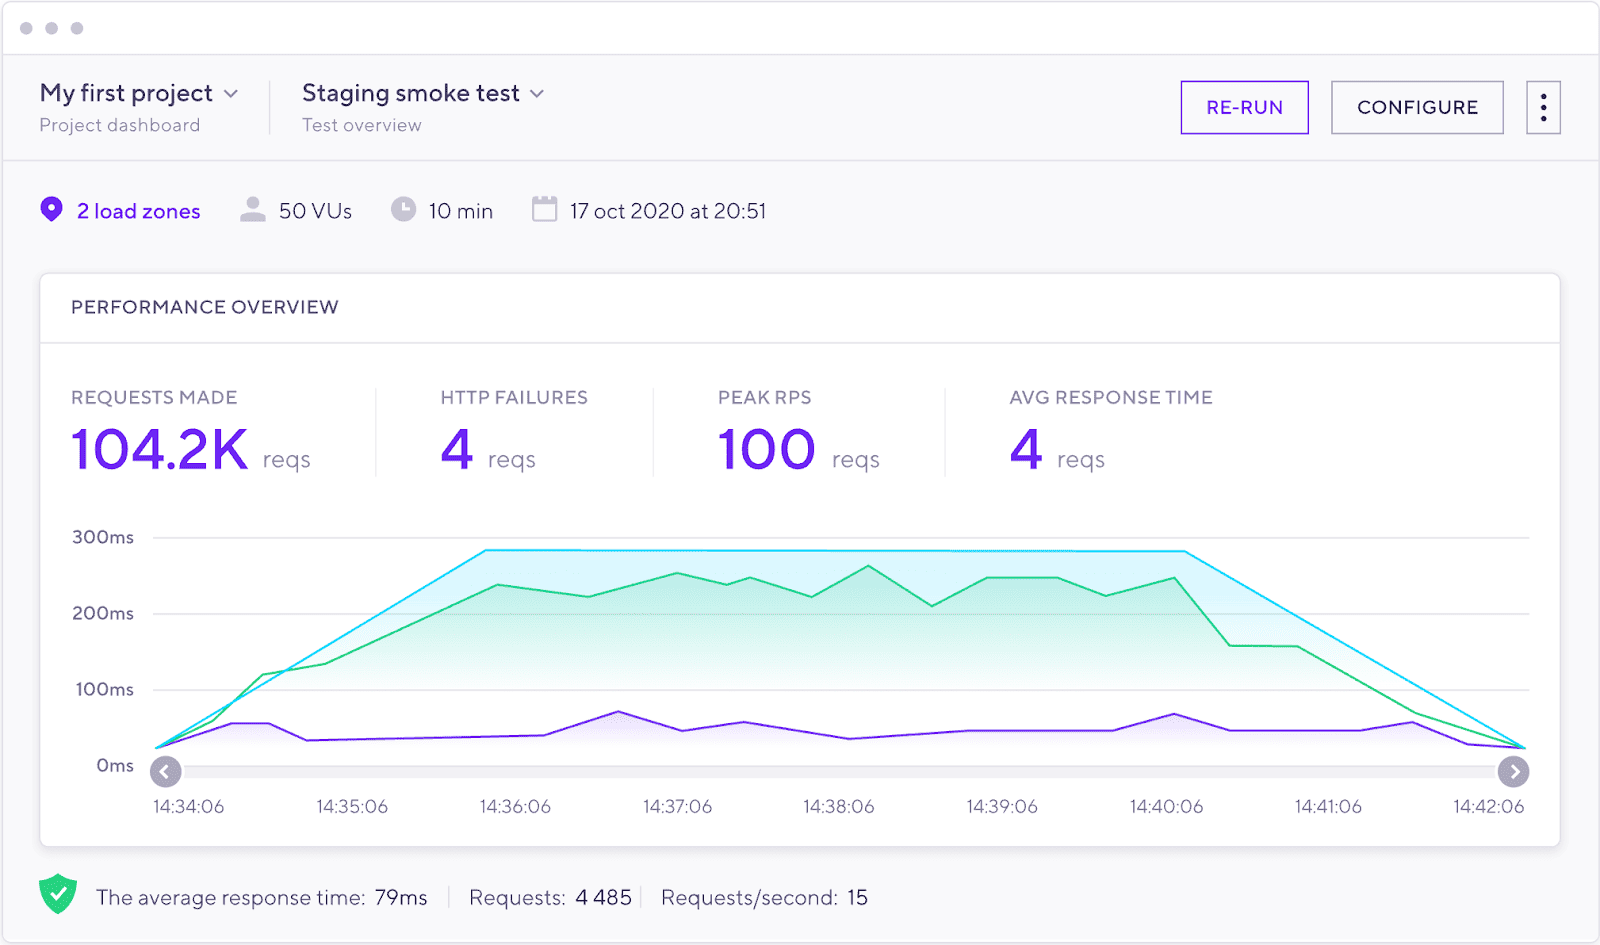
6. Loadium — Cloud Load Testing with Script Reuse
Loadium is a cloud-based load testing platform designed to simplify performance testing for teams of all skill levels. The platform is built around compatibility with open-source tools, making it easy to upload and run existing JMeter or Gatling scripts. For teams that prefer not to script, Loadium also offers manual test creation and a Record & Play browser extension, which captures user interactions and converts them into test scenarios.
A key strength of Loadium is its flexibility in execution environments. You can run distributed tests across up to 50 global locations via AWS, Azure, and Google Cloud, or take advantage of dedicated IPs for more controlled experiments. Features like slow network emulation, advanced load shaping, and integration with APM tools (New Relic, AppDynamics, DataDog) give performance engineers deeper control over test conditions.
The platform provides a clean UI and straightforward reporting, but it does not include more advanced features like bottleneck detection or production traffic replay. Protocol support is somewhat narrower compared to leading platforms, and the free tier is limited in both duration and number of runs.
Best for
Teams that already rely on JMeter or Gatling and want a straightforward way to scale tests in the cloud, with flexible geography and APM integrations.
Pros
- Supports JMeter and Gatling scripts for fast onboarding.
- Record & Play extension for quick scenario creation.
- Distributed testing from up to 50 locations across AWS, Azure, and GCP.
- Dedicated IP addresses available.
- Supports browser-based testing via Selenium WebDriver.
- Advanced features such as slow network emulation and precise load shaping.
- Integrates with APM tools (New Relic, DataDog, AppDynamics).
Cons
- Free tier limited to 10 test runs (5 minutes each).
- No built-in bottleneck detection or production traffic replay.
- No native support for gRPC, Kafka, or MQ protocols.
- Reporting is functional but lacks advanced analytics.
Protocols supported
HTTP/HTTPS, REST, HLS/MPEG-DASH for streaming, browser-based testing (via Selenium), plus full JMeter protocol coverage.
Pricing snapshot (checked September 2025) – $$$$$
- $129/Month for 7,500 VUh.
- $499/Month for 15,000 VUh.
- Custom pricing is available.
Notes
Loadium balances ease of use with flexibility, especially for teams that already script in JMeter or Gatling. While it lacks some cutting-edge features, its global reach and integrations make it a solid mid-market option.
7. Artillery — Flexible Scripting for Modern Protocols
Artillery is an open-source load testing tool focused on simplicity and flexibility. Tests are defined in lightweight YAML or JavaScript files, making it accessible to developers who want precise control over traffic scenarios. While the base tool is CLI-driven, Artillery Cloud adds hosted execution, visual dashboards, and team collaboration features.
What sets Artillery apart is its protocol coverage for modern applications. In addition to HTTP and REST, it supports gRPC, GraphQL, WebSockets, and Kafka — making it a strong fit for microservices and event-driven architectures. For front-end performance, Artillery can also execute browser-based tests using Playwright scripts, enabling both backend and end-to-end testing in one workflow.
The trade-off is that Artillery requires technical expertise. Writing YAML/JS definitions and managing CLI execution may be a barrier for non-developers. The platform also lacks compatibility with JMeter or Gatling, meaning existing test assets cannot be reused. While Artillery Cloud provides reporting dashboards, analytics remain more limited compared to competitors like PFLB or K6, and there is no built-in bottleneck detection.
Best for
Developer-centric teams working with modern APIs, microservices, or event-driven systems that need flexibility and protocol diversity.
Pros
- Lightweight, developer-friendly syntax (YAML/JS).
- Supports modern protocols: GraphQL, gRPC, Kafka, WebSockets.
- Playwright support for browser-based testing.
- Multi-stack testing in one platform (backend + frontend).
- Artillery Cloud adds hosted execution and dashboards.
- Free open-source version available.
Cons
- CLI-driven; requires scripting and technical expertise.
- No support for JMeter, Gatling, or other OSS frameworks.
- Limited reporting and analytics compared to enterprise platforms.
- No hosted load generators in the open-source edition.
- Lacks APM integrations and bottleneck detection.
Protocols supported
HTTP/HTTPS, REST, WebSocket, GraphQL, gRPC, Kafka.
Pricing snapshot (checked September 2025) – $$$$$
- Open-source edition: free.
- Artillery Cloud: free tier with basic dashboards; paid plans available (pricing varies by usage and team size).
Notes
Artillery is best suited for developer-heavy teams that want fine-grained control and need to test modern protocols. It is less accessible for non-technical users and lacks advanced analytics, but its protocol coverage makes it one of the most versatile developer-first load testing tools.
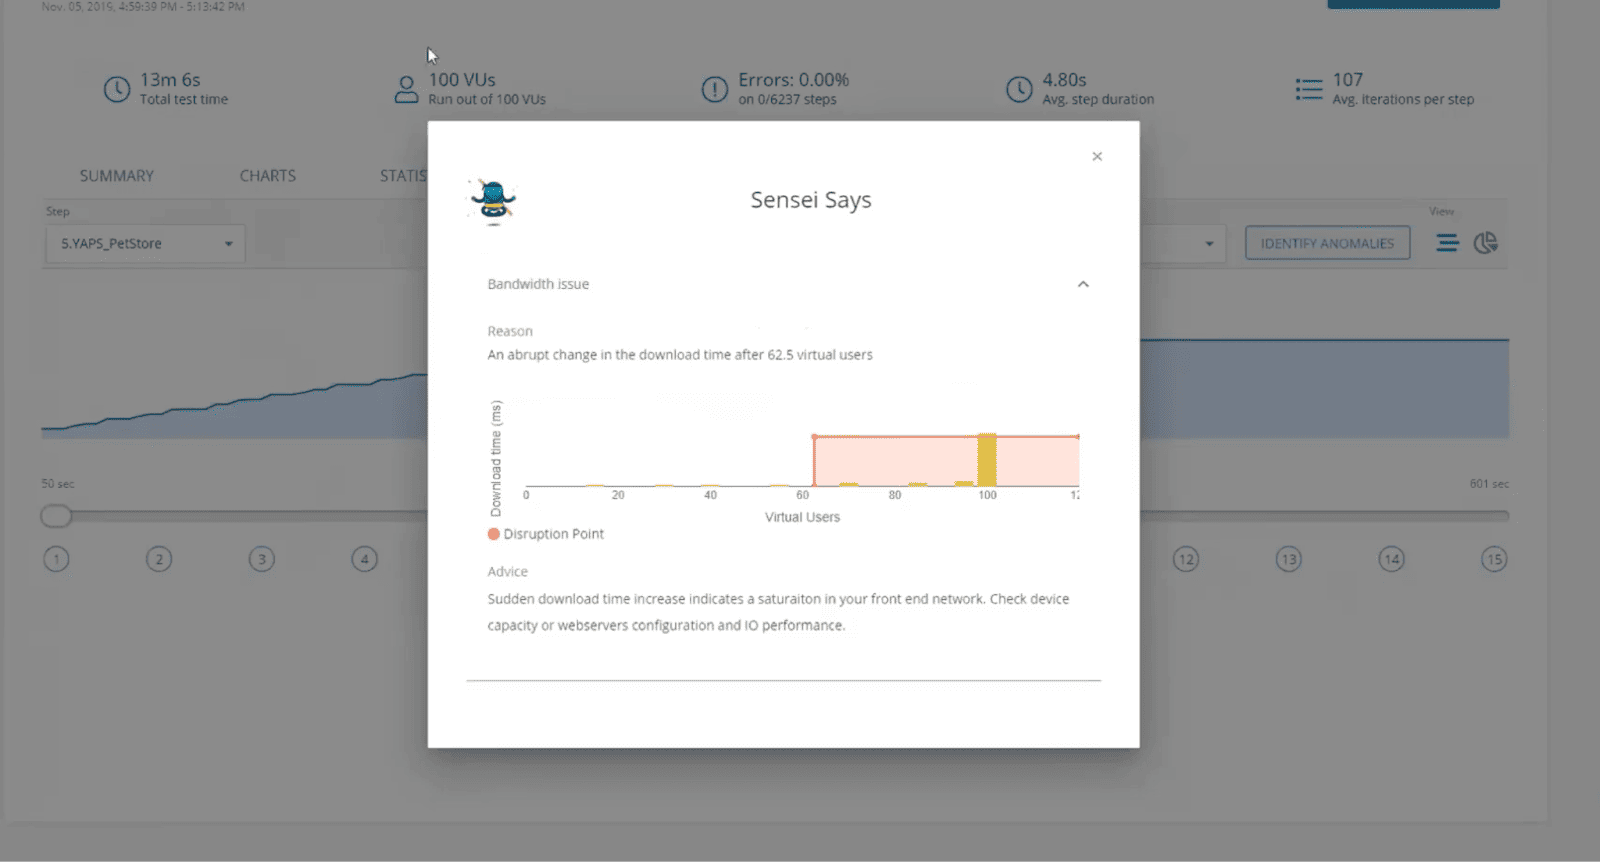
8. LoadNinja — Real-Browser Load Testing with AI Assistance
LoadNinja is a cloud-based load testing tool built around real browser execution. Instead of simulating HTTP requests, it uses actual browsers to generate load, producing metrics that closely reflect the end-user experience. This makes it especially useful for testing modern web applications with dynamic content, AJAX calls, and complex front-end logic.
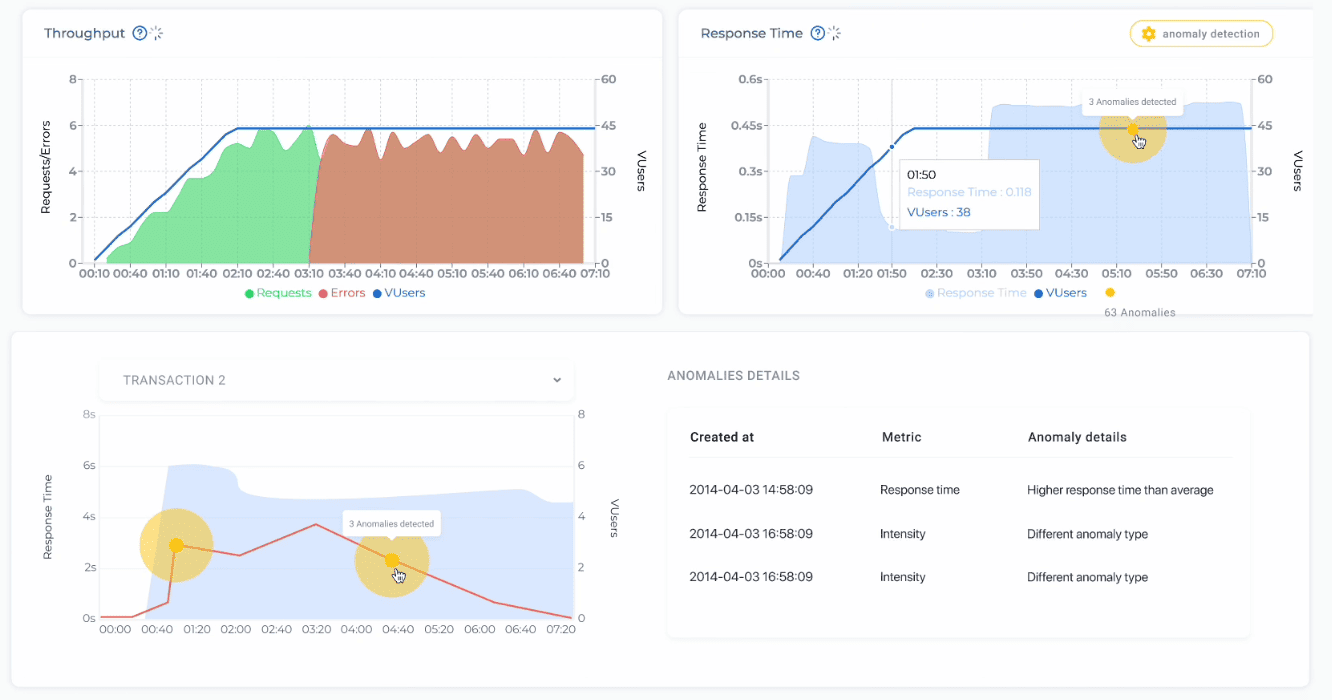
The platform emphasizes ease of use. With its record-and-playback interface, testers can create scenarios quickly without scripting. LoadNinja also includes AI-driven anomaly detection, which flags unusual performance patterns (e.g., “downtime spikes after 60+ users”), helping teams spot issues early.
On the downside, LoadNinja does not support private cloud deployments, and all tests are browser-based — meaning protocol-level flexibility is limited compared to tools like PFLB or K6. There are also restrictions on test duration in subscription plans, and the platform may struggle with applications that disable or heavily restrict JavaScript.
Best for
QA and development teams that want fast, browser-level load tests with minimal scripting effort and automatic anomaly detection.
Pros
- Real browser execution for accurate end-user performance metrics.
- Record-and-playback feature to build scenarios without scripting.
- AI-powered anomaly detection for faster troubleshooting.
- Detailed browser-level analytics and reporting.
- Subscription or on-demand pricing available.
Cons
- No private cloud support.
- Test duration capped in subscription tiers (typically 1 hour).
- Relies heavily on JavaScript; apps without JS support may cause issues.
- AJAX-heavy applications may introduce latency challenges.
- Lacks production traffic replay and advanced bottleneck diagnostics.
Protocols supported
Browser-based testing (using real browsers), REST (via browser interactions), SOAP (via browser interactions), Oracle Forms, SAP GUI Web.
Pricing snapshot (checked September 2025) – $$$$$
- Free trial: 14 days, no credit card required.
- On-demand pricing: from ~$301 for 800 VUH, scaling to ~$1,133 for 20,000 VUH.
- Subscription pricing: starts at ~$250/month for 800 VUH (capped per test), ~$735/month for 8,000 VUH, and ~$945/month for 20,000 VUH.
- Custom enterprise pricing available.
Notes
LoadNinja is best for teams focused on browser-based validation and end-user experience rather than protocol-heavy back-end testing. While not the most flexible option, its simplicity and AI-enhanced analytics make it attractive for web application QA teams.
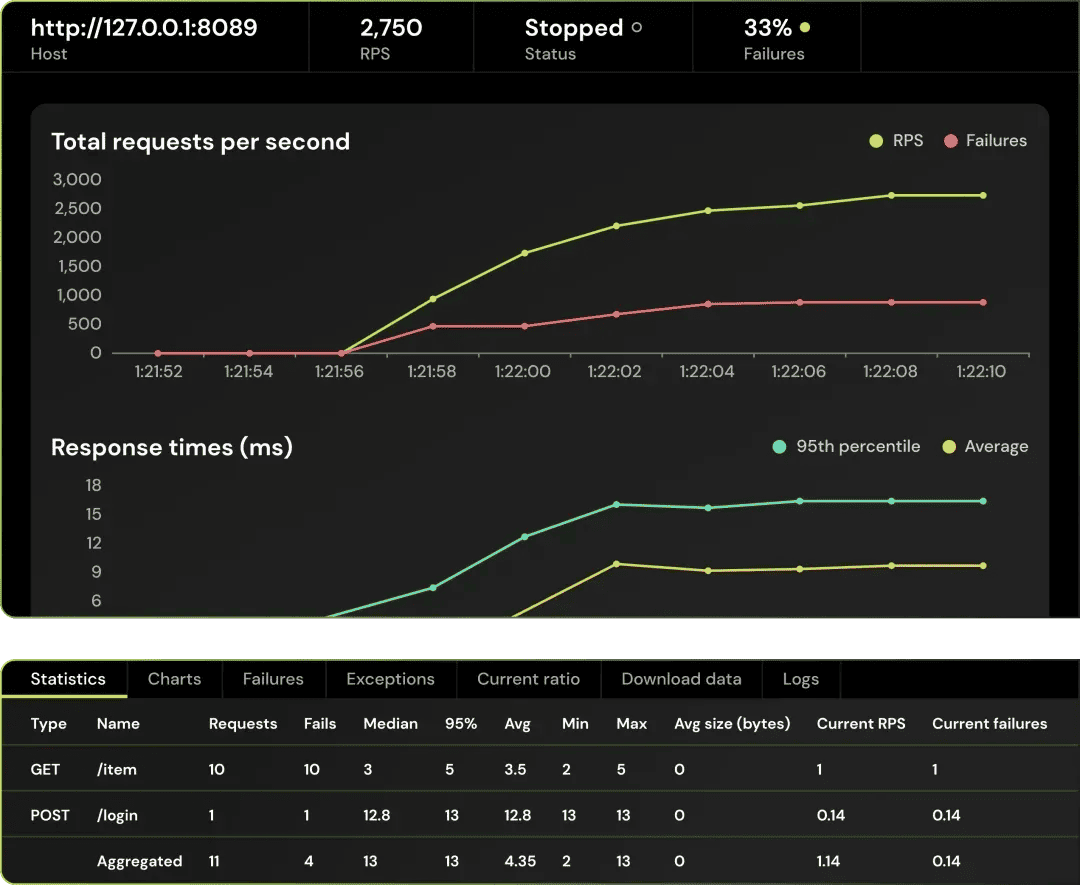
9. Locust — Python-Based Load Testing with Cloud Support
Locust is an open-source load testing framework that uses Python to define user behavior. Instead of relying on configuration files, testers write actual Python code to describe scenarios, making the tool extremely flexible and powerful. It’s widely used by developers who prefer programmatic control over their performance testing.
To expand beyond the open-source edition, the maintainers offer Locust.cloud, a commercial service that adds hosted load generators, a web UI, and simplified distributed execution. This makes it easier to scale tests without managing infrastructure while still benefiting from the flexibility of Locust scripting.
Locust’s strength lies in its extensibility. Because it’s Python-based, you can import libraries, build custom logic, or integrate with other systems. Distributed execution is supported out of the box, and the open-source documentation includes templates and practical examples to help teams get started. However, the tool has trade-offs: it requires Python knowledge, offers no script recording feature, and its reporting dashboards are fairly basic compared to platforms like PFLB or K6.
Best for
Teams that want the flexibility of Python scripting combined with scalable, cloud-based execution.
Pros
- Full scripting flexibility with Python.
- Hosted load generators available via Locust.cloud.
- Distributed execution supported for large-scale tests.
- Detailed documentation and practical examples.
- Real-time dashboards with the ability to export OpenTelemetry trace data.
Cons
- Requires Python skills; less accessible for non-developers.
- No built-in script recorder.
- Cloud service (Locust.cloud) does not currently support private deployments.
- No native APM integrations.
- Cloud reports stored for 180 days only (lifetime storage offered by some competitors).
Protocols supported
HTTP/HTTPS, REST, WebSocket, gRPC, Kafka.
Pricing snapshot (checked September 2025) – $$$$$
- Locust (open-source): free.
- Locust.cloud:
- $149/month for 1,000 VUH (limited to 500 concurrent users).
- $599/month for 5,000 VUH (limited to 1,000 concurrent users).
- Enterprise: custom pricing for unlimited VUH and users.
Notes
Locust is a favorite among developers thanks to its scripting flexibility, but it comes with a higher technical barrier. The commercial Locust.cloud service lowers infrastructure overhead, though it lacks some enterprise features like private cloud deployment or advanced analytics.
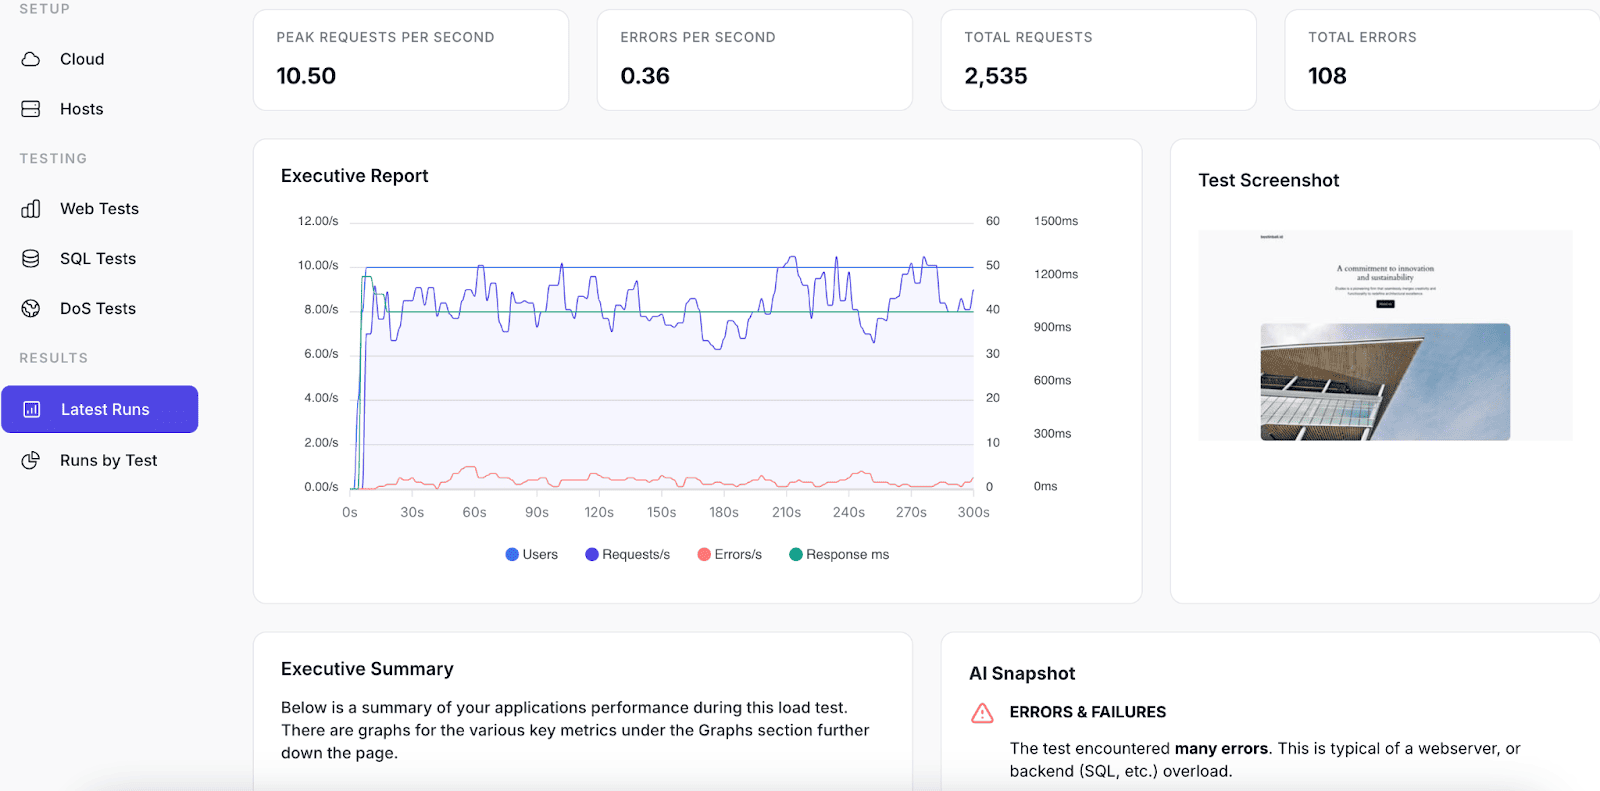
10. LoadForge — AI-Enhanced Load Testing with Locust Foundation
LoadForge is a relatively new load testing tool that combines a cloud-based interface with the Locust engine under the hood. It allows teams to create load scenarios through a graphical interface or by pasting Python scripts, while also offering basic AI features to simplify reporting and test generation.
The platform emphasizes ease of entry. With hosted load generators and integrations for CI/CD pipelines, teams can start tests quickly without infrastructure setup. LoadForge also offers features like SQL performance testing and even DoS simulations, giving it broader appeal than tools limited to web and API traffic.
Where LoadForge differentiates itself is its use of AI. A GPT-based summarizer creates high-level reports from test results, and an experimental AI-assisted script generator can produce basic Locust scenarios. However, these features remain early-stage and limited. The reporting dashboard can feel glitchy, advanced test configurators are missing, and there’s no free plan — making the platform harder to recommend for serious production use.
Best for
Small teams that want a simple, Locust-compatible cloud service with lightweight AI features for reporting and test generation.
Pros
- Hosted load generators with optional on-premise DigitalOcean deployment.
- Intuitive web interface for test creation.
- Locust script support for advanced customization.
- AI-driven features: report summarizer and basic script generator.
- CI/CD integration and real-time analytics.
- Includes a library of example scripts.
Cons
- No free plan; even the entry-level package is paid.
- Basic plan restricts tests to 10 minutes each.
- Limited configurator (no ramp-up curves, limited parameterization).
- Dashboard prone to glitches and failures.
- AI features are simplistic wrappers rather than deep integrations.
- Test credits deducted even when failures are due to internal errors.
Protocols supported
HTTP/HTTPS, REST, WebSocket, gRPC.
Pricing snapshot (checked September 2025) – $$$$$
- Entry plan: $49/month, includes 10 test credits (10 minutes each).
- Higher tiers available with additional VUH and features.
- Enterprise: custom pricing.
Notes
LoadForge is an interesting experiment in combining AI with load testing, but its current limitations and lack of a free tier make it better suited for experimentation than for enterprise use. Teams already invested in Locust may find more reliable options in Locust.cloud or other mature platforms.
Conclusion
Choosing the right load testing tool in 2026 ultimately comes down to your team’s priorities. If you need realistic traffic replay and AI-driven insights, PFLB stands out. For developers who want deep observability, Grafana Cloud K6 ties directly into monitoring stacks. Teams invested in JMeter may prefer OctoPerf or BlazeMeter, while Gatling delivers cost-effective scalability at very high concurrencies. Tools like LoadNinja focus on browser-based validation, and Locust or Artillery appeal to teams that prefer scripting flexibility.
In the end, the best choice depends on your specific requirements — protocol coverage, budget, team skills, CI/CD integration, or end-user simulation. Take advantage of free trials where possible, compare results against your service-level goals, and select the platform that aligns best with your applications and workflow.