When a page loads too slowly, people leave before they’ve even seen your content. For businesses, that means missed opportunities and lower visibility in search results. PageSpeed Insights, the tool from Google, was built to highlight exactly why a site is slow and what can be done about it. Instead of guessing, you get a clear picture of real-world performance and detailed suggestions for improvement.
In this guide, we’ve explained how to use Google PageSpeed Insights effectively to identify issues and apply fixes.
What is PageSpeed Insights?
PageSpeed Insights is a free tool from Google that measures how fast a webpage loads and provides recommendations for optimization. By running a Google Insight speed test, you receive two types of data: lab results (simulated performance in a controlled environment) and field data (collected from real users). This combination helps website owners understand not only technical bottlenecks but also the actual experience visitors have.
The goal of Google PageSpeed Insights is to make performance improvements clear and actionable. Instead of vague advice, it gives concrete metrics, like how long the main content takes to appear or how stable the layout is while loading. For businesses, developers, and marketers, this makes it easier to optimize websites for better engagement, higher conversions, and stronger search rankings.
The Importance of Page Speed Optimization
A website can look great, but if it loads slowly, users rarely stick around. Page speed optimization is critical not only for keeping visitors engaged but also for maintaining visibility in search results. Fast-loading websites deliver better experiences and support business growth in multiple ways:
- Improve user satisfaction by reducing wait times
- Increase conversion rates by keeping visitors on the page
- Strengthen SEO rankings, as Google favors faster websites
- Lower bounce rates, especially on mobile devices
- Support accessibility for users on slower networks
- Enhance overall performance of applications and digital platforms
Learn more: how does website speed impacts conversion rates
How Do Google PageSpeed Insights Work?
When you run a URL through Google PageSpeed Insights, the tool evaluates the site using two complementary approaches: synthetic testing and real-user performance data. Together, they provide both a controlled baseline and a realistic picture of how visitors experience the page.
- Lab Data (Synthetic Testing)
This part of the analysis is powered by Lighthouse, Google’s performance framework. It simulates loading conditions on a mid-tier device and slower network, ensuring consistency across tests. Lab data is especially useful during development because it highlights issues that may not yet affect all users. Common bottlenecks it detects include:- Heavy scripts that block rendering
- Large images that delay loading of visible content
- Field Data (Real User Experience)
In addition to simulation, PageSpeed Insights integrates data from the Chrome User Experience Report (CrUX). This field data reflects how actual users experience the site in different environments. Unlike lab tests, it captures variability caused by geography, device type, and network conditions. For example, while lab tests may show a smooth load, CrUX might reveal high bounce rates from mobile visitors on slower 3G networks. - Scoring System
The tool combines these results into a performance score between 0 and 100, broken down into three ranges:- 90–100 (Green): Fast and optimized
- 50–89 (Orange): Needs improvement
- 0–49 (Red): Poor performance
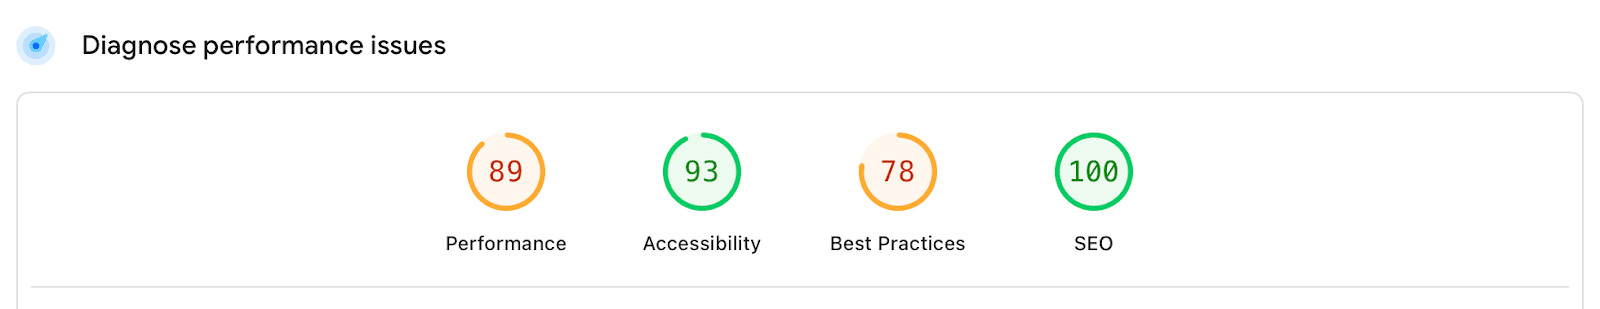
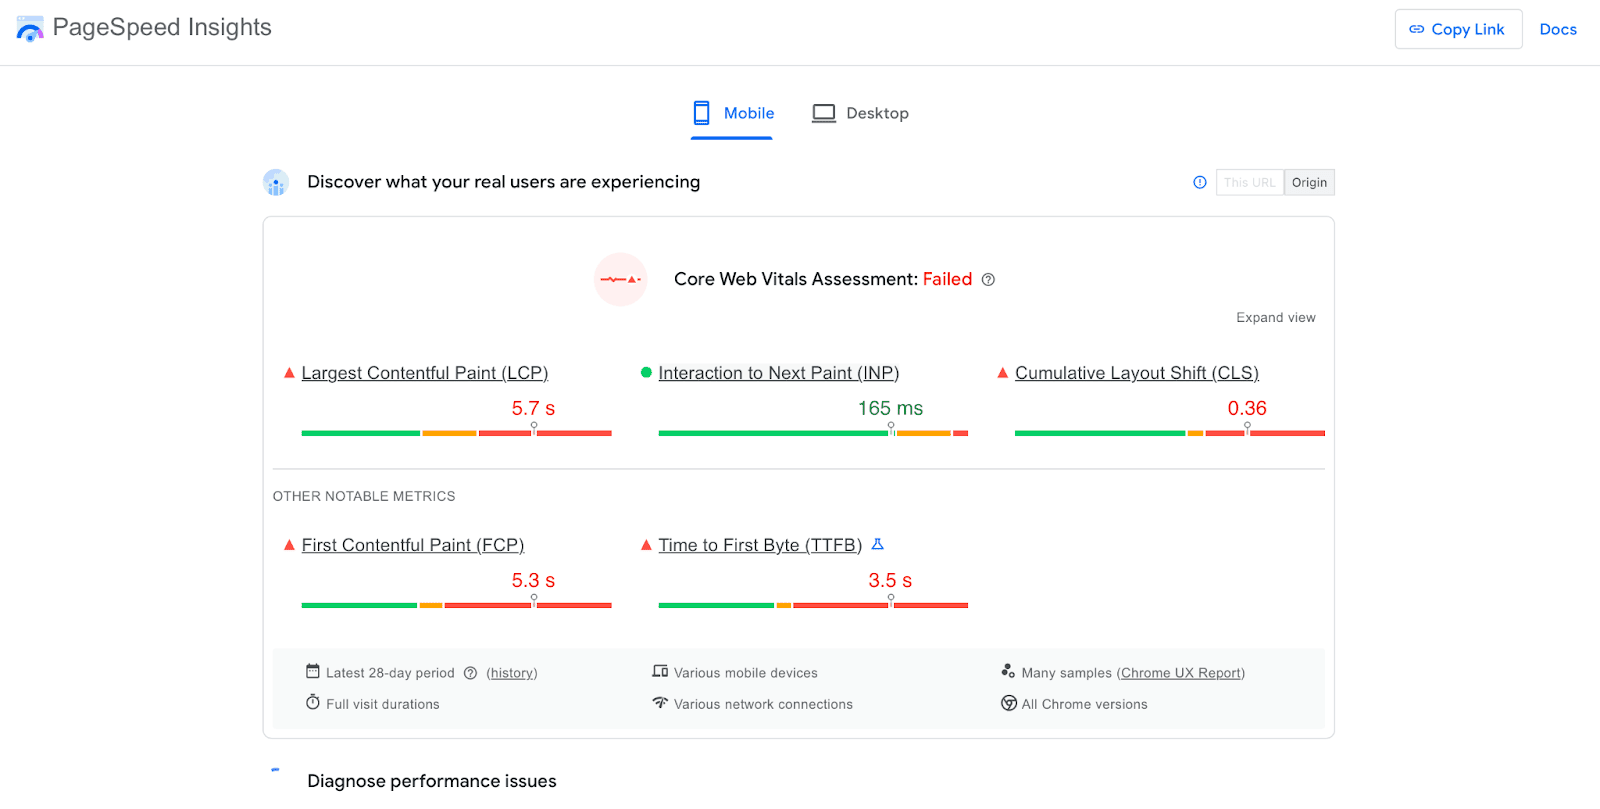
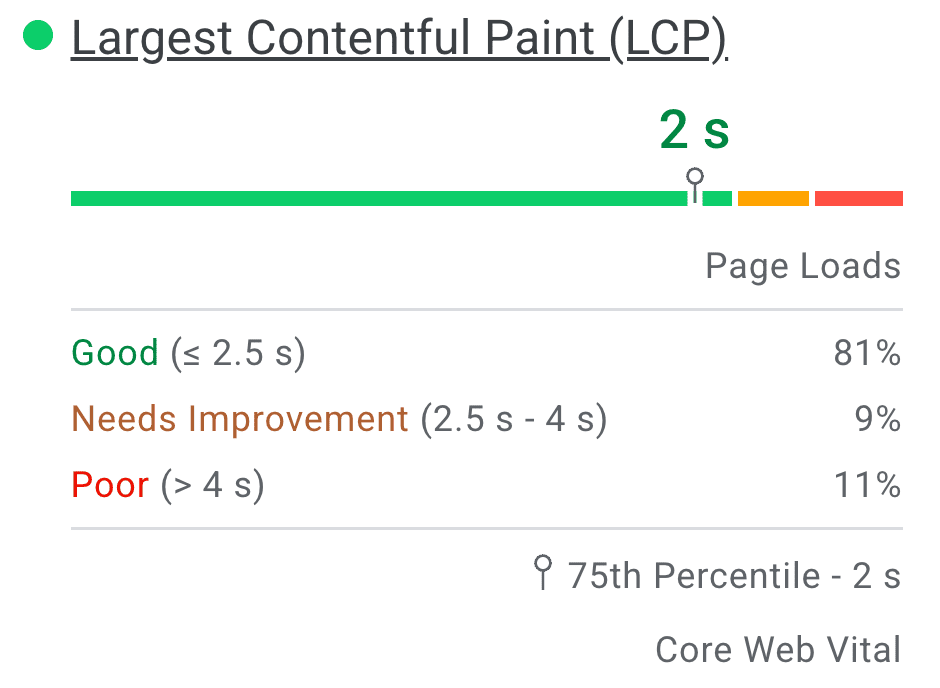
The score places heavy weight on Core Web Vitals such as Largest Contentful Paint, Cumulative Layout Shift, and Interaction to Next Paint. Alongside the score, PageSpeed Insights provides prioritized recommendations, helping teams focus on fixes that deliver the most significant performance gains.
Related: WordPress Speed Optimization
Main Metrics Reported by PageSpeed Insights
When you run a Google PageSpeed Insights test, the report doesn’t just give you a single score. It breaks performance into specific metrics that reflect how quickly and smoothly users experience the page. These metrics are closely tied to Core Web Vitals and other signals Google uses for ranking and usability.
| Metric | What It Measures | Good Score | Common Issues |
|---|---|---|---|
| Largest Contentful Paint (LCP) | Time for the largest visible element (hero image, banner, text) to load | ≤ 2.5 seconds | Large image files, slow server response, render-blocking resources |
| Interaction to Next Paint (INP) | How quickly the page responds to user actions (clicks, taps) | ≤ 200 ms | Heavy JavaScript execution, main-thread blocking tasks |
| Cumulative Layout Shift (CLS) | Visual stability of the page while loading | ≤ 0.1 | Images without fixed dimensions, dynamic ads, late-loading fonts |
| First Contentful Paint (FCP) | Time until the browser shows the first piece of content | ≤ 1.8 seconds | Render-blocking CSS/JS, unoptimized fonts, server delays |
| Time to First Byte (TTFB) | Time it takes for the browser to receive the first byte from the server | ≤ 0.8 seconds | Slow hosting, lack of caching, inefficient backend processes |
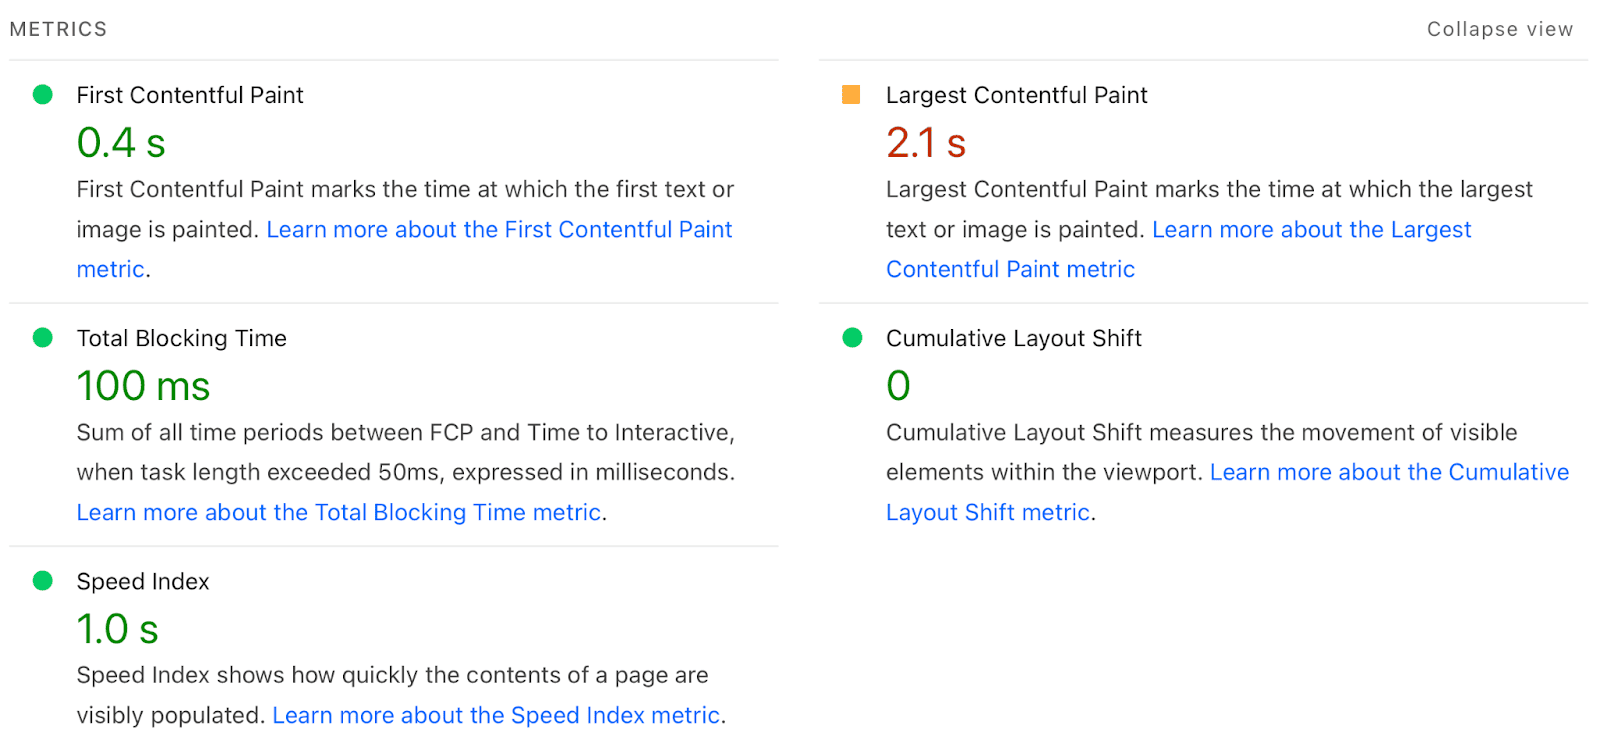
Largest Contentful Paint (LCP)
LCP measures how long it takes for the largest piece of visible content, such as a hero image, banner, or main text block, to render. Ideally, LCP should occur within 2.5 seconds. A slow LCP often signals large image files, unoptimized media, or server delays. Improving this metric directly improves perceived loading speed for users.
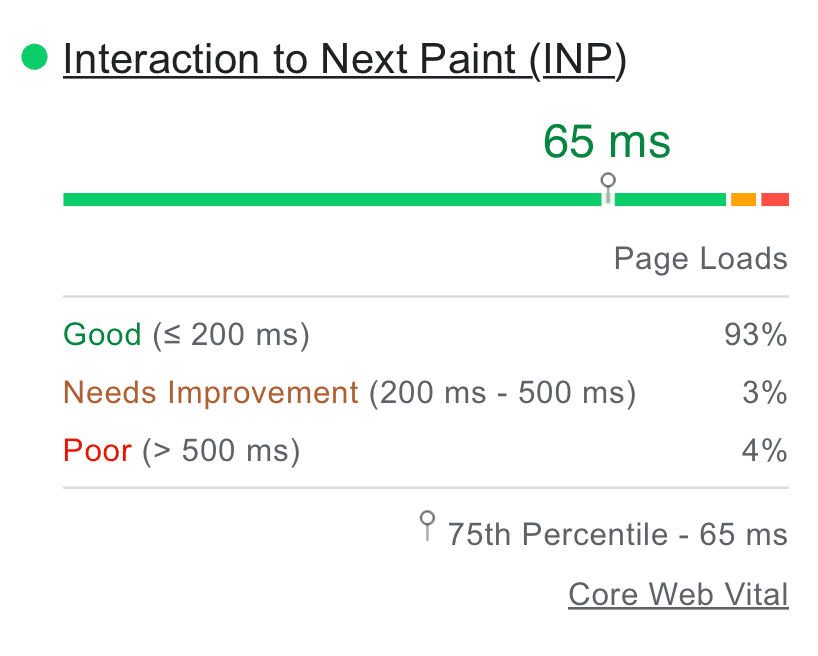
Interaction to Next Paint (INP)
INP is a newer metric that evaluates overall responsiveness. It measures the delay between a user’s action (like clicking a button) and the next visible response on the page. A poor INP usually means heavy JavaScript tasks are blocking the main thread, causing frustrating delays in interactivity.
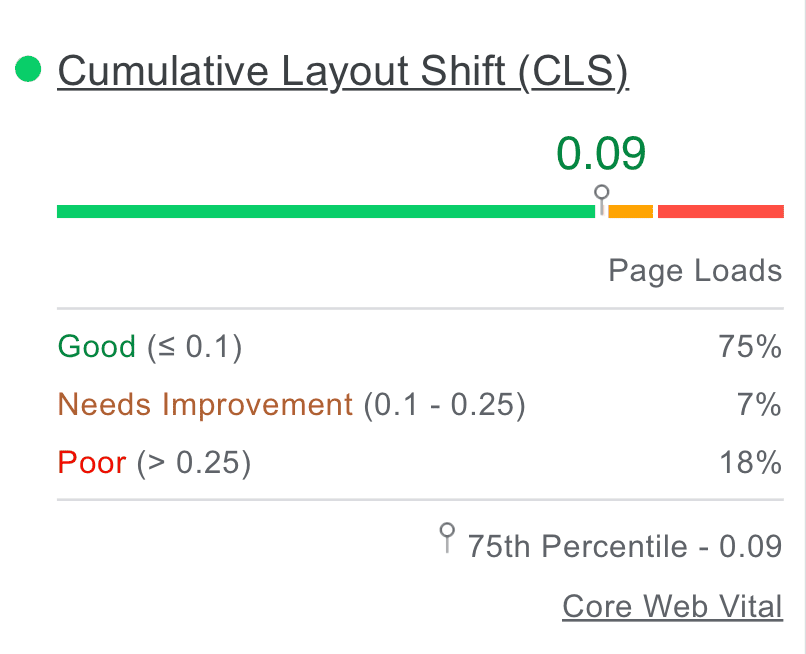
Cumulative Layout Shift (CLS)
CLS tracks how stable the page layout remains as it loads. If elements like text or buttons shift unexpectedly, users may click the wrong thing or abandon the site altogether. A good CLS score is below 0.1. Common culprits include images without fixed dimensions or ads injected into the page after load.
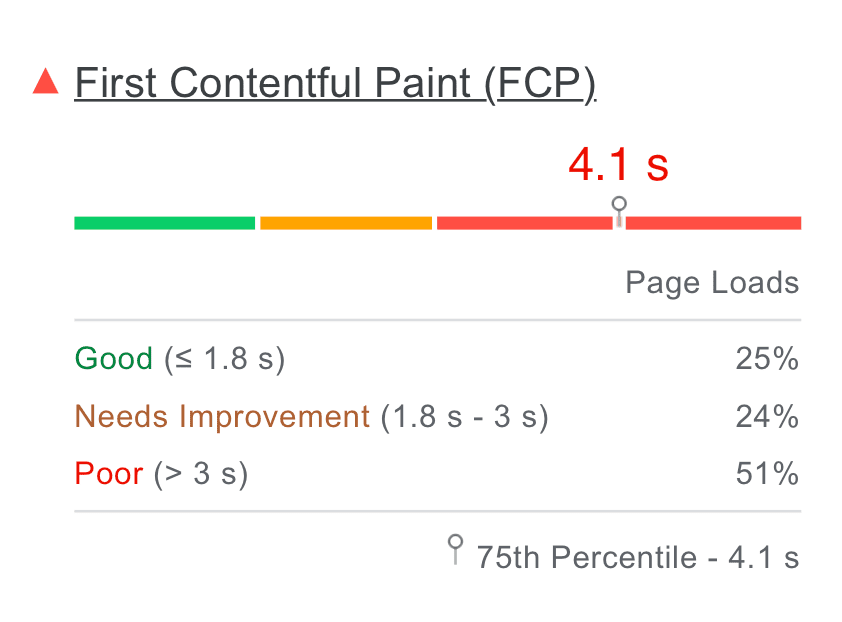
First Contentful Paint (FCP)
FCP measures the time until the browser renders the first visible content, such as text or a background image. While it doesn’t fully reflect usability, it indicates how quickly users see that the page is loading and not frozen. A fast FCP reassures visitors that content is on the way.
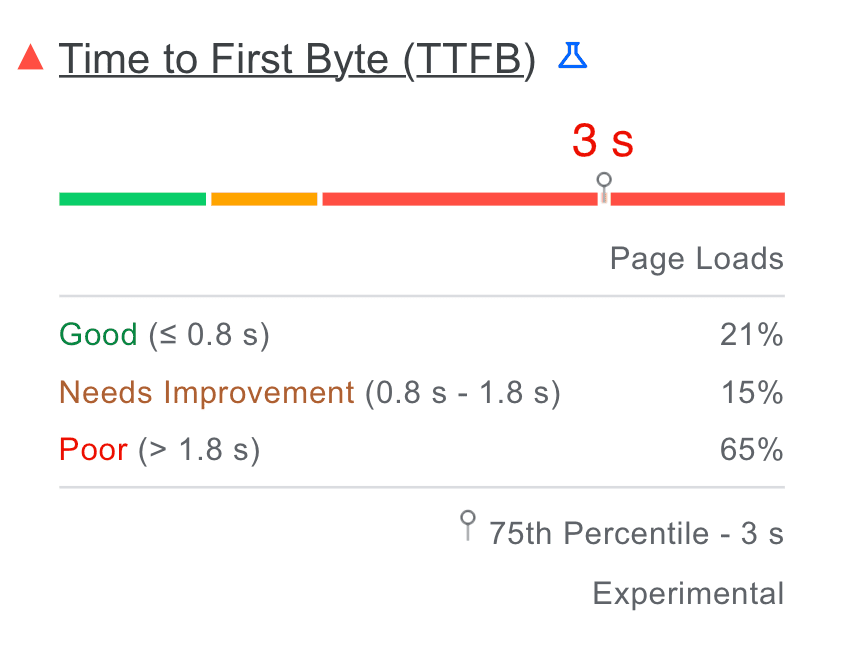
Time to First Byte (TTFB)
TTFB reflects how quickly the browser receives the first byte of data from the server after requesting a page. Long delays often signal slow hosting, poor caching, or inefficient backend code. Optimizing TTFB typically requires server-side fixes, such as using CDNs, faster hosting, or better caching strategies.
Each of these metrics provides a different lens on performance. By analyzing them together, PageSpeed by Google helps developers and businesses understand whether a site only looks fast in parts, or truly delivers a smooth, optimized experience from start to finish.
Tips on How to Increase Page Speed Score
Improving your results in a Google PageSpeed Insights test often requires a combination of front-end and back-end optimization. Below are some of the most effective approaches, explained in detail to show how they connect with key metrics such as LCP, INP, and CLS.
Eliminate Render-Blocking Resources
One of the most common issues revealed by Google Page Speed Insights is the presence of CSS and JavaScript files that block the browser from displaying content. When these resources load before visible elements, users are left staring at a blank screen. The solution is to prioritize what’s critical and delay what isn’t. Developers can inline small portions of CSS required for above-the-fold content, while non-essential scripts can be deferred or loaded asynchronously. The result is a faster First Contentful Paint and Largest Contentful Paint, which means visitors see meaningful content much sooner.
Practical fixes:
- Inline critical CSS for above-the-fold elements
- Defer or async non-essential JavaScript
- Minify CSS and JS files to reduce their weight
- Use resource hints like
preloadorprefetchwhere appropriate
Reduce Initial Server Response Time
A fast server response is the foundation of good performance. If the Time to First Byte (TTFB) is too high, even the most optimized front end won’t feel responsive. Improving server performance may involve several layers of work: configuring caching, optimizing database queries, or upgrading hosting infrastructure. Many businesses also use Content Delivery Networks (CDNs) to bring resources geographically closer to their users. These improvements are especially noticeable for global applications, where latency can otherwise make pages feel sluggish.
Practical fixes:
- Implement caching at server and application levels
- Use a CDN to deliver static files faster
- Optimize backend queries and scripts
- Monitor response times with performance monitoring tools
If you’re preparing for a major launch or traffic spike, pairing PageSpeed tips with performance testing services ensures your backend can reliably support the front-end improvements.
Minimize Main-Thread Work
Interactivity is just as important as loading speed. When the browser’s main thread is overwhelmed by long JavaScript tasks, users experience input delays; measured by the Interaction to Next Paint (INP) metric. Breaking large scripts into smaller chunks, cleaning out unused libraries, and offloading heavy computations to web workers are proven techniques. The end goal is to keep the page responsive even while background tasks are running, so users never feel like the site has frozen after they try to click or scroll.
Practical fixes:
- Split large JavaScript bundles into smaller chunks
- Remove unused libraries or polyfills
- Use web workers to handle heavy computations
- Implement lazy loading for non-critical elements
Reduce the Impact of Third-Party Code
Third-party scripts, such as analytics, advertising, or chat widgets, often slow down websites more than site owners expect. While they provide useful features, they frequently add seconds to loading time if unmanaged. Instead of cutting them all out, developers should audit integrations, keep only essential ones, and load them without blocking the render path.
Practical fixes:
- Audit scripts in Chrome DevTools → Coverage
- Load third-party code asynchronously or after rendering
- Replace heavy libraries (like jQuery) with lightweight alternatives
- Host critical scripts locally for faster delivery
Avoid Large Layout Shifts
A page that jumps around while loading frustrates visitors and lowers the Cumulative Layout Shift (CLS) score. These shifts usually come from images without defined dimensions, ads injected after load, or late-loading fonts. By reserving space for content and handling fonts properly, pages remain visually stable from the moment they load.
Practical fixes:
- Always specify width and height for images and videos
- Reserve fixed space for ads or embedded content
- Use
font-display: swapto avoid invisible text - Test stability with Chrome DevTools’ Layout Shift debugging
Optimize Images and Media
Images often account for the largest share of page weight, making them a top priority for optimization. A slow Largest Contentful Paint (LCP) is often tied to oversized or poorly compressed media. Converting files to modern formats and tailoring them for different devices can dramatically improve both loading times and visual quality.
Practical fixes:
- Convert images to WebP or AVIF formats
- Compress with tools like Squoosh or ImageOptim
- Use
srcsetto deliver responsive images per device - Apply lazy loading for below-the-fold visuals
Enable Compression and Caching
Efficient delivery of resources ensures visitors don’t waste time downloading oversized files or repeatedly fetching unchanged assets. Enabling compression and caching directly improves both First Contentful Paint (FCP) and LCP, while newer protocols like HTTP/2 and HTTP/3 further optimize delivery speed.
Practical fixes:
- Enable Brotli or Gzip compression on the server
- Configure cache headers for static resources
- Implement service workers for smarter caching strategies
- Use HTTP/2 or HTTP/3 for multiplexing and lower latency
By applying these strategies, businesses can significantly improve their Google PageSpeed Insights score and deliver a faster, more reliable user experience. Optimizations at this level not only reduce bounce rates but also boost SEO visibility and conversion rates.
Final Thought
Optimizing site speed is a necessity for delivering a smooth user experience, ranking well in search results, and achieving business goals online. Google PageSpeed Insights makes this process more transparent by showing not only where a site stands but also what needs to change. From eliminating render-blocking resources to fine-tuning server response times and optimizing media, every improvement directly impacts user satisfaction and performance metrics.
Treating PageSpeed Insights as a continuous guide, rather than a one-time test, ensures your site stays competitive as technologies and user expectations evolve. A faster, more stable website strengthens brand credibility, drives conversions, and creates long-term digital value.