Go back to all articles

JMeter Ramp Up Period Explained

Aug 8, 2025
4 min read
author denis sautin preview

Denis Sautin

Author

Denis Sautin

Denis Sautin is an experienced Product Marketing Specialist at PFLB. He focuses on understanding customer needs to ensure PFLB’s offerings resonate with you. Denis closely collaborates with product, engineering, and sales teams to provide you with the best experience through content, our solutions, and your personal journey on our website.

Product Marketing Specialist

Reviewed by Boris Seleznev

boris author

Reviewed by

Boris Seleznev

Boris Seleznev is a seasoned performance engineer with over 10 years of experience in the field. Throughout his career, he has successfully delivered more than 200 load testing projects, both as an engineer and in managerial roles. Currently, Boris serves as the Professional Services Director at PFLB, where he leads a team of 150 skilled performance engineers.

Key Takeaways

  • Understand how ramp up period in JMeter controls thread start pacing.
  • Apply Little’s Law to size threads from TPS and response time.
  • Avoid cold-start bias with balanced warm-up and hold durations.
  • Match ramp-up profiles to cloud autoscaling windows for realistic tests.
  • Use advanced thread groups and timers for precision in load shaping.

The Apache JMeter ramp up period defines how quickly test threads start, shaping the load profile your system experiences. A poorly chosen value can distort results — too fast and you simulate unrealistic spikes, too slow and you never reach steady state. 

This guide clarifies what is ramp up period in JMeter, how to configure it, and when to adapt it for complex scenarios such as cloud autoscaling or mobile app performance testing using JMeter. You’ll learn calculation methods for ramp up time in JMeter, plugin-based enhancements, and proven patterns from large-scale performance engineering to make this setting work for your testing goals.

What Is JMeter Ramp Up Period?

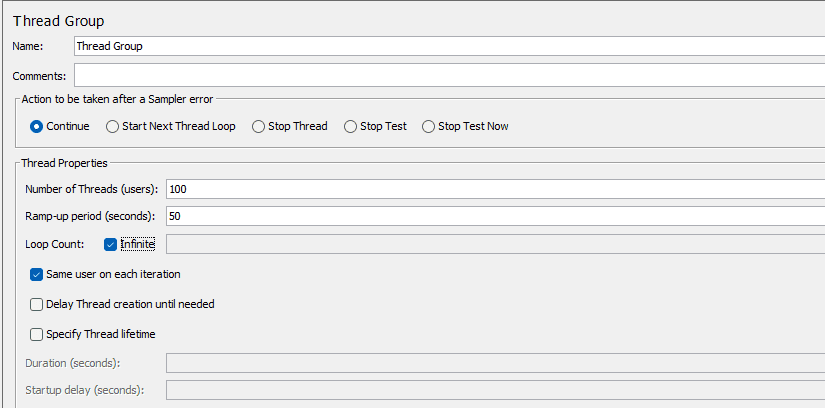
JMeter ramp up period is the total time JMeter takes to start all the threads in a test plan’s thread group. If you set 100 threads and a ramp-up of 50 seconds, JMeter will launch them evenly — about one thread every 0.5 seconds — until all are active. This mechanism controls the pace of virtual user arrival, not the throughput directly.

what is jmeter ramp up period

Its main purpose is to let your system under test (SUT) adapt gradually to increasing load, avoiding unrealistic startup spikes and giving caches, connection pools, or just-in-time compilation time to stabilize. Performance engineers often start with a ramp-up equal to the number of threads (in seconds) and then adjust based on observed server behavior and test objectives.

Ramp-up does not guarantee a specific request rate. The actual throughput depends on concurrency and cycle time, which you can estimate with Little’s Law:

Throughput (TPS) ≈ Threads ÷ (Response Time + Think Time + Pacing)

For example, if you target 200 TPS and average response time is 0.5 seconds, you need about 100 concurrent threads. The ramp-up then determines how quickly you reach that concurrency — fast for stress tests, slower for steady-state benchmarking.

Well-chosen ramp-up settings also align with real-world triggers like cloud auto-scaling policies. For instance, if AWS scaling evaluates CPU usage every 5 minutes, a 1-minute ramp-up might finish before scaling starts, missing critical insights. In such cases, set a ramp-up that spans or exceeds the evaluation window.

How to Use JMeter Ramp-Up Period

Follow these steps to set up and use the ramp-up period effectively in Apache JMeter:

  1. 1.
    Open Your Test Plan
    Launch JMeter and open your test plan. Ensure your Thread Group is added to the plan.
  2. 2.
    Set the Number of Threads (Users)
    In the Thread Group element, enter the total number of virtual users you want to simulate. This determines your target concurrency.
  3. 3.
    Define the Ramp-Up Period
    In the “Ramp-Up Period (seconds)” field, enter the total time over which you want all threads to start.
  • Example: 100 threads, 50 seconds → 1 thread starts every 0.5 seconds.
  1. 4.
    Estimate Ramp-Up Using Throughput Goals
    If you know your target Transactions Per Second (TPS), use:
    Threads ≈ TPS × (Response Time + Think Time + Pacing)
    Then choose a ramp-up that reaches this concurrency in the desired time frame.
  2. 5.
    Align Ramp-Up With Test Objectives
  • Short ramp-up → Stress/Spike tests
  • Moderate ramp-up → Steady-state performance
  • Long ramp-up → Soak tests, cloud auto-scaling validation
  1. 6.
    Add Timers If Needed
    If you need precise control over request rate, combine ramp-up with timers such as the Throughput Shaping Timer or Constant Throughput Timer.
  2. 7.
    Run and Monitor
    Execute the test while watching resource utilization, error rates, and request timings. Adjust ramp-up if your SUT warms up too slowly or peaks too quickly.
  3. 8.
    Iterate and Refine
    After reviewing results, fine-tune both the number of threads and the ramp-up period to better match production patterns.

Configuring Your JMeter Ramp-Up Period

Configuring the ramp up in JMeter is matching the load profile to your test objectives and the system’s real-world usage patterns.

1. Choose the Right Thread Group Type

configuring tour jmeter ramp up period

  • Default Thread Group — Simple linear ramp-up.

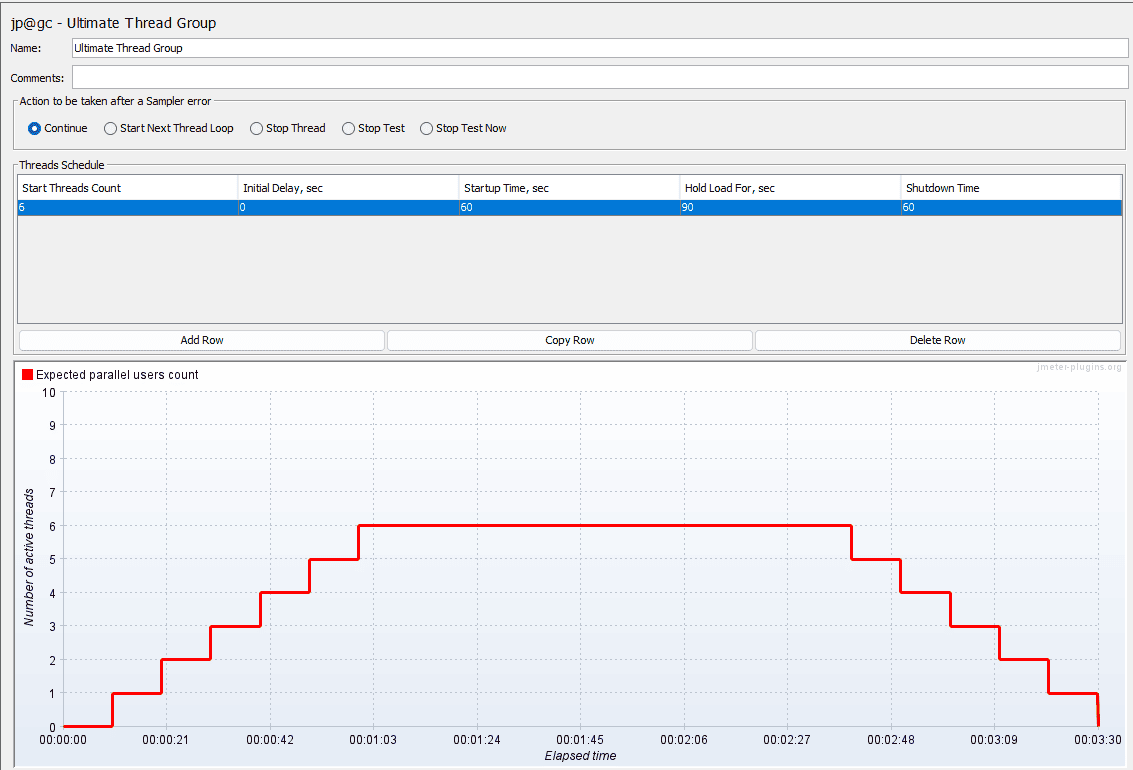
Plugins are also available:

  • Stepping Thread Group — Incremental user start with hold periods, ideal for spotting performance thresholds.
  • Concurrency Thread Group — Maintains a target concurrency, adjusting for users finishing early.
  • Ultimate Thread Group — Fully customizable schedule with ramp, hold, and ramp-down phases.

2. Calculate Thread Start Intervals

Formula:
Start Interval = Ramp-Up Time ÷ Number of Threads
Example: 60 seconds ÷ 120 threads = 0.5 seconds between each start.

3. Synchronize With Test Duration

Ensure the ramp-up time in JMeter allows all threads to start before the first ones finish their iterations. Otherwise, you’ll never reach full concurrency.

4. Integrate With Timers and Controllers

Combine ramp-up with pacing timers or throughput shaping to fine-tune load. This ensures the request rate aligns with the desired TPS, even after all threads have started.

5. Account for Environment Behavior

For distributed or JMeter in the сloud testing, match ramp-up to network latency, node startup time, and any provisioning delays in cloud-based load generators.

6. Validate Against Best Practices

  • Avoid ramp-up periods so short they cause thread start spikes and unrealistic system behavior.
  • For JMeter ramp up period best practice, include a warm-up period in your test plan before starting main measurements.

7. Document Your Settings

Always record the exact number of threads, ramp-up time in JMeter, and any custom thread group configuration for reproducibility.

Common Pitfalls and How to Avoid Them

Even experienced testers can misconfigure the ramp-up period in ways that skew results or waste test runs. Here are the most frequent issues and how to prevent them:

  1. 1.
    Setting Ramp-Up Too Short
    Launching hundreds or thousands of threads within a few seconds can overwhelm both your load generators and the system under test (SUT). The result is often connection failures or resource exhaustion unrelated to actual performance limits.

    Avoidance: Start with a moderate ramp-up and shorten it incrementally if stress testing is the goal. Monitor CPU and memory on both client and server during early starts.
  2. 2.
    Making Ramp-Up Longer Than Test Duration
    If the ramp-up exceeds the time it takes for initial threads to finish their iterations, you’ll never reach full concurrency. This leads to under-loading the system and collecting incomplete data. Avoidance: Ensure that the ramp-up time is less than your planned steady-state measurement window.
  3. 3.
    Ignoring Warm-Up Effects
    Systems often behave differently during the first few minutes due to cache fills, JIT compilation, or lazy resource initialization. If you start measurement immediately, results may reflect warm-up anomalies rather than steady-state behavior. Avoidance: Include a warm-up phase — either by discarding the first set of samples or by running an initial non-measured ramp-up.
  4. 4.
    Synchronizing Multiple Thread Groups Without Planning
    If multiple thread groups start simultaneously with short ramp-ups, you can unintentionally create unrealistic load spikes. This is especially problematic in distributed or cloud testing scenarios. Avoidance: Stagger thread group starts or use scheduling features to offset ramps.
  5. 5.
    Assuming Ramp-Up Controls Throughput
    Ramp-up schedules thread starts, not requests per second. Throughput is a function of concurrency and request cycle time. Misunderstanding this can lead to mismatched expectations. Avoidance: Calculate required concurrency using TPS × cycle time, then design ramp-up to achieve it smoothly.
  6. 6.
    Forgetting to Document Ramp-Up Changes
    Without a record of the ramp-up period and related settings, reproducing test results or comparing runs becomes difficult. Avoidance: Store ramp-up configurations alongside each test run’s results, ideally in version control.

Final Thought or Conclusion

A well-configured ramp-up period can make the difference between a realistic performance test and one that misrepresents system behavior. 

In large-scale ramp-up tuning becomes even more critical. Longer periods can help emulate gradual user adoption, while shorter bursts may be better for stress testing and finding breaking points. The right approach depends on your goals, your system’s scaling profile, and how closely you want to mirror production usage patterns.

For full reliability, document your settings, validate them against test goals, and refine over multiple runs. By treating the ramp-up configuration as a core design decision — not an afterthought — you ensure your tests are both accurate and actionable.

Table of contents

    Related insights in blog articles

    Explore what we’ve learned from these experiences
    4 min read

    Scalability Testing: A Complete Guide

    scalability testing preview
    Aug 11, 2025

    Key Takeaways When your user base grows, your application faces new challenges. Scalability testing in software testing helps you anticipate these moments clearly and confidently. Instead of guessing if your system can keep pace, you’ll know exactly how it behaves under increasing pressure. In this guide, we’ll cover precisely what scalability testing is, why it […]

    6 min read

    Performance Bottlenecks: A Complete Guide

    performance bottlenecks preview
    Aug 6, 2025

    Ever been stuck in traffic on a road that suddenly narrows from four lanes to one? That’s what a performance bottleneck feels like in your system. Everything is running smoothly until one slow process, overloaded server, or unoptimized query brings the whole flow to a crawl. In this guide, we’ll break down what performance bottlenecks […]

    8 min read

    10 Best JMeter Plugins You Need To Know

    best jmeter plugins preview
    Aug 1, 2025

    Apache JMeter is a powerful load-testing tool known for its versatility and robustness. However, even its broad functionality can be enhanced significantly by using carefully selected plugins. This article introduces the top 10 best JMeter plugins that streamline test scripting, improve reporting, and enable advanced load shaping and monitoring. Learn their key features, when to […]

    5 min read

    AI in JMeter: 3 Powerful Tools to Supercharge Your Performance Testing

    ai in jmeter preview
    Jul 31, 2025

    Performance testing with Apache JMeter is a staple in every performance engineer’s toolkit. It’s powerful, flexible, and open-source — exactly why testers worldwide rely on it. But let’s be honest: creating JMeter scripts, analyzing logs, and producing detailed reports can feel like a grind, even for experienced testers. Hours spent manually parsing data or chasing […]

  • Be the first one to know

    We’ll send you a monthly e-mail with all the useful insights that we will have found and analyzed