Key Takeaways
Throughput in JMeter defines how quickly a system can handle requests during a test. For performance engineers, it’s one of the core indicators that show whether an application can keep up with real-world demand. In this article, we’ll explore what throughput in JMeter actually measures, how it differs from metrics like concurrent users, and how to work with it effectively. You’ll see how to calculate and set specific throughput targets, use thread groups and timers, and interpret the results so your JMeter load testing produces data you can act on.
What is Throughput in JMeter?
Throughput in JMeter is the number of requests processed by the system under test per unit of time. It’s usually expressed as requests per second (RPS) or per minute, depending on the reporting format. This metric answers the question: “How many operations can the application handle in a given period without degradation?”
Its main purpose is to quantify system capacity. A stable, high throughput often means the application is handling load efficiently, while a sudden drop can signal bottlenecks or resource exhaustion. JMeter calculates this by tracking the total number of completed requests over the elapsed time in the test.
For example, if JMeter sends 1,200 HTTP requests in 60 seconds and all are completed, the throughput is 20 requests per second. This value changes dynamically during the test, reflecting both system performance and test configuration. Understanding how throughput is calculated in JMeter is key when tuning load profiles or identifying capacity limits.
Throughput vs. Concurrent Users: Comparison
Throughput and concurrent users are often mentioned together, but they measure very different things. Throughput focuses on the rate of completed requests, while concurrent users describe the number of active virtual users interacting with the system at the same time.
In JMeter reports, throughput is typically shown in requests per second or per minute. Concurrent users are tied to the number of active threads in your test plan. Both metrics matter: throughput tells you how much work the system can process in a timeframe, while concurrent users reveal how many sessions it can sustain without slowing down.
A test might show 500 concurrent users generating 50 requests per second — or just 200 concurrent users generating the same throughput if each is sending requests more frequently. That’s why interpreting one metric without the other can lead to misleading conclusions, especially when planning concurrent vs. simultaneous user testing scenarios.
Comparison Table: Throughput vs. Concurrent Users
| Basis | Throughput | Concurrent Users |
| Definition | Number of requests processed per unit time | Number of active virtual users at a given moment |
| Measurement | Requests/second (or minute) in JMeter reports | Active thread count in JMeter |
| Focus | Work rate of the system | Load generated by simultaneous users |
| Representation | Numeric rate in reports and graphs | Active user count in reports |
| Impact | Shows processing capacity and stability | Shows user load handling ability |
| Assessment | Compare against SLA or target RPS | Compare against expected peak user counts |
If you want precise control, JMeter lets you adjust both variables independently. You can hold the number of concurrent users constant while increasing throughput with timers — or keep throughput constant while scaling user counts to study how concurrency affects response times.
How Throughput in JMeter Works
Throughput in JMeter is calculated based on the number of completed requests over the elapsed test time. The calculation is simple:

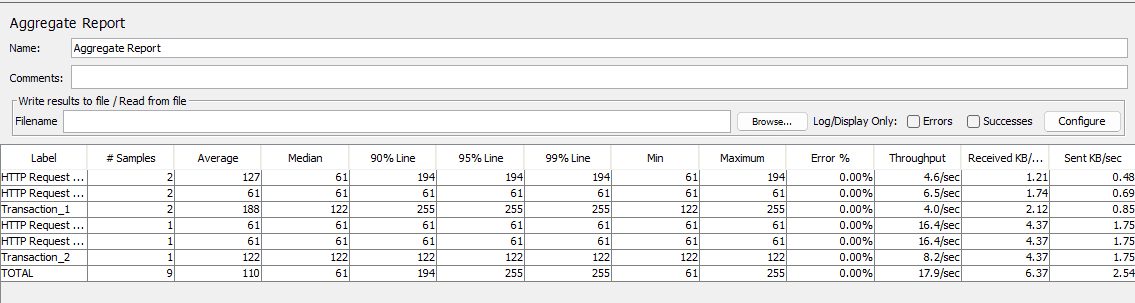
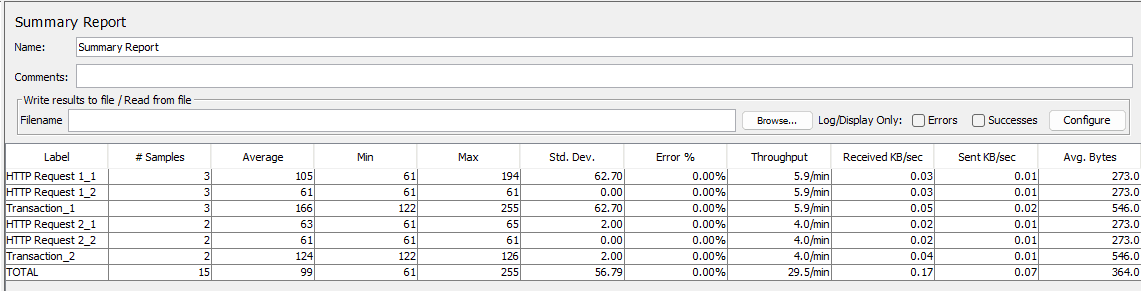
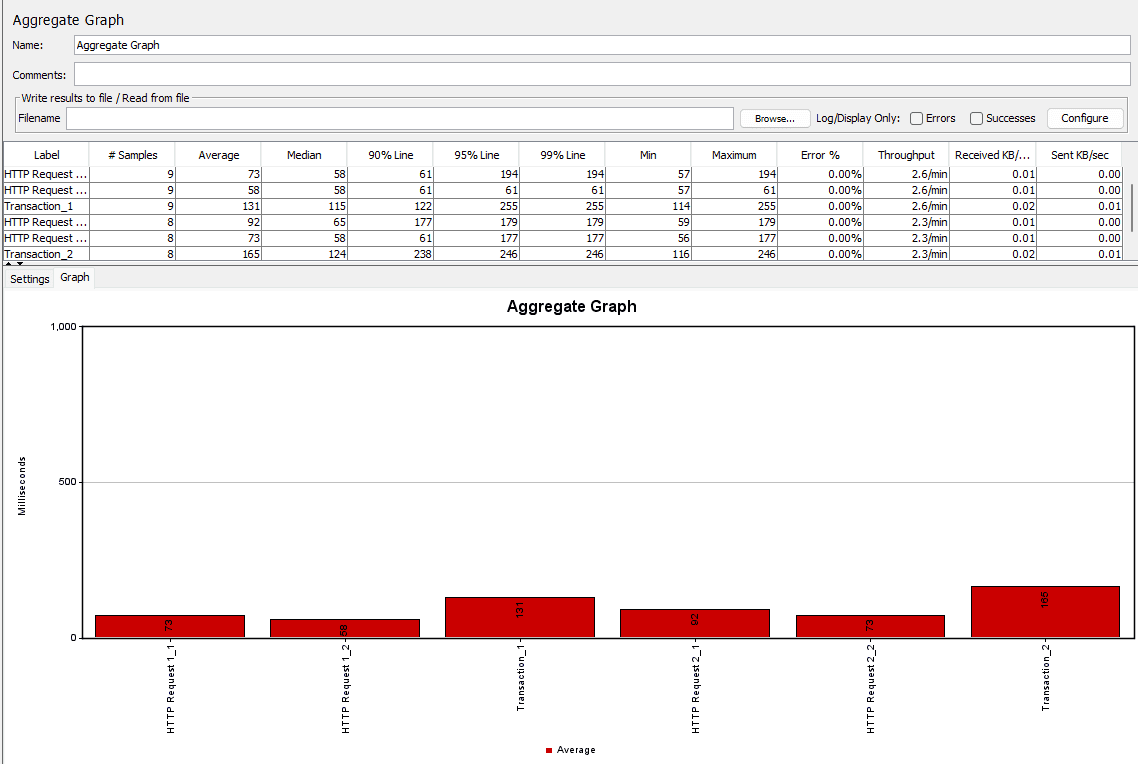
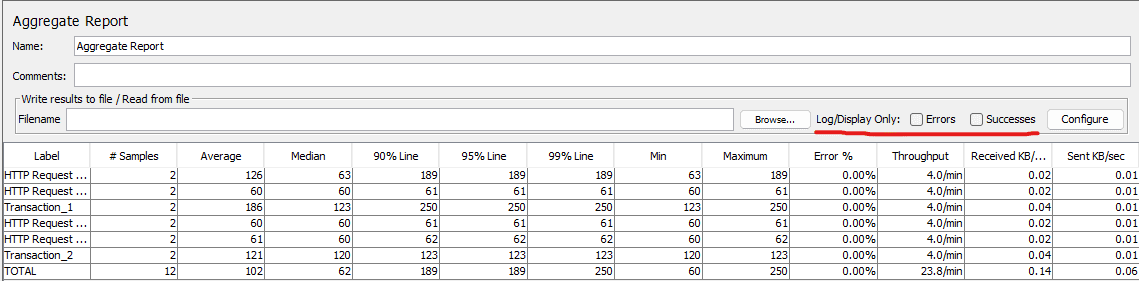
JMeter reports this metric in listeners like the Aggregate Report or Summary Report, adjusting the unit (seconds/minutes) depending on your display settings. The number you see isn’t static — it fluctuates as the test progresses based on thread activity, timers, and system responsiveness.
Measuring Throughput in JMeter
To monitor throughput during a test, you typically use:
You can decide to include failed or interrupted requests in the reported throughput.
Using Thread Groups for Throughput Control
Thread groups determine the number of concurrent virtual users and their ramp-up speed. While more threads can raise throughput, it’s not a direct 1:1 relationship — the actual throughput also depends on request frequency and server capacity.
Example:
Misconfigurations, like overly aggressive ramp-ups, can cause spikes in throughput that don’t reflect realistic traffic, leading to misleading results.
Using the Throughput Timer
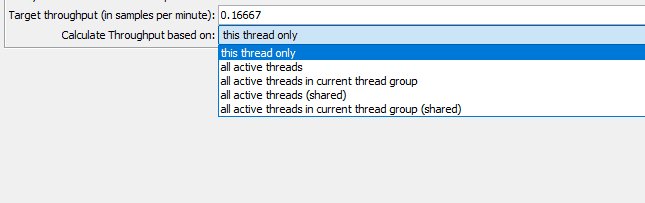
The Constant Throughput Timer in JMeter lets you target a specific request rate and control how it’s applied. Instead of always being global, you can configure the scope in the “Calculate Throughput based on” option:
For example, if you set 100 requests/minute:
Example: Setting a Desired Throughput in JMeter
How it is usually done:
Timers in JMeter pause before every sampler in their scope, and if you have more than one, their delays sum up. So in real projects, testers usually add timers within JMeter’s Flow Control Action:
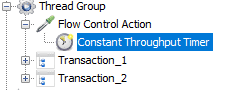
This way you control throughput of the whole group of requests. The whole Thread Group will run the number of times you set in the Constant Throughput Timer.
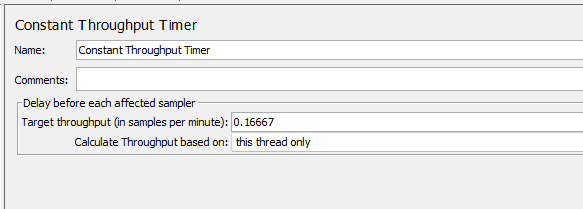
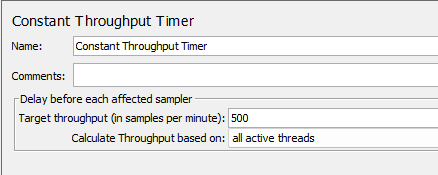
Constant Throughput Timer config screenshot:
By combining thread configuration with timers, you can fine-tune how throughput is calculated in JMeter and match your test’s traffic model to real-world patterns.
How Throughput Affects Performance Measurement
Throughput isn’t just a standalone number — it shapes how you interpret almost every other performance metric. When throughput changes, it often triggers shifts in response times, error rates, and resource usage patterns.
A higher JMeter throughput usually means the system is processing more requests within the same time window. If response times stay low and errors don’t increase, that’s a sign the system is handling the load well. But if throughput climbs while latency rises sharply or errors spike, it may indicate that you’re approaching capacity limits.
For performance testing, throughput helps:
In practice, throughput is most valuable when analyzed alongside other metrics. Looking at it in isolation can mask underlying issues — a stable throughput might hide a growing latency trend that will break the system under peak conditions.
Practical Examples & Tips from Engineers
Example 1 – Controlling Throughput for an API Test
You need to simulate 500 requests per minute to an API, evenly distributed across 10 virtual users.
Configuration in JMeter:
1. Thread Group: 10 threads, ramp-up 10 seconds, loop indefinitely.
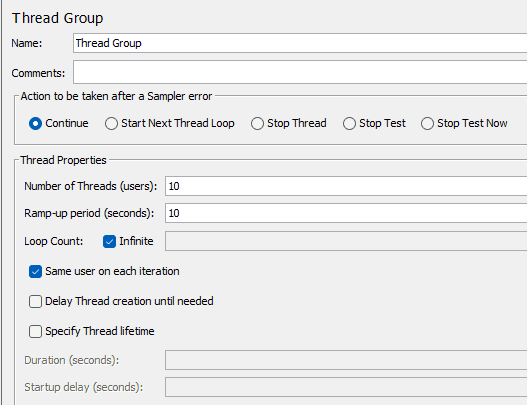
2. Constant Throughput Timer: Set target throughput to 500 requests/min and apply to all active threads.
3. Use Aggregate Report to confirm achieved throughput. If measured throughput is lower, increase threads or reduce average response time (for example, by mocking slow dependencies).
Example 2 – Testing at Capacity Limit
Service level agreement: 200 RPS with latency under 500 ms.
You run a test with 50 threads, each sending requests as fast as possible:
Throughput drop percentage = (210 – 175) ÷ 210 × 100 = 16.7%
The drop coincides with latency exceeding the SLA, indicating the system is beyond its sustainable limit.
Example 3 – Thread Group Impact on Throughput
Two configurations producing the same throughput:
Throughput is identical, but the load profile differs. Config A keeps more connections open, stressing memory and connection pools, while Config B puts more pressure on request-processing speed.
Tips for Better Throughput Control in JMeter
Final Thought
Throughput in JMeter is a practical metric: it shows how many requests your system can process over time under specific conditions. Interpreting it correctly means looking at it alongside latency, error rate, and resource usage.
The most reliable results come from tests where throughput targets are planned, test configurations match real traffic patterns, and measurements are cross-checked against service-level expectations. With the right setup, throughput becomes a dependable indicator of whether your system can handle the load you expect in production.