JMeter performance testing services doesn’t need to be advertised; nonetheless, not enough attention is paid to the load script speed. In this article, we look at different approaches to writing load scripts in an optimal way that saves money on the load testing machines.
This article will be useful for load testing engineers and Apache JMeter users (beginners and advanced), as well as for developers using JVM/JDK, profiling, and code optimization.
After reading the first part of the article, we suggest you enjoy the second part.
If you’re interested in exploring other tools, check out our article on JMeter Alternatives, where we compare the top options to help you find the best fit for your performance testing needs.
Key Takeaways:
More about Apache JMeter
Apache JMeter is a popular load testing tool that provides various components and settings. An operation can be executed in several ways during load testing using JMeter.
Load script performance comes to light in projects with high loads. We need a system of measurement for the Apache JMeter component performance and approaches to load script writing that optimizes the load script performance.
We’ve used Java app profiling tools such as Java Flight Recorder, jVisualVM, and SJK for this Apache JMeter load testing tutorial. We also had access to the tool’s source code. Additionally, we have written synthetic tests and analyzed project experience.
Here are the most important facts about Apache JMeter:
Load Agent
Whether you run the tests locally or in the cloud, for a quick run you’ll need to prepare a station and configure JMeter for load testing (read more about best JMeter cloud service). The preparation process consists of several important steps, which we will discuss in our Apache JMeter load testing tutorial.
Agent monitoring
Telegraf, InfluxDB, Grafana
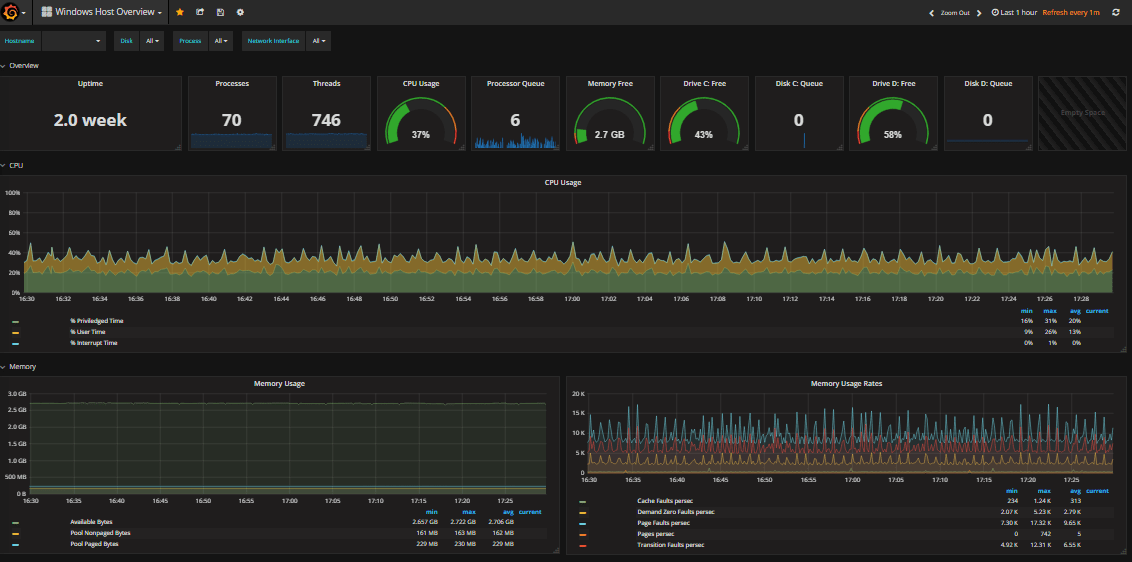
To begin, you need to configure the agent monitoring. If you haven’t done this yet and have only monitored the target load system, there is a simple solution for Windows OS. Go to the Grafana’s site, dashboard 1902. There is a Telegraf tutorial on configuring metrics in the dashboard’s documentation.
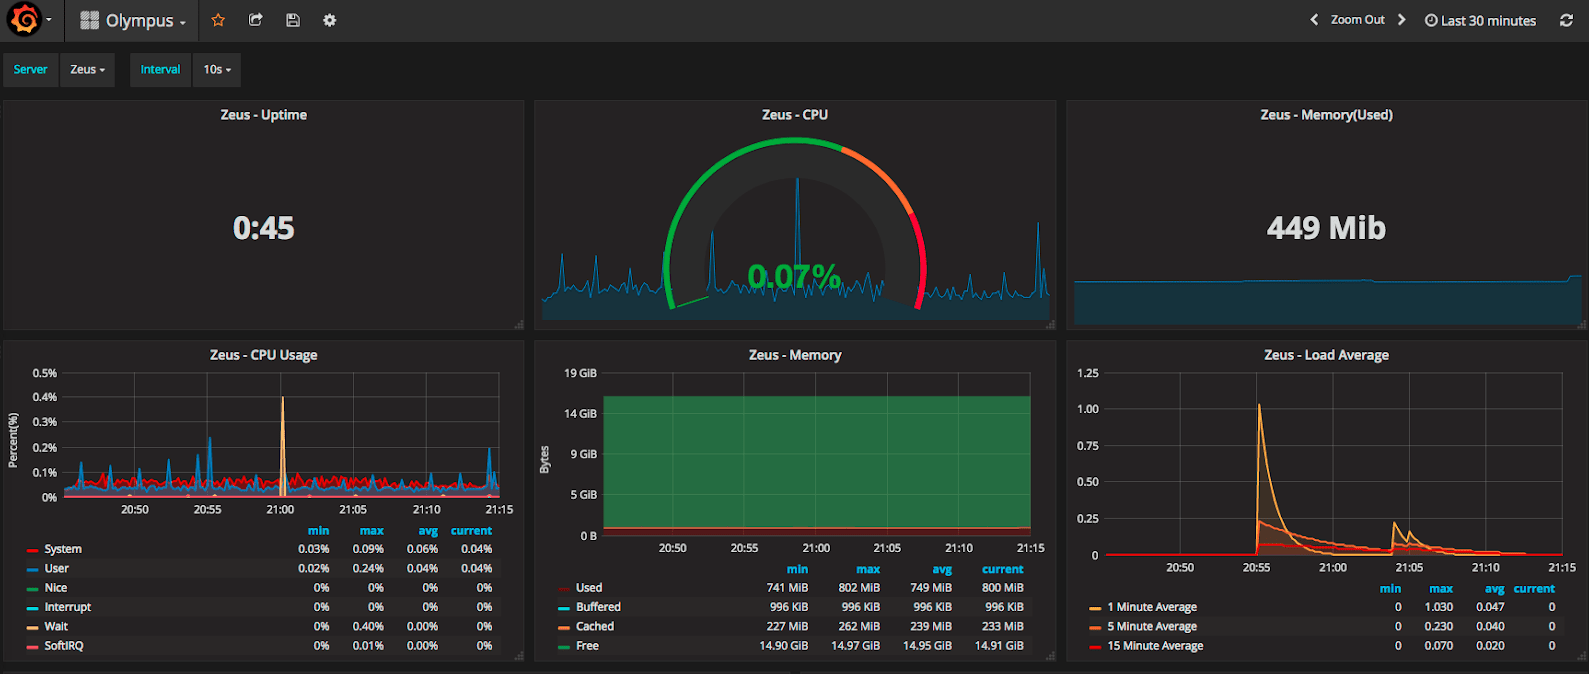
Telegraf, InfluxDB, Grafana
Board 2381 suits Linux well because it allows the creation of handy graphics for quick analysis of load station problems.
Network in Windows
If you work in Microsoft Windows, don’t forget to configure the network subsystem. A Windows network subsystem is configured by default so your system can’t pass a virus or a worm to another computer. The restriction takes place on both client and server platforms. Three simple parameters must be adjusted to lift the restrictions and configure JMeter for load testing. They can be found in the register …ServicesTcpipParameters for the network subsystem.
…ServicesTcpipParameters
| Key | HKEY_LOCAL_MACHINESYSTEMCurrentControlSetServicesTcpipParameters |
| Value | MaxUserPort |
| Data Type | REG_DWORD |
| Recommended | 65534 |
| Default | 5000 |
| Range | 5000 to 65534 |
The first parameter is called MaxUserPort. It increases the port range that can be accessed from your IP address. Each Internet network connection is defined by four numbers: the sender’s IP address (your address), the sender’s port (your port), the receiver’s IP address, and the receiver’s port. The maximal number of connections is limited by the range of ports that can be opened from one station. It is within the range of 1024 to 5000 by default. We need to set this value to its maximum so that more connections are allowed. As a result, Apache JMeter load testing performance will be increased.
…ServicesTcpipParameters
| Key | HKEY_LOCAL_MACHINESYSTEMCurrentControlSetServicesTcpipParameters |
| Value | TcpTimedWaitDelay |
| Data Type | REG_DWORD |
| Recommended | 30 |
| Default | 240 |
| Range | 30 to 300 |
The second parameter that influences the performance is TcpTimedWaitDelay. It allows faster closing of half-opened connections.
…ServicesTcpipParameters
| Key | HKEY_LOCAL_MACHINESYSTEMCurrentControlSetServicesTcpipParameters |
| Value | TcpFinWait2Delay |
| Data Type | REG_DWORD |
| Recommended | 30 |
| Default | 120 |
| Range | 330–294,967,295 |
The third parameter is TcpFinWait2Delay. It allows the freeing of opened connections that are no longer required. As a result, your system’s performance on Windows will double after applying the settings above.
Network in Linux
Please pay attention to the first rule about changing the settings: we change them one by one to configure JMeter for load testing. If changing one of them has not helped to achieve your goal, we revert the parameter value.
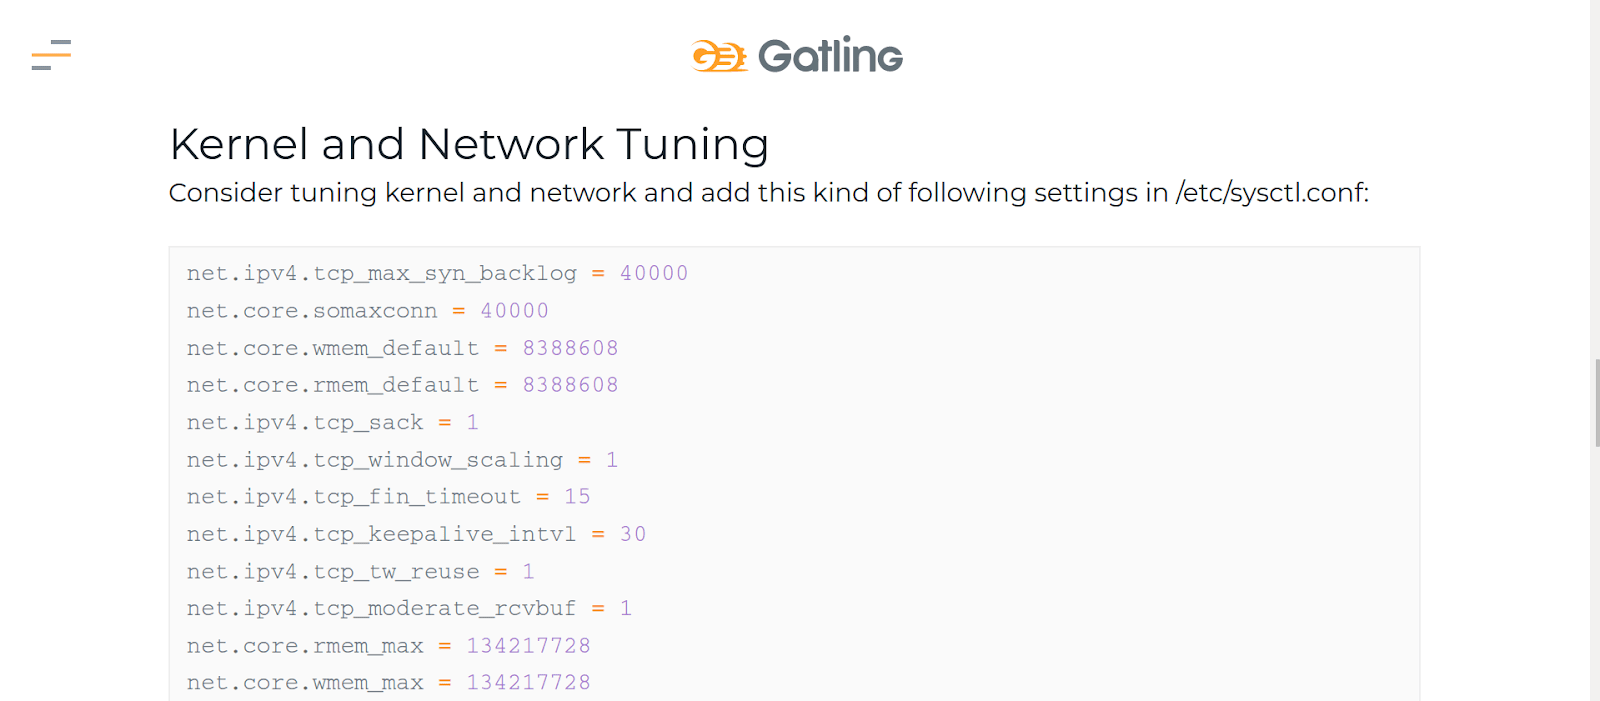
Gatling tutorial
If you’d like to read some valuable advice, it’s worth checking out the Gatling tutorial. It explains how to configure everything, including the network connections and the operational system’s limitations.
Limitations on Linux
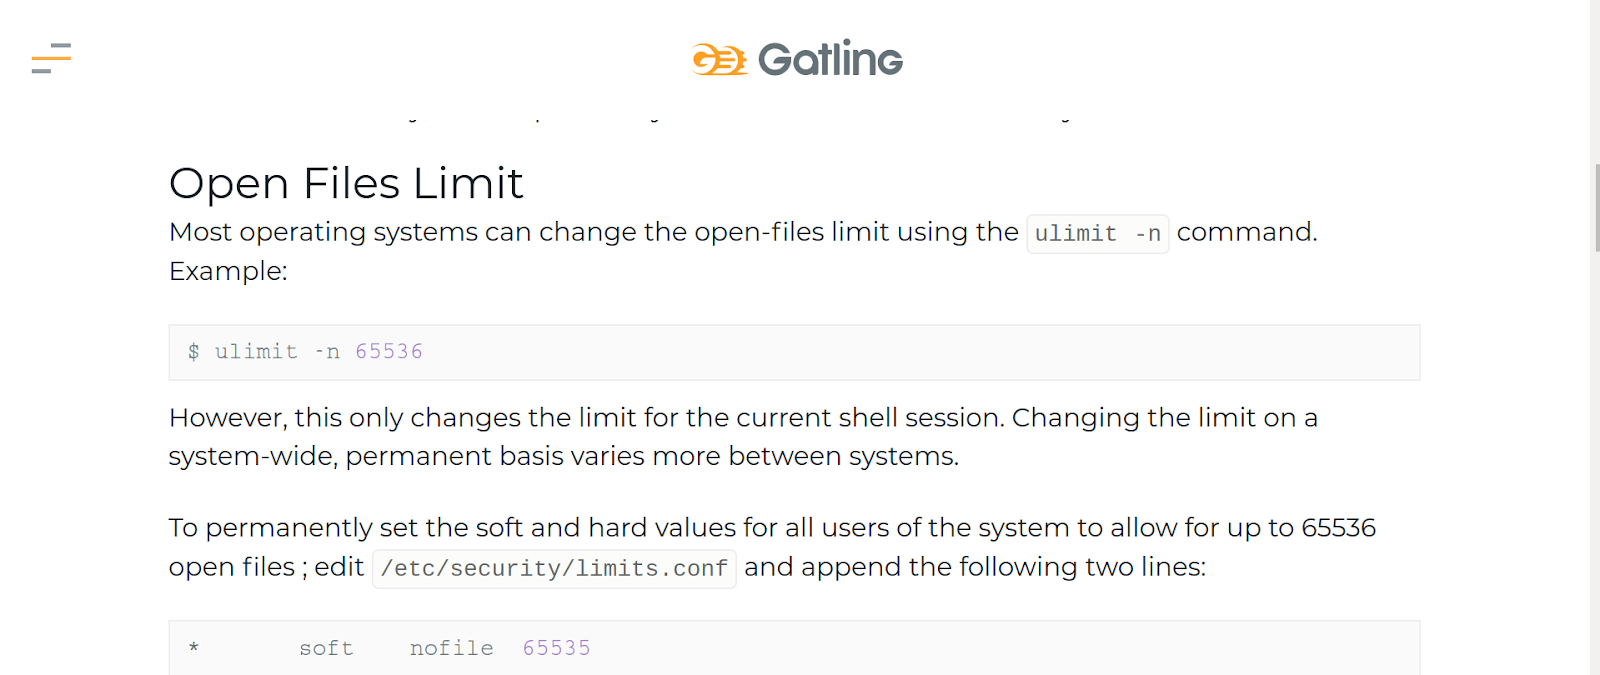
All is a file
It’s important to keep in mind that in the Linux OS everything is a file. If you have established a network connection and opened a socket, then you have used a disk. You may reach the maximal number of opened files and processes. We will need to optimize them. This is the first step in preparing JMeter tests.
JMeter settings
The file JMeter Properties or User Properties is with JMeter configuration files in the bin folder. You need to pay attention to two parameters that will help you to solve some problems and optimize JMeter load testing. The first parameter is httpclient.reset_state_ …; the second is httpsampler.max_bytes_ ….
JMeter, in particular HTTP Request, closes the connections after each script iteration by default. Consequently, the connections do not have enough time to reopen on short, quick tests.
Generally, JMeter runs a test iteration by default in the following way: after the connection has been established, the script makes requests and closes the connection. In the next loop, the OS sends the request to establish the connection again. In this way, you are also testing the load balancer. The parameter “Same user on each iteration” changes that behavior. It’s available in JMeter versions 5.4 and newer in the standard Thread Group.
The parameter httpclient.reset_state_ …
Your station with one IP address and a limited port range may not sustain the desired load. The connections may not have enough time to open. The simple solution is to leave open the connection between two iterations. This action can be applied if it’s not necessary to test the load balancer with respect to connection establishment performance.
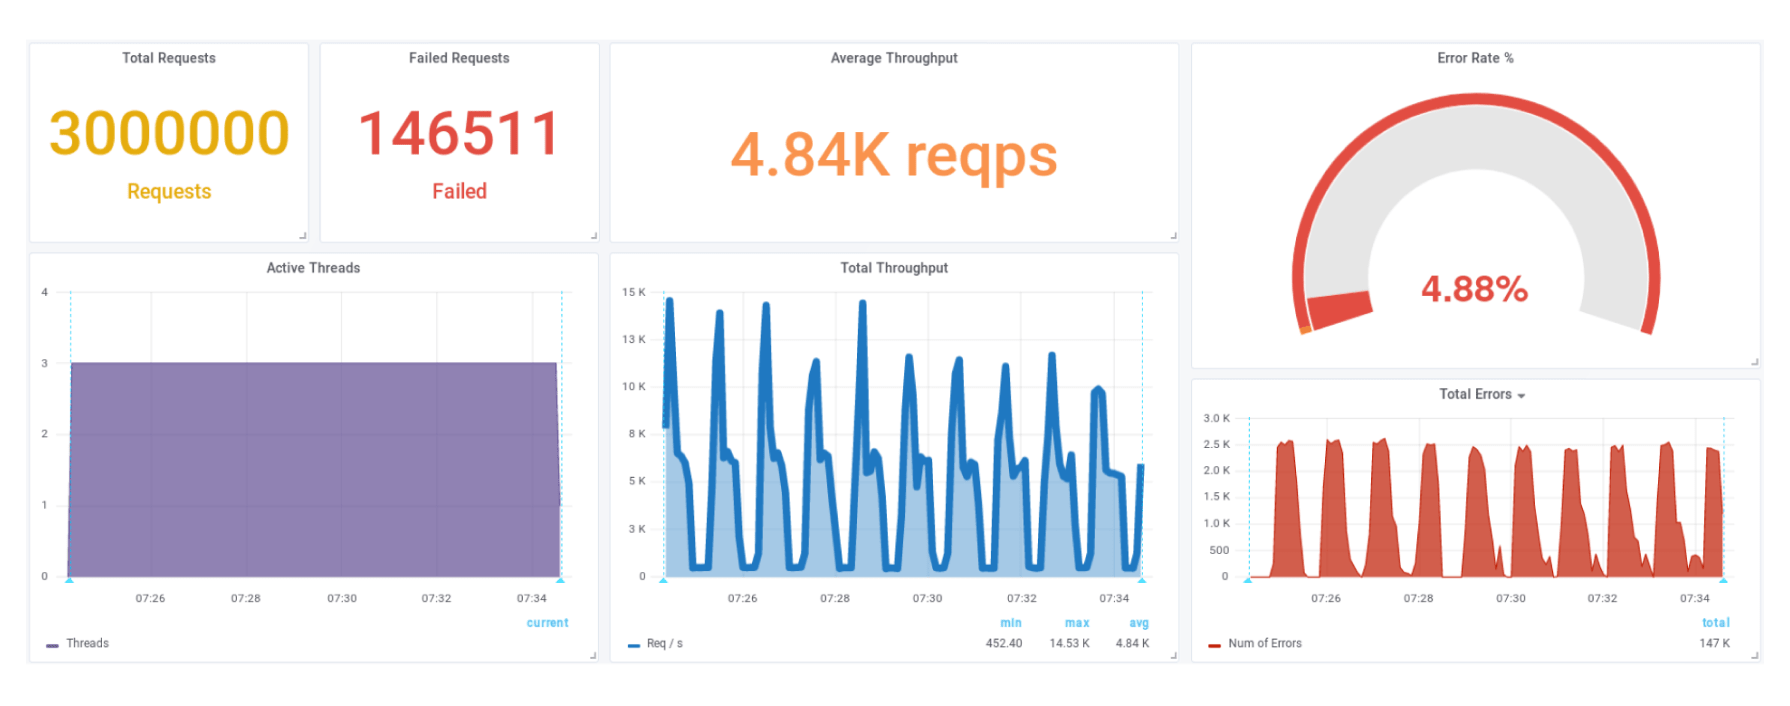
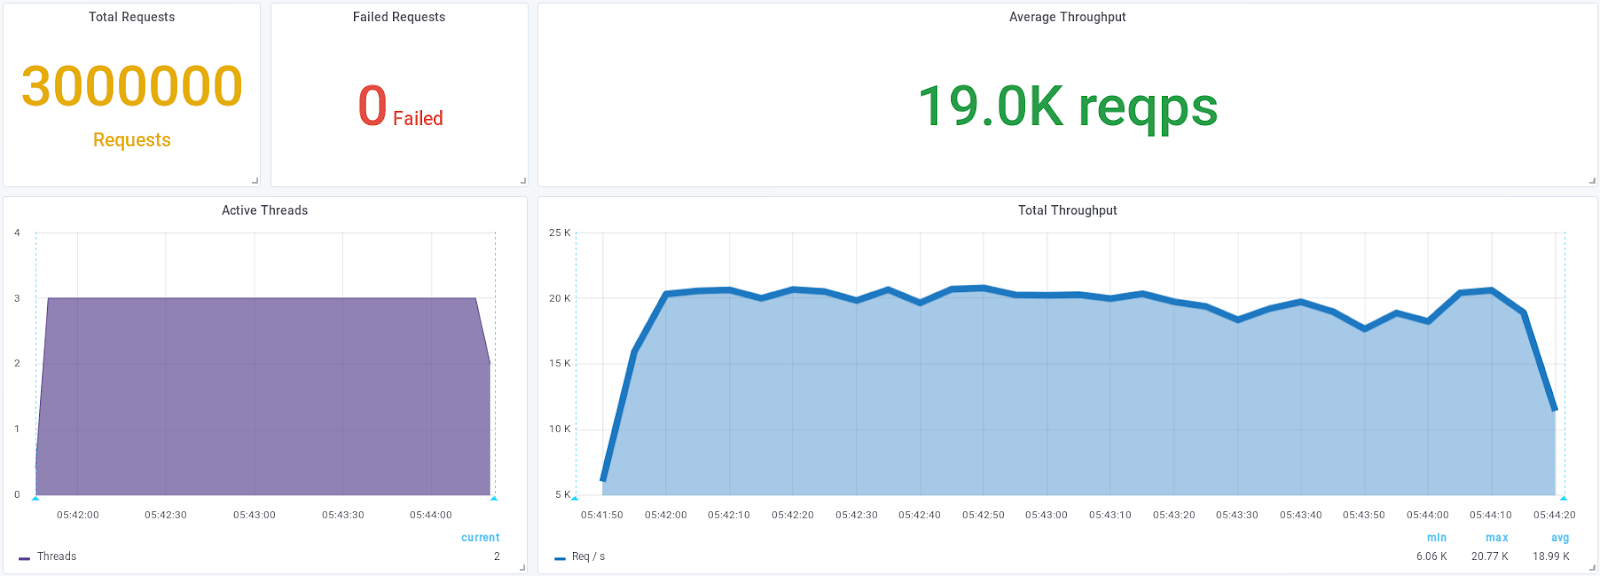
After you’ve created a thread, a connection has been opened. If you have set the parameter to False (httpclient.reset_state_on_thread_group_iteration=false), then you will have a correspondence of 1000 threads to 1000 connections. Your test performance will improve by 3.9 times, and load testing using JMeter will become faster.
httpclient.reset_state…
If the intensity changes
The intensity function on the synthetic tests fluctuated and had a mean of 4.84 thousand.
httpclient.reset_state_ …
Speeds up a test up to 3.9 times
After changing the parameter, the result was 19 thousand, and it was less fluctuated. If you don’t close the connections, a graph will be generated that is not fluctuated, has high intensity, and has no errors.
If there are no HTTP errors, neither the HTTP response code ‘java.net.NoRouteToHostException’ nor the HTTP response message ‘Address not available’ will be returned.
JMeter load testing, in particular HTTP Request, requires a great deal of memory by default (the buffer is four times bigger than the file itself). It follows that you can’t download 1100 MB with a heap of 4 GB while generating objects with 1.8 GB/sec. JMeter downloads the complete response body, even when the post-processors won’t use it. So, you don’t necessarily need the 4 GB of heap.
The parameter httpsampler.max_bytes_
This property defines the number of bytes that will be used by post-processors. It’s not limited by default. Don’t store the entire response when downloading megabytes. We can limit it to a reasonable size (e.g., 555 000 bytes (httpsampler.max_bytes_to_store_per_request
=555000)). This is enough for the post-processor. It will find everything needed without wasting the memory. This change will allow you to achieve significant results in speeding up Apache JMeter load testing.
httpsampler.max_bytes_ …
If there wasn’t enough memory
Firstly, the “OutOfMemoryError: Java heap space” error will be remedied. Secondly, you’ll speed up the response download time owing to the shorter response body.
httpsampler.max_bytes_ …
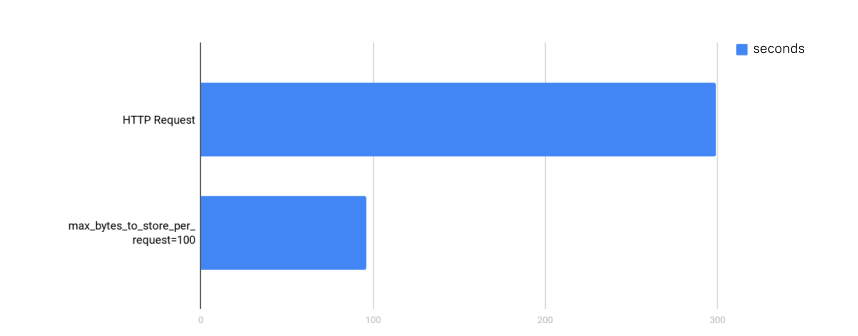
Speed will be increased by 3 times
The duration of the download 1 GB 200 times (seconds)
httpsampler.max_bytes_ …
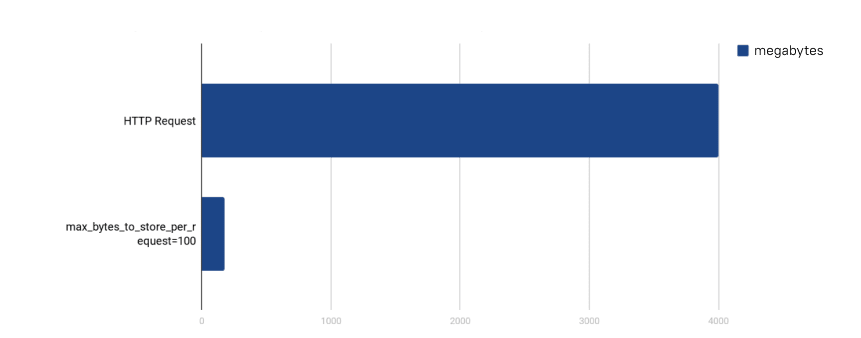
Memory will be decreased by 22 times
Memory used when downloading 1 GB 200 times (Megabytes)
The download speed of 1 GB increases up to 3 times, and the memory utilization decreases by up to 22 times on a synthetic test. In other words, you decrease the buffer and JMeter wastes 180 MB. If you don’t, it wastes 4 GB while downloading 1 GB.
JMeter components
You can combine certain JMeter components and component configurations to achieve a better performance. They should suit each other and be correctly configured for load testing using JMeter.
Samplers
We don’t recommend the BeanShell sampler and its components, opting instead for JSR-223 with Groovy and cache.
HTTP Request and Body Data
File Path and Request Body
Some users create a large XML variable and insert it into Body Data HTTP Request to send a large request with a big request body. This takes a huge amount of memory and slows down processes.
HTTP Request and Body Data
File Path and Request Body
Instead, we recommend indicating that a static request body is loaded from the file. This approach doesn’t load the data into the memory and allows reading from files, even a request body with a size of 300 MB. To use this approach, fill in File Path in File Upload, leave other parameters empty (Parameter Name and MIME Type), and don’t activate the Use multipart/form data check-box. Your JMeter won’t fire the OutOfMemory error.
HTTP Request and Resources
load an average of a third
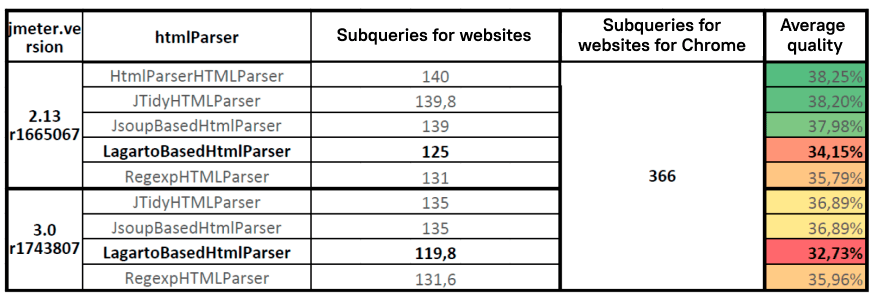
Sampler JMeter doesn’t recognize links to statistics well; it recognizes about 33% of the links on an average site. At this stage, we recommend performing optimization and configuring JMeter for load testing.
All sites use images from other domains, such as Google and Facebook, as well as different kinds of metrics. If you don’t have enough resources in your load station networks, we recommend economizing on the requests to search engines and social networks. You need to remove them from the list of loaded resources and keep only the CSS that addresses your host. It’s the most evident and quickest fix possible.
HTTP Request and Resources
with domain filtering
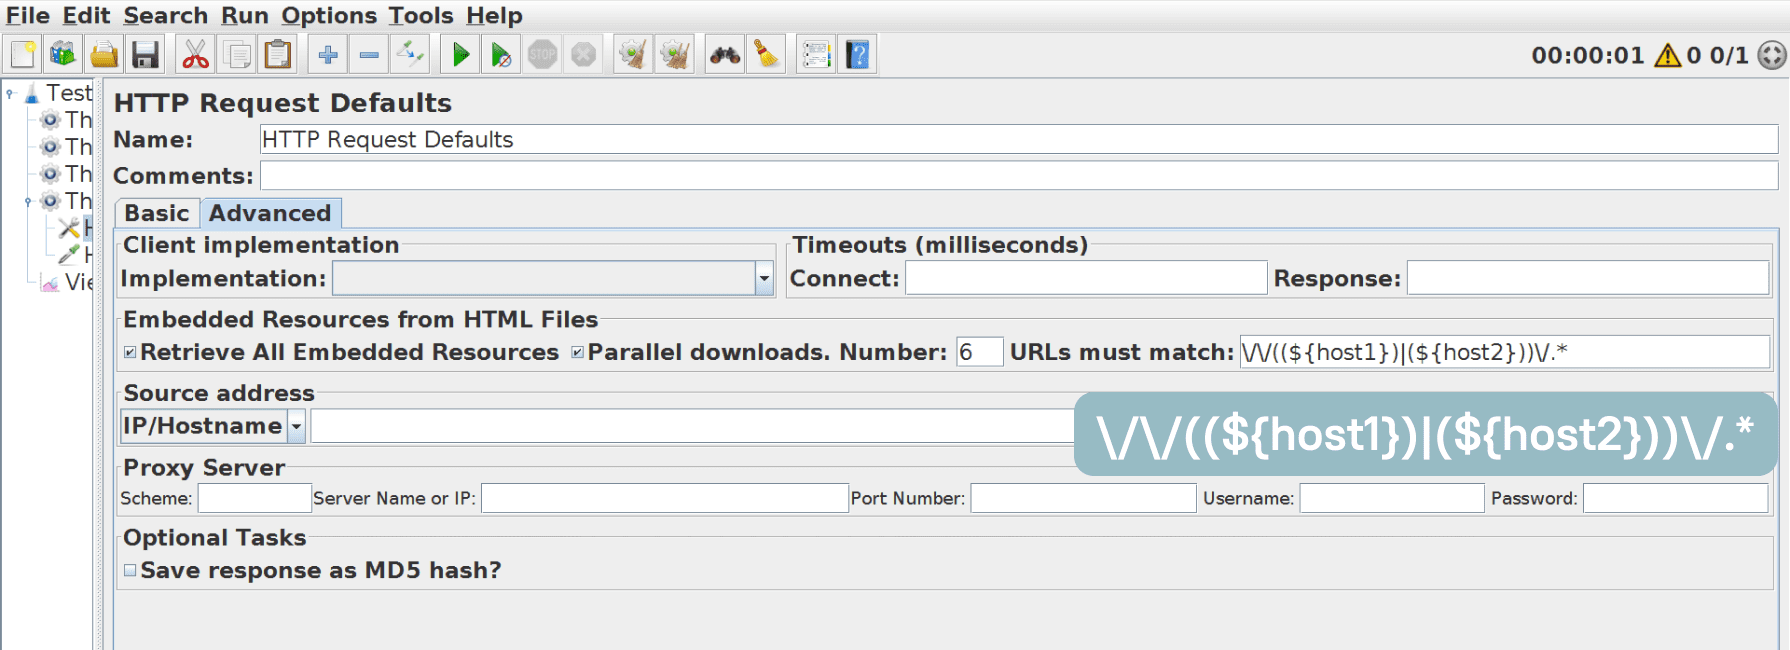
You can use a regular expression that chooses the host list from the URLs Must Match parameter, which can be found in the “Embedded Resources from HTML File” list. Here is an example of the regular expression:
//((${host1})|(${host2}))/.*This way, you won’t overload either JMeter or the broadband, save resources, and provide a higher load capacity on the tested server.
HTTP Request and Resources
with domain filtering
Logic Controllers
Transaction Controller
with the Generate Parent Sample
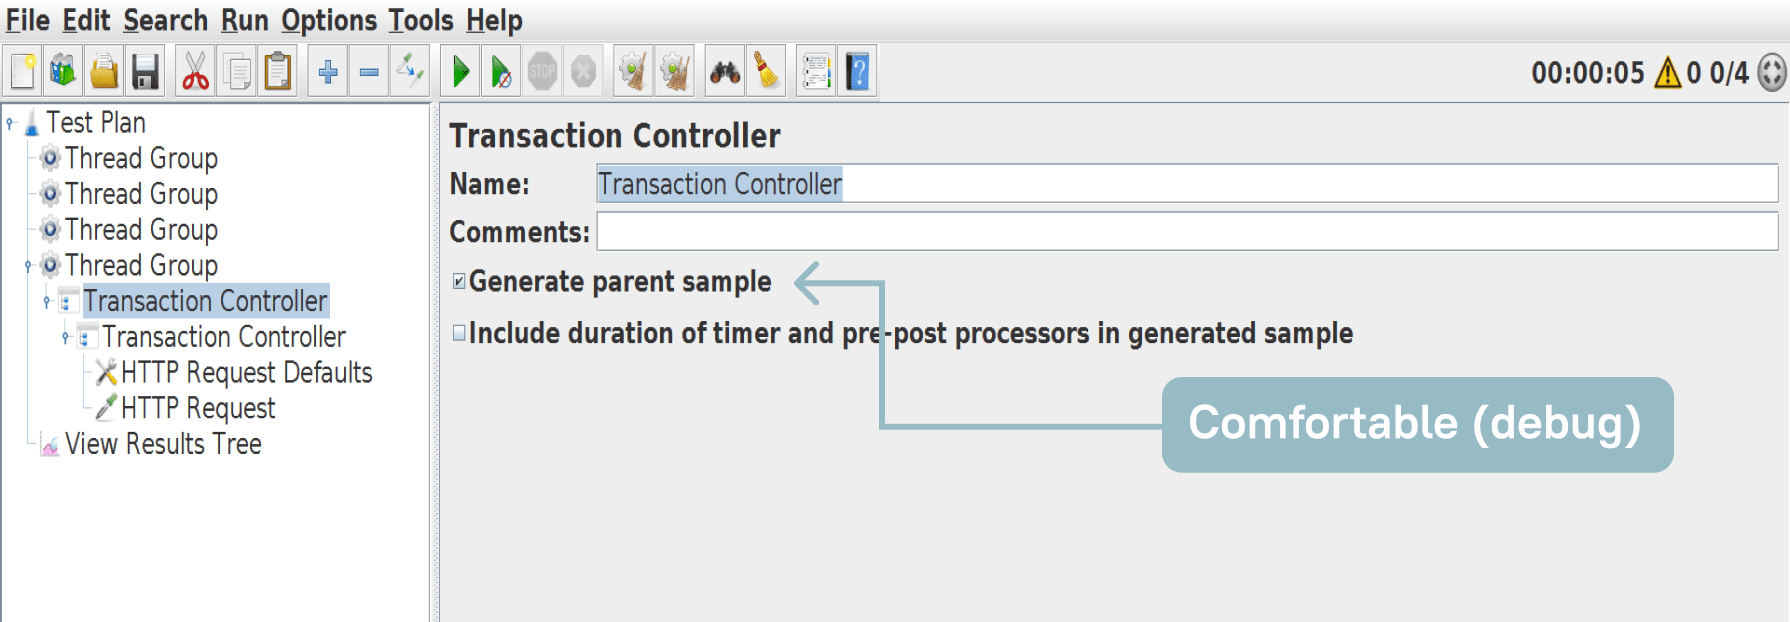
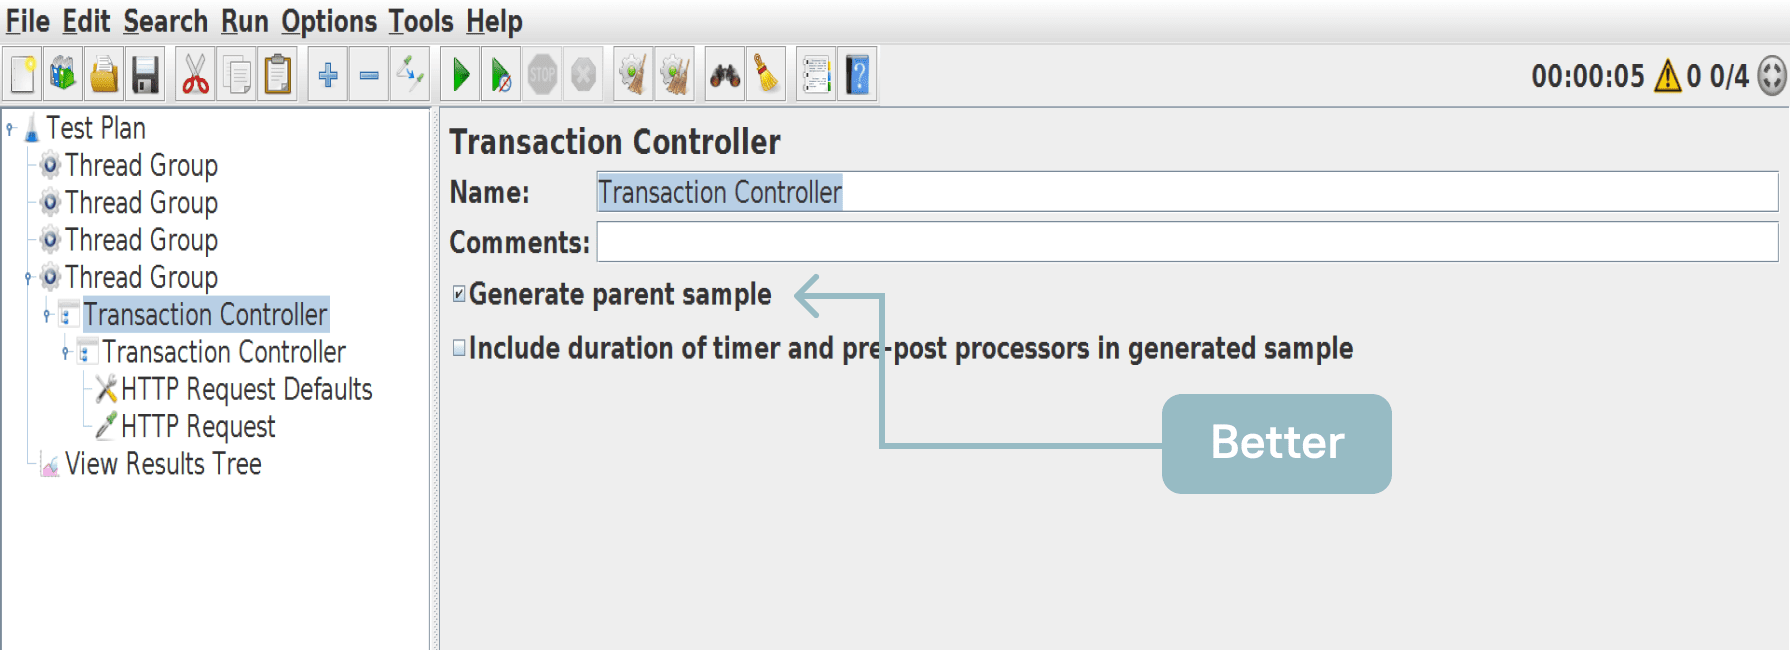
It’s convenient when the requests are grouped into transactions and are displayed as the View Results Tree. This is handy for debugging, but you must deactivate this functionality before starting a test.
Transaction Controller
with the Generate Parent Sample
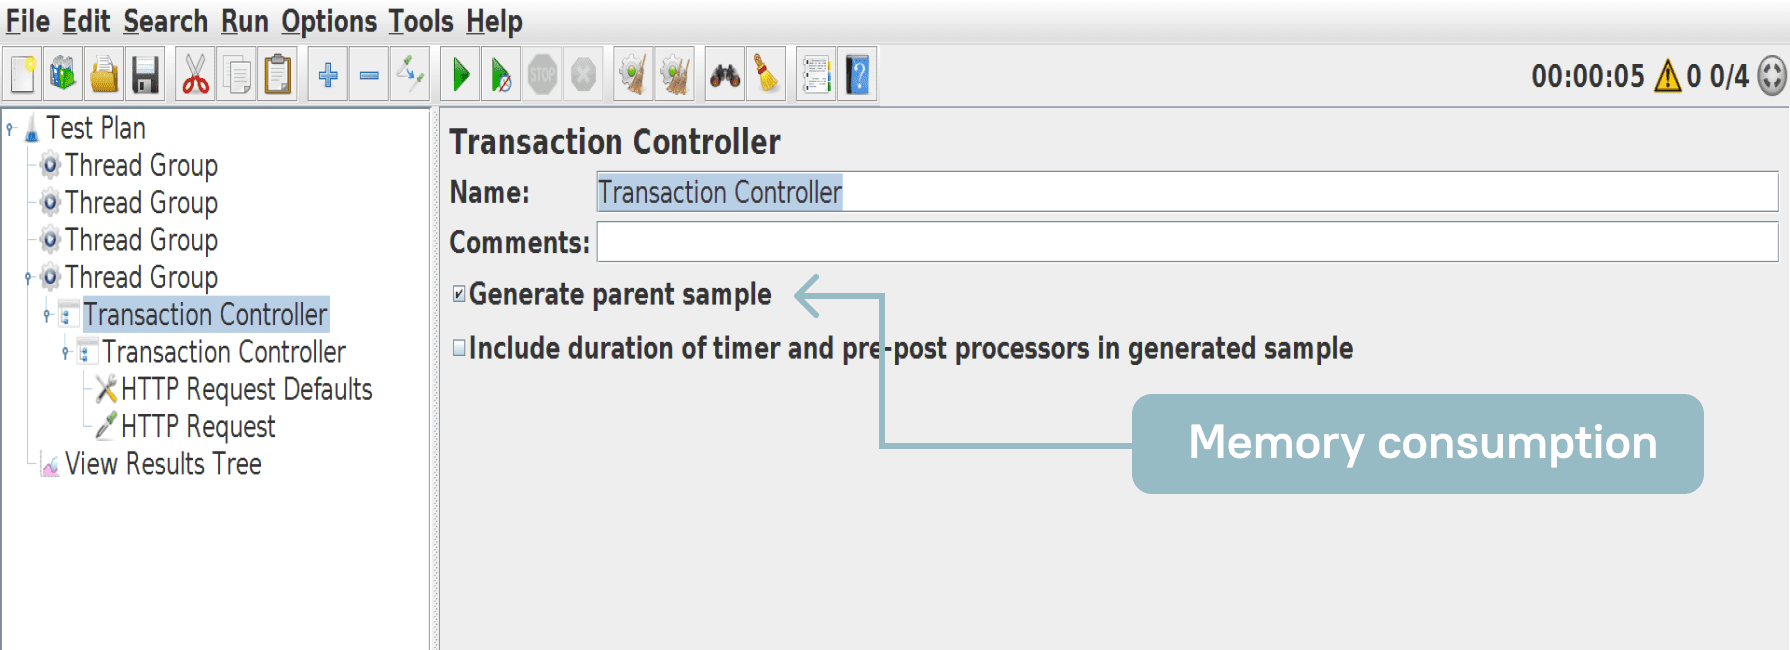
If you don’t deactivate this functionality, JMeter will save everything in the memory before sending all saved results with the request bodies and statistics to the next recipient. For example, if a transaction contains 10 requests, all of them are saved in the memory and only afterward discarded. However, the number of requests can be 5 times as big. Each thread will save multiple responses and discard them slower, slowing down the test itself.
Transaction Controller
without the Generate Parent Sample
Therefore, we recommend deactivating the Generate Parent Sample in the Transaction Controller before starting Apache JMeter load testing.
Listeners
File with Save as XML is excess
CSV format is enough
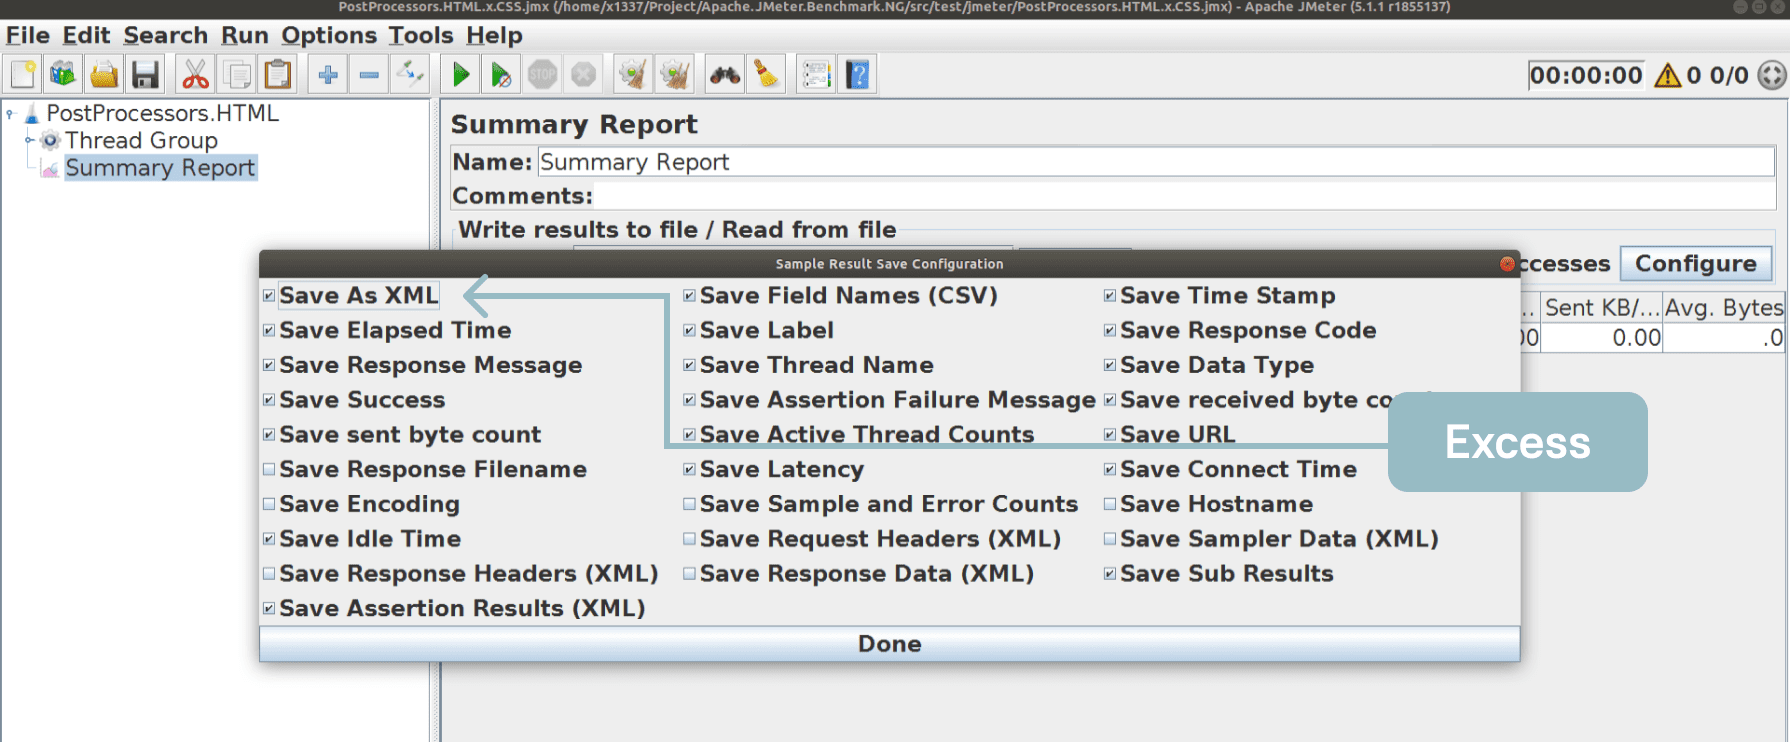
It used to be good practice to use Save as XML and save all response bodies when the server responded with an error. However, we don’t recommend doing so (by ticking the checkbox) because reviewing errors in the CSV format is sufficient.
Assertions
We recommend using assertions to configure JMeter for load testing. If you send requests and don’t check the responses, then your load test is faulty. Another reason to implement them is if those assertions don’t weigh much.
Use Assertions
but not with Continue
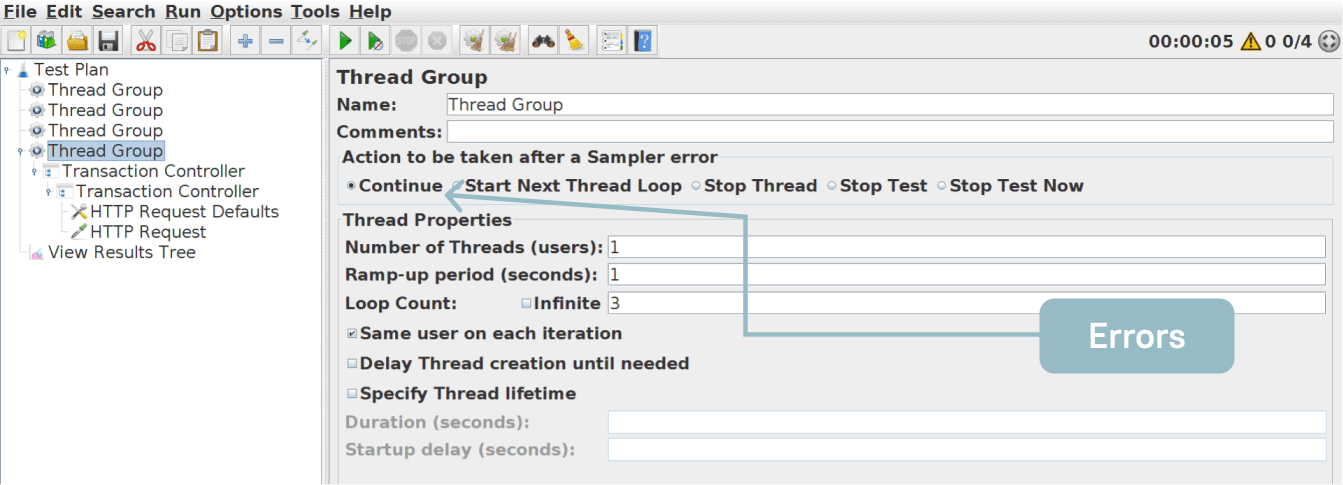
All thread groups continue test execution by default after an error. This way, although you have set an assertion and it has been fired, the test execution continues, and your results are mixed with the errors from the other 10 requests. As a result, you receive a log file with 50 errors but need only one to find a functionality bug. You may waste time solving this problem.
Use Assertions
with Start Next Thread Loop
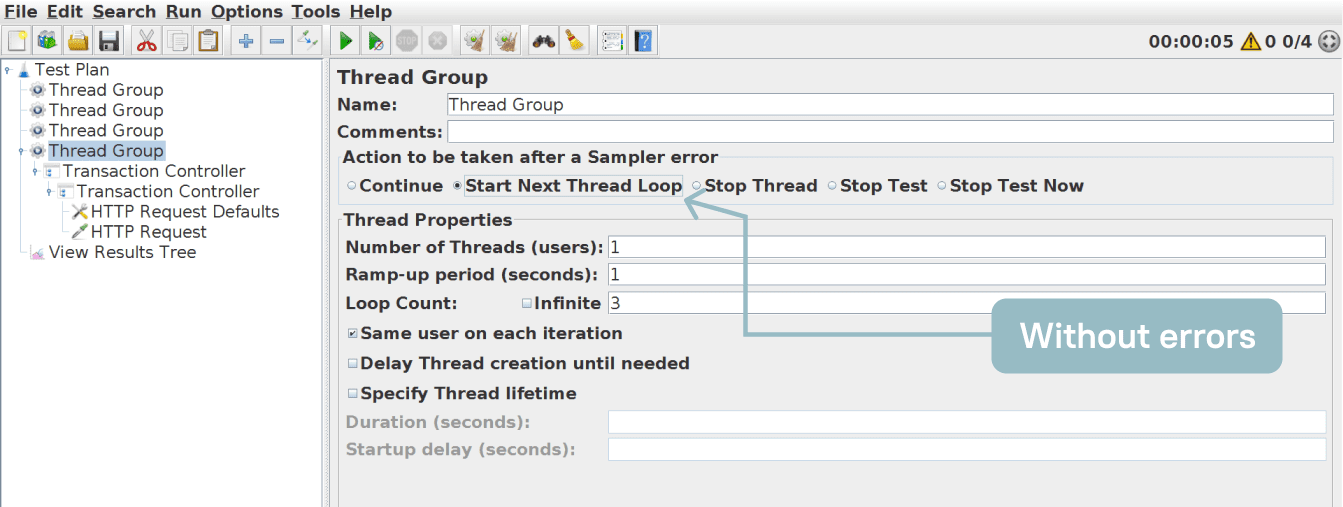
The better option is to activate the Start Next Thread Loop checkbox when using assertions. If there is an error, the test will go to the next iteration. This way, you will avoid unnecessary data during JMeter load testing.
Post-Processors
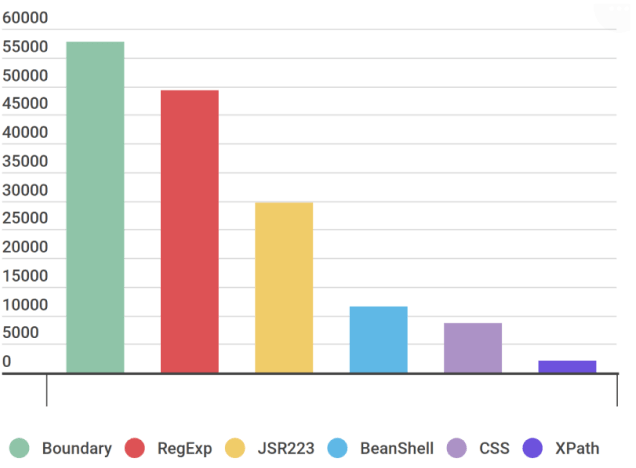
Boundary and RegExp are fast
Max RPS in a text / More – better
Let’s take a look at the post-processors available for HTML and their work intensity when they are used on their own. Boundary and RegExp turned out to be the fastest, then JSR223, BeanShell, and CSS; XPath was the slowest. Therefore, we recommend removing XPath from your services.
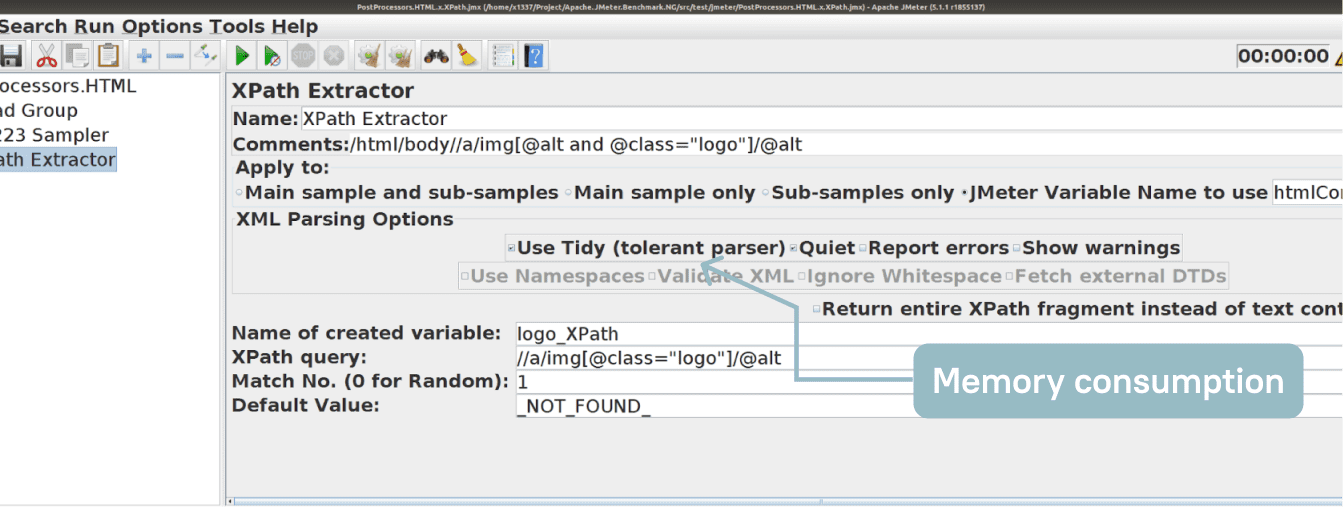
XPath with Use Tidy for HTML
The XPath post-processor works slowly because it has to use a tolerant parser called Use Tidy, which transforms HTML to valid XML, to which XPath is then applied. Unfortunately, Use Tidy works extremely slowly: it reserves a great deal of memory, loads HTML into it, and cleans it all. We don’t recommend it for load testing using JMeter.
Miscellaneous Features
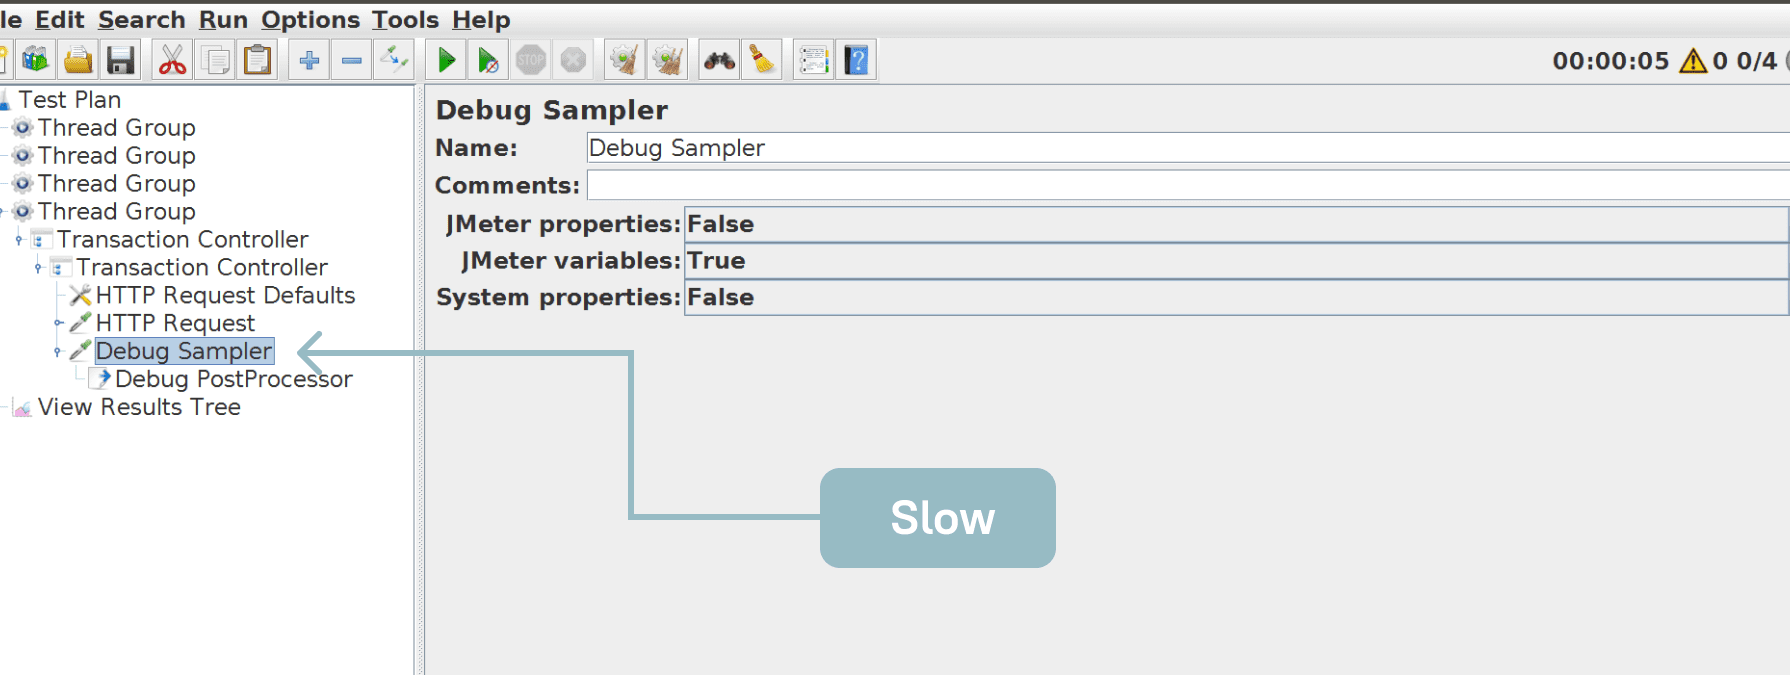
Debug Sampler at the start
There is a Debug Sampler under Miscellaneous Features in the JMeter documentation. It is used while debugging JMeter scripts and is sometimes kept in the test during the test run. The problem is that the Debug Sampler throws into the response body all variable values and generally everything that is kept in the memory by default. So, if your test is highly intensive and you are using the Debug Sampler, the test will slow down significantly.
Disable the Debug Sampler
In this case, don’t forget about the shortcut CTRL+T to select all Debug Samplers and disable them while debugging.
Summary
In the first part of our Apache JMeter load testing tutorial, we looked at how to increase the speed of the service using its load agent, settings, and components.
First of all, we advise you to install agent monitoring. In order to do this, follow these steps:
Furthermore, you should refer to the JMeter settings, the use of which will help you to avoid important errors and increase the speed of the system.
In addition, optimize the JMeter components:
