Apache JMeter is a powerful load-testing tool known for its versatility and robustness. However, even its broad functionality can be enhanced significantly by using carefully selected plugins. This article introduces the top 10 best JMeter plugins that streamline test scripting, improve reporting, and enable advanced load shaping and monitoring. Learn their key features, when to utilize them, and gain insights on boosting test efficiency, troubleshooting, and obtaining clearer results..
1. Plugins Manager
Download: JMeter Plugins Manager
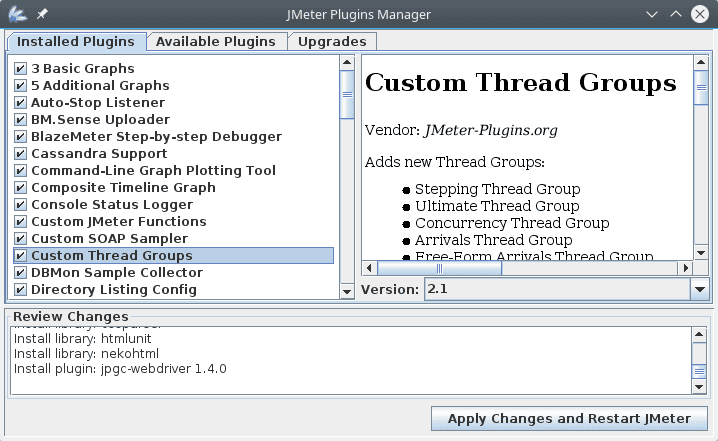
The Plugins Manager is an essential component for any JMeter setup, effectively serving as a command center for managing all other JMeter plugins. Instead of manually dealing with JAR files, this plugin provides a straightforward graphical interface that significantly streamlines plugin management.
Its intuitive UI categorizes plugins into “Installed,” “Available,” and “Upgradable,” allowing you to install or update plugins in bulk with automatic dependency resolution. Furthermore, it provides real-time popularity indicators, assisting engineers in identifying widely adopted plugins within the performance testing community.
Key features:
When and how to use:
Always install the Plugins Manager first after setting up Apache JMeter. To install, simply download the Plugins Manager JAR file from the official source, place it into JMeter’s lib/ext directory, and restart JMeter. It is crucial when handling large-scale or complex testing infrastructures where plugin stability, compatibility, and ease of management directly affect productivity.
2. PerfMon Servers Performance Monitoring
Download: PerfMon Plugin
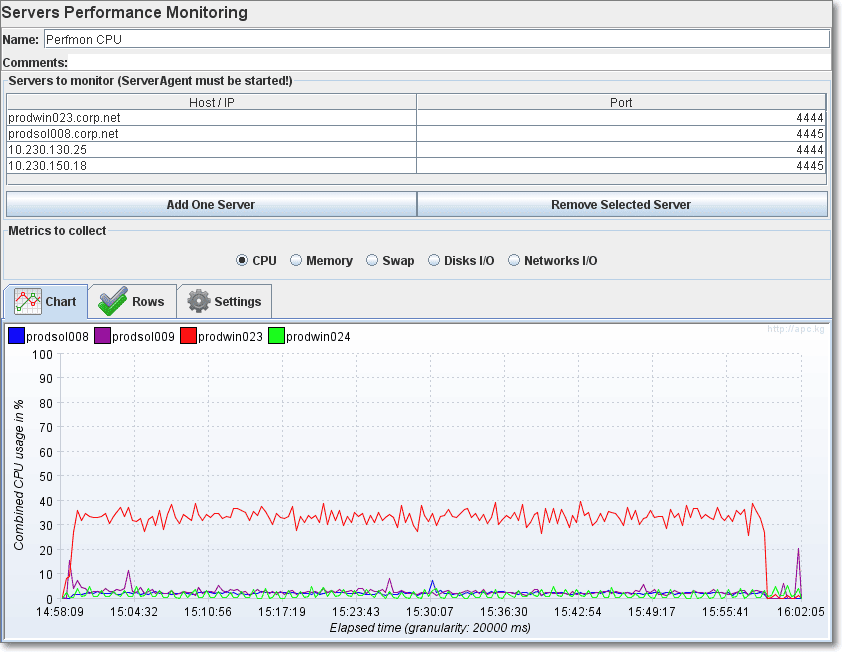
The PerfMon Servers Performance Monitoring plugin brings comprehensive server-side monitoring directly into your JMeter tests. Traditional JMeter testing provides client-side response data, but for professional engineers diagnosing system bottlenecks, server-side metrics are equally critical. PerfMon addresses this gap by integrating live system monitoring data (CPU load, memory consumption, disk I/O, network throughput) seamlessly into JMeter’s reporting ecosystem.
To achieve this, PerfMon uses a lightweight Java-based agent (ServerAgent), which must run on each monitored server. JMeter then collects and plots real-time metrics, enabling immediate correlation between server resource consumption and observed performance degradation.
Key features:
When and how to use:
Use PerfMon during performance testing scenarios requiring detailed insights into backend system health — especially for diagnosing resource constraints. Deploy the ServerAgent on your application or database servers, ensuring the required ports are open. Add a PerfMon listener in your JMeter test plan and specify server details to instantly obtain live resource metrics, vastly simplifying the identification of infrastructure-level bottlenecks and enabling more efficient root-cause analysis.
3. Custom Thread Groups
Download: Custom Thread Groups Plugin
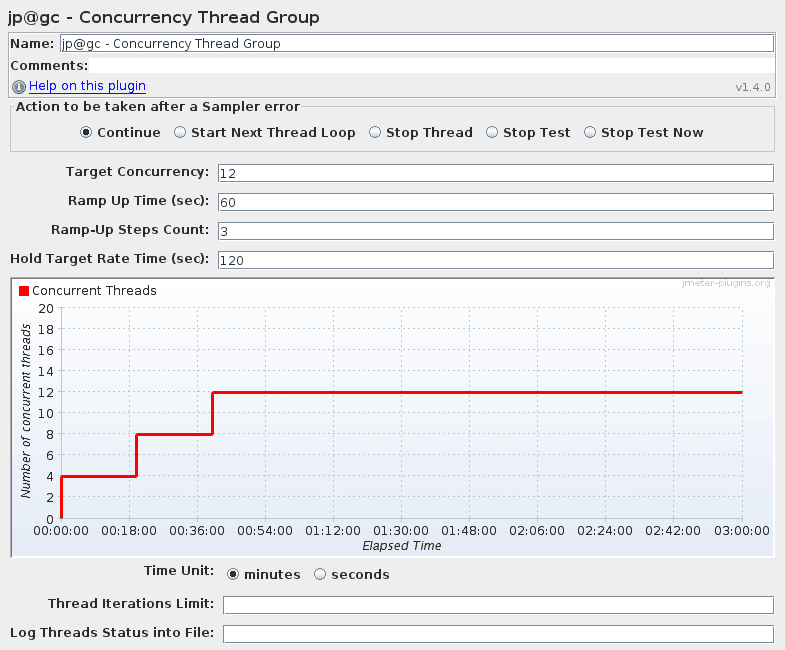
While JMeter’s default Thread Groups allow basic load definitions, professional engineers often require more intricate and realistic load simulations. The Custom Thread Groups plugin adds several specialized thread group controllers (Ultimate, Concurrency, Arrivals, etc.) to precisely craft and execute advanced user-load scenarios.
Key features:
When and how to use:
Utilize Custom Thread Groups whenever tests must precisely simulate production-like load variations or verify system behavior under rapidly changing user conditions. It’s particularly valuable for professional load-testing scenarios such as spike testing, endurance (soak) testing, or stress testing where simple ramp-ups or constant load profiles won’t suffice. Add the desired custom thread group into your test plan, define your load stages explicitly, and verify the schedule visually through the provided graphical interface, ensuring the exact scenario needed for accurate performance validation.
4. Dummy Sampler
Download: Dummy Sampler Plugin
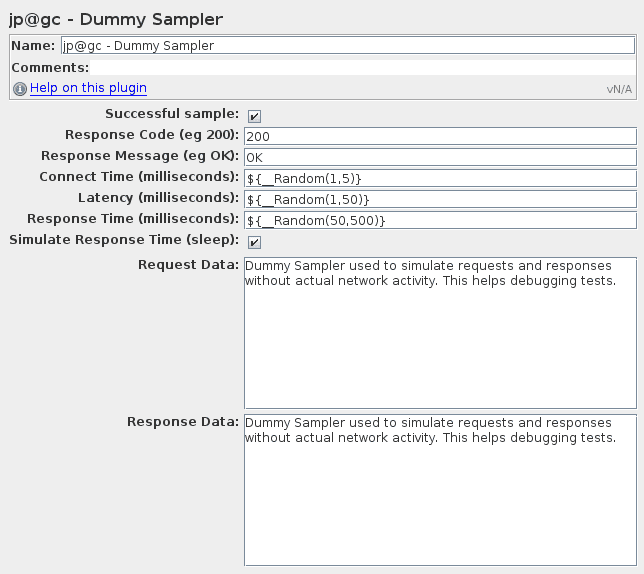
The Dummy Sampler plugin is a critical debugging and development tool for engineers constructing complex plugins in JMeter. It generates customizable sample responses without actual network activity, enabling testers to isolate and verify logic within post-processors, extractors, or assertions. You can define exact response data, latency, response codes, and messages — ideal for unit testing, debugging extraction logic, or simulating server errors.
Key features:
When and how to use:
Use the Dummy Sampler when you need precise control over simulated responses for scripting or debugging test flows. It’s particularly useful to verify response-based logic or troubleshoot issues in test components. Insert it into your test plan, configure the desired responses, and execute to immediately validate script logic without external dependencies.
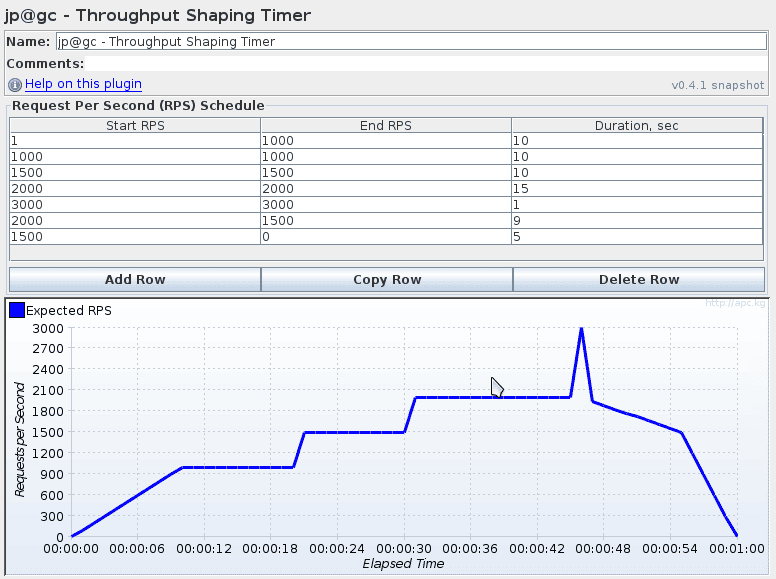
5. Throughput Shaping Timer
Download: Throughput Shaping Timer Plugin
The Throughput Shaping Timer plugin provides exact control over your test’s requests-per-second (RPS) rate, enhancing your load-testing precision. Rather than guessing the required thread numbers, it allows defining a target RPS schedule directly. Especially useful when integrated with cloud-based setups or the best JMeter cloud services, ensuring your tests hit precise throughput targets consistently, regardless of server or client performance variations.
Key features:
When and how to use:
Use the Throughput Shaping Timer to achieve exact throughput patterns, crucial for performance benchmarks or consistent baseline testing. Precise load shaping ensures stable and predictable tests. Insert the timer into your test plan, define your throughput schedule, and visually confirm the schedule before execution. For large-scale scenarios, combine with Concurrency Thread Groups for automatic thread adjustments, maximizing test effectiveness.
6. Custom JMeter Functions
Download: Custom JMeter Functions Plugin
Custom JMeter Functions significantly extend JMeter’s scripting and parameterization abilities, crucial for engineers building sophisticated test scenarios. These functions provide quick shortcuts for string manipulation, conditional logic, random data selection, Base64 encoding, and environment variable access. Without resorting to scripting languages, you can perform complex in-line data transformations, significantly enhancing script readability and maintainability.
Key features:
When and how to use:
Integrate Custom JMeter Functions whenever complex data manipulation or conditional logic is necessary within your test plan. Particularly useful in scenarios involving complex parameterized test cases or dynamic environments. Leverage these functions directly in JMeter input fields or script elements to simplify scripts, thereby reducing execution overhead — an efficient approach when exploring ways on how to speed up JMeter.
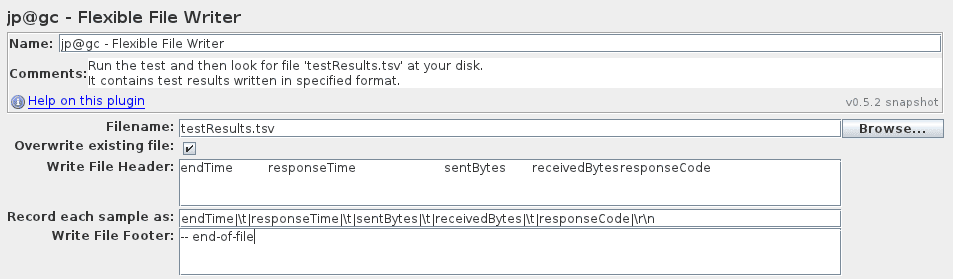
7. Flexible File Writer
Download: Flexible File Writer Plugin
The Flexible File Writer is an advanced logging tool designed for scenarios where JMeter’s default result recording is insufficient. Engineers needing customized result data logging for detailed analysis or integration with external monitoring solutions greatly benefit from this plugin. It provides complete control over the format and content of logged test results, enabling highly tailored CSV, XML, or custom-delimited files.
Key features:
When and how to use:
Ideal when integrating apache jmeter plugins with external analysis tools or when precise log formatting is critical. Add Flexible File Writer as a listener in your test plan, define the desired fields (timestamp, response code, thread name, etc.), set your custom format, and run your tests to generate exactly the data output you need for detailed diagnostics or integration.
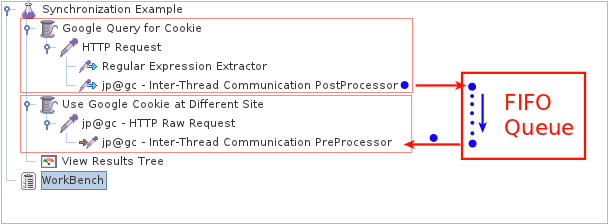
8. Inter-Thread Communication
Download: Inter-Thread Communication Plugin
The Inter-Thread Communication plugin enables advanced synchronization and data-sharing between different thread groups or individual threads in JMeter. This plugin introduces FIFO queues to manage shared data, allowing precise control of multi-step scenarios and complex test flows. Professional engineers can use it to coordinate thread execution, pass dynamic tokens, or implement producer-consumer scenarios within their test architecture.
Key features:
When and how to use:
Critical for scenarios where thread groups must coordinate data or synchronize actions, such as multi-stage login or dynamic token sharing. Insert communication elements into your test scripts: use PostProcessors to put data into queues and PreProcessors to consume data, enabling controlled sequencing and parallel execution of complex performance tests.
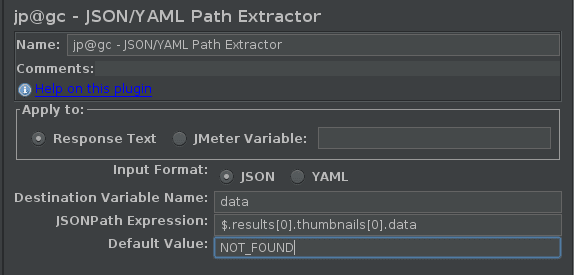
9. JSON/YAML Path Extractor
Download: JSON/YAML Path Extractor Plugin
The JSON Path Extractor is indispensable for modern API performance testing involving JSON data. While JMeter’s built-in extractors handle many cases, JSON Path Extractor enhances extraction accuracy and flexibility, especially with complex JSON structures. It leverages JSONPath syntax, enabling precise data extraction without complex scripting or regular expressions, greatly improving test robustness and maintenance.
Key features:
When and how to use:
Essential for tests involving APIs returning JSON payloads, where accurate data extraction is paramount. Insert JSON Path Extractor post-processors into your test plan, specify the JSONPath expressions, and directly retrieve required values (tokens, IDs, etc.) from responses. This approach greatly simplifies test scripting and debugging, particularly valuable when executing large-scale API tests.
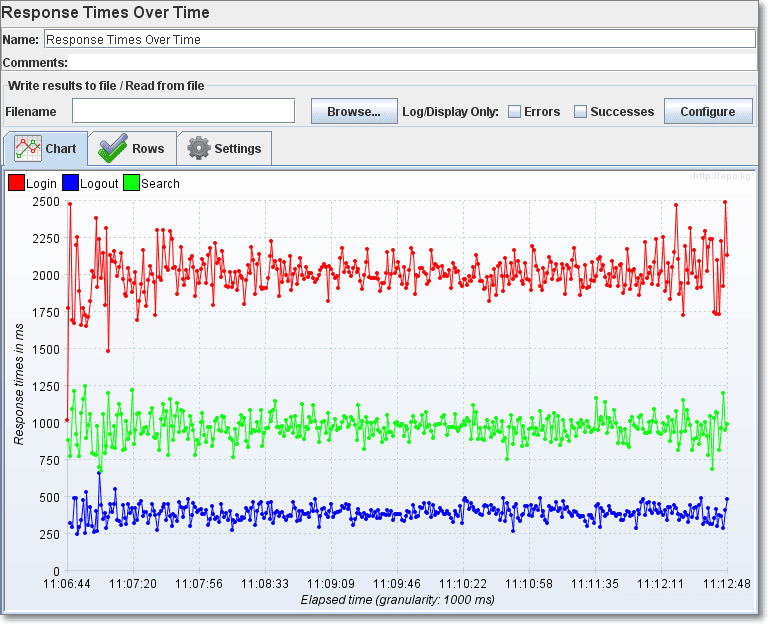
10. 3 Basic Graphs
Download: 3 Basic Graphs Plugin
The 3 Basic Graphs plugin offers three essential graphical listeners — Active Threads Over Time, Response Times Over Time, and Transactions per Second — that provide immediate visual insights into test performance. These listeners allow professional engineers to quickly interpret test outcomes, easily spot performance degradation patterns, identify throughput issues, and confirm test-load profiles without leaving JMeter.
Key features:
When and how to use:
Integrate these graphs during initial test executions or baseline testing for rapid feedback on application behavior under load. Add them as listeners to your test plan to gain immediate graphical feedback during execution. These insights enable you to rapidly identify bottlenecks, understand how your system responds to load, and make informed adjustments.
Final Thought
These are the essential JMeter plugins that significantly enhance your testing capabilities, from advanced load modeling and server monitoring to streamlined result analysis. However, configuring and fine-tuning an Apache JMeter environment still requires considerable effort and expertise. If you’d prefer not to spend time on manual setups and complex configurations, consider using PFLB — an efficient, user-friendly JMeter cloud tool that simplifies performance testing and provides advanced AI-powered reporting features.