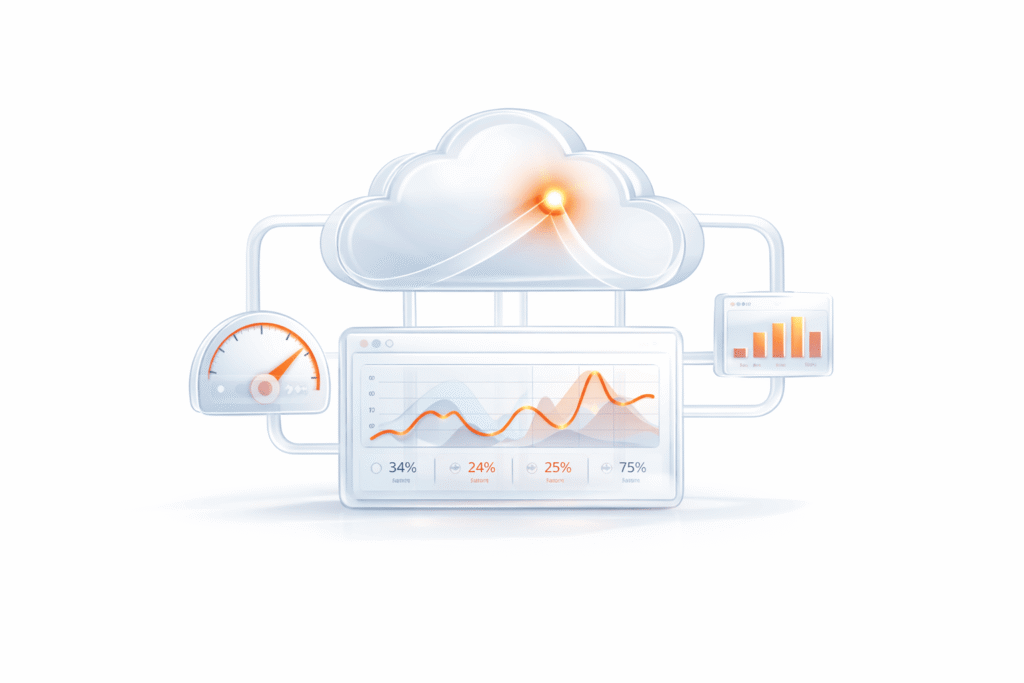
A load profile is a set of operations whose intensity is chosen to create a load comparable to the production traffic patterns.
Load testing preparation is one of the most important steps in load testing services.
An incorrect load profile generates testing results unrelated to the production.
We recommend to begin the load testing preparation by considering the testing goals, such as:
and so forth.
Collecting Statistics
Time range
When choosing the time range for the analyzed statistics, you’ll need to include several productive load cycles—they will allow you to determine the typical load. Most application performance testing tools provide functionality to capture these cycles effectively. We recommend using the statistics for a period smaller than a month.
The time range should not be too big: if you take the statistics for half a year, the final load profile will display the average load for the whole period, which is not correct when the load level is constantly rising. A large amount of data will also make the analysis more difficult.
You’ll need to take into account that the load differs between the months: in December, the load is normally higher, but in January and May, there are many public holidays. Therefore, the statistics for these months may not be as informative. In this case, we recommend comparing it to the statistics for the next and previous months to evaluate the deviation. Alternatively, it’s possible to enlarge the analyzed period.
Aggregation
Normally, the operation intensity is aggregated every hour (in case the intensity is more than 100 operations per hour)
Statistics Analysis
Days to choose for the load profiles
Most systems have more and less loaded periods:
It’s necessary to determine days with the typical load for the desired load profile.
It is the set of days when the load is similar and as high as possible. The amount of selected days should be enough to form a typical load.
But when there are several such days and the system implies that in certain days the load is the highest – then the profile should be based on these days.
Internet rush hour and the corresponding time range
For the chosen days we divide operations to average out the operation intensity for each hour.
The load profile base is the Internet rush hour – the hour when the sum load for operation is maximal.
It’s necessary to evaluate the time range when the relations between operations are similar to rush hour. The load profile will cover this period. For the remainder of the time, we need to create a separate load profile.
If the load profile is aimed to analyze certain operations, it’s recommended to make sure that the chosen days and hours have the maximal intensity in respect of the operations.
And the other way round, not very important operations that are highly intensive should be discarded.
Choosing operations to include in the load profile
Based on the operation intensity for the chosen rush hour, we need to choose a set of operations to include in the load profile.
If it is known that the main load on the operations occurs on certain days/hours, we advise making sure that these hours are included in the analysis. Based on these hours, one may create the load profile.
Determining the operation intensity in the load profile
Determining the operation intensity in the load profile
As a result of the previous steps, we’ve compiled a list of operations and the time range for system work that the load profile will cover. We include the highest intensity for each operation for the time range covered by the load profile to the final load profile. After that, we evaluate how well the resulting profile covers the intensity of the rush hour. The allowed value is about 10%. If the allowed value is overtaken, the time range covered by the load profile must be corrected. For executing large-scale distributed load tests efficiently, consider leveraging a JMeter cloud load testing tool to optimize the intensity assessment and ensure seamless scaling.
It follows that the final profile emulates the highest possible load.
Batch and atomic operations
Some operations can be performed atomically or sequentially. For example, in the banking domain, after registering a client, an account is created. Batch operations can form a load different from performing the operations atomically. In such a case, we first determine the needed intensity for the batch operations from the composed profile and then give the rest of the intensity atomically.
Comparing the Load Profile to the Previous One
After creating the profile, it’s advised to compare it to the previous profile if one is present.
The profiles are compared in the following way:
(it’s performed after taking the old load profile to the level of the new load profile: the intensity of each operation from the old profile is multiplied to such a coefficient that the amount of the old profile operations equates to the number of new profile operations.
The frequency of load profile update
The necessity of updating the profile depends on the testing system’s load. It’s recommended that the load profile be updated once a quarter.


