



With dozens of load testing tools on the market, choosing the right one feels overwhelming. Some platforms are overly complex or unintuitive, which often leads teams to skip performance testing altogether, or to look for modern cloud-based alternatives to legacy solutions.
To make the decision easier, I’ve put together a list of the best load testing tools for 2026. This comparison covers cloud platforms, open-source engines and the enterprise suites that still run the largest programmes, and every price was re-checked in September 2026.
The tools included here cover a mix of open-source and commercial options, making the list relevant for startups, mid-size companies, and large enterprises. Beyond raw load generation, I highlight features that matter today: AI-driven insights, browser-based testing, integrations with monitoring tools, and private cloud support.
We also ran the four open-source engines, JMeter, k6, Gatling and Locust, through an identical one-hour, 1,000-user workload on the same host. The numbers are in each profile; the method, the CSV and a filterable decision table are in the companion piece, How to Choose a Load Testing Tool in 2026.
Key Takeaways:
- The load testing tools eliminate the need for on-premise infrastructure.
- Popular options include both open-source and commercial solutions.
- Key evaluation criteria: scalability, ease of use, supported protocols, price, and reporting features.
- Load testing platforms enable distributed traffic generation across global regions.
- Many tools offer free tiers, but enterprise plans unlock advanced analytics and collaboration features.
- The cap on a single test matters as much as the price: several entry plans stop at exactly one hour.
- In 2026 AI moved from summarising reports to generating tests; the tools differ in which of the two they mean.
- Choosing the right tool depends on project size, budget, and integration requirements.
Top Load Testing Tools Comparison Table
Before diving into detailed reviews, here’s a side-by-side look at the top load testing tools for 2026. The table highlights the core features that matter most when making a decision. Use it as a quick reference if you need to shortlist tools fast. Detailed notes for every tool follow in the next sections.
| Name | PFLBRead Review  | JMeterRead Review | K6 CloudRead Review | Gatling CloudRead Review | BlazeMeterRead Review | OctoPerfRead Review | LoadViewRead Review | LocustRead Review | ArtilleryRead Review | LoadiumRead Review | LoadNinjaRead Review | LoadForgeRead Review | OpenText PERead Review | NeoLoadRead Review | Azure Load TestingRead Review |
|---|---|---|---|---|---|---|---|---|---|---|---|---|---|---|---|
| G2 Rating | 5/5 | 4.3/5 | 4.8/5 | 4.3/5 | 3.9/5 | 4.5/5 | 4.5/5 | 4.3/5 | 0/5 | 4.3/5 | 4.3/5 | 4.6/5 | 4.7/5 | 4.3/5 | n/a |
| Min Pricing Plan Cost | $149 | Free | $19 | €89 | $99 | $99 / test | $129 protocol | Free | Free | $79 | $350 / 25 h | $67 | $0.30/VUh | Quote | $0.15/VUh |
| Free Trial |  | | | | | | | | | | |  | n/a | n/a | |
| VUh Price | $0.09 | n/a | $0.15 | n/a | n/a | n/a | n/a | n/a | n/a | n/a | n/a | n/a | $0.30 | n/a | $0.15 |
| Hosted Load Generators | | | | | | | | | In your AWS/Azure | | | | | | |
| Max VU Per Test | 5,000 | unlimited | 60,000 | 180,000 | 5,000 | 1,000 | n/a | unlimited | unlimited | 1,000 | 500 | 10,000 | n/a | n/a | n/a |
| Max Test Duration, h | unlimited | unlimited | n/a | credit-bound | 5 | 1 (no cap on $999) | 4 | unlimited | 2 (Team) | 1 | n/a | 0.17 | unlimited | n/a | n/a |
| Data Retention, months | 3 | n/a | 6 | 3 | 6 | 3 | n/a | n/a | 1 | 3 | 6 | 12 | n/a | n/a | n/a |
| Open Source Support | JMeter | JMeter | k6 OSS | Gatling | JMeter, Gatling, k6, Locust | JMeter | JMeter, Selenium, Postman | Locust | | JMeter, Gatling, Selenium | | Locust | LoadRunner, JMeter, Gatling | JMeter | JMeter, Locust |
| Geo Locations | 22 | | 21 | 10 | 20 | 20 | 40 | | | 50 | 11 | 9 | n/a | n/a | n/a |
| Same-Workload Cost | $294 | $0 | ≈$356 | ≈$411 | $99 | $396 | $129 protocol | $0 | $159 + compute | $79 | Quote for 1,000 | ≈$417 | Quote | Quote | ≈$610 |
| AI Action, A0–A3 | A3 | A0 | A3 | A3 | A1 | A3 | A1 | A0 | A0 | A0 | A0 | A2 | A3 | A2 | A1 |
Prices are list prices checked September 2026. “n/a” means the vendor does not publish the figure, or the meter is not virtual user hours at all. Same-workload cost prices one fixed workload everywhere: 1,000 users, one hour, four runs a month, on the cheapest plan that allows it. AI action rates what the AI is documented to do: A0 nothing verified, A1 explains results, A2 creates assets, A3 runs the lifecycle. Both come from our companion research.
What is Load Testing?
Load testing is the process of verifying whether a system can handle the expected number of concurrent users, transactions, or data volume without breaking down. It measures how well an application performs under increasing demand, checking for slow response times, system crashes, or other bottlenecks that impact reliability.
By simulating real-world traffic, teams can assess performance against defined service-level objectives (SLOs) or service-level agreements (SLAs). Developers, QA engineers, and site reliability engineers (SREs) rely on load testing tools to confirm that web apps, APIs, and back-end systems meet performance requirements before release. For API-heavy environments, cloud-based load testing platforms make it easier to model request bursts, latency, and throughput issues at scale.
Modern DevOps teams integrate these tools directly into CI/CD pipelines, enabling continuous validation of speed and stability with every build. Business leaders and SaaS founders also benefit: they can plan capacity, prevent downtime during product launches, and make informed scaling decisions.
Traffic simulation is only part of the picture. Strong reporting and monitoring features are equally important, helping teams interpret results, pinpoint weak spots, and implement fixes. With the right toolset, performance testing becomes less of a one-off task and more of an ongoing safeguard for application health and user satisfaction. Load testing is one discipline in that toolset, alongside stress testing, which pushes past the expected peak, and soak testing, which holds a realistic load for hours to catch leaks; realistic think time between requests is what separates a load test from a benchmark.
How I Compared The Best Load Testing Tools
When I set out to review the best load testing tools for 2026, I focused on what actually matters to engineers, DevOps teams, and decision-makers. Documentation and marketing pages can be misleading, so I worked directly with each product: either through a free trial or by purchasing the lowest-tier paid plan. This way, I could see how the tools behave in real scenarios: what’s easy, what’s clunky, and what’s missing.
Here are the main criteria I used for comparison:
1. Price and Value
I calculated the cost per virtual user hour (VUH) whenever possible. This made it easy to see which platforms deliver the most realistic traffic for the money. For enterprise-scale scenarios, I also considered how pricing changes as concurrency scales up.
2. Hosted Load Generators
Managing your own load infrastructure adds friction. I prioritized tools that provide hosted load generators in multiple geographic regions, so you can run tests quickly without worrying about servers.
3. Private Cloud Options
Some organizations, especially in finance, healthcare, or government, need stricter security. For these use cases, I looked at whether a tool supports private cloud deployments or on-premises generators.
4. Data Management and Collaboration
A good load testing platform doesn’t just run traffic; it also stores test results, allows sharing across teams, and supports collaborative analysis. I noted how each tool handles data retention, reporting, and team workspaces.
5. Open-Source Compatibility
Many teams already use JMeter, Gatling, or Locust. Compatibility with existing open-source scripts was a big factor, since it reduces the effort needed to migrate or scale.
6. Protocol Coverage
Not every tool supports the same protocols. I checked for HTTP/HTTPS, REST, WebSocket, gRPC, GraphQL, SOAP, JDBC/JMS, LDAP, MQTT, Kafka/MQ, SMTP, TCP/UDP, and whether browser-based testing was available. This helps teams pick a tool that fits their actual tech stack.
7. SLA/SLO Tracking
It’s not enough to see response times. The best tools allow you to define service-level objectives (SLOs) or service-level agreements (SLAs) and flag tests as pass/fail against those thresholds. This is particularly valuable for SREs who rely on metrics to keep systems reliable.
8. CI/CD and Continuous Testing
I looked at how well each platform integrates into CI/CD pipelines: through APIs, plugins, or command-line tools. Continuous load testing is becoming the standard for DevOps, ensuring that every release is checked for performance regressions.
9. Trial and Accessibility
Finally, I considered whether you can try the tool without major commitments. Free tiers, pay-as-you-go models, or affordable entry packages make it easier to experiment and find the right fit.
1. PFLB  : Load Testing Tool with AI Insights and Production-Like Traffic

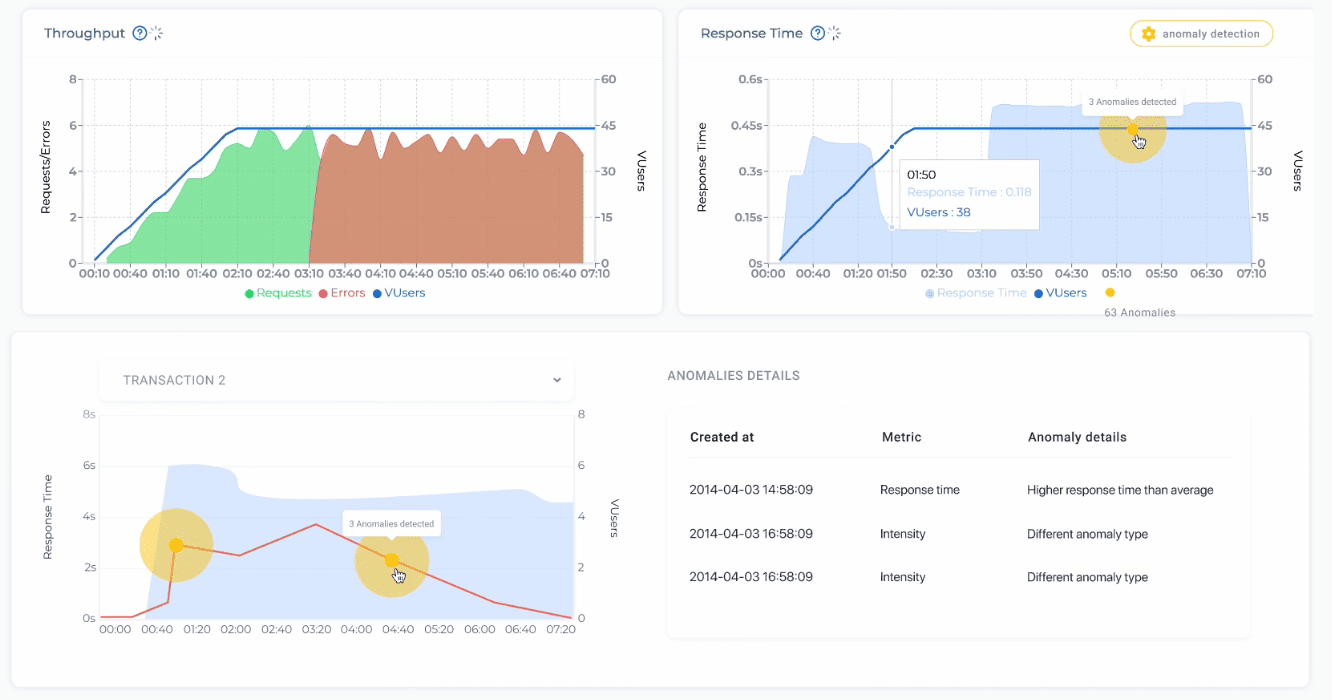
PFLB is a cloud-based performance testing platform for engineering teams that need to validate applications at scale. Instead of managing infrastructure you get hosted load generators, a hybrid mode that keeps generators inside your own perimeter, and a full on-premises edition for regulated environments.
The 2026 change is in how a test gets written. The platform imports the functional test cases a QA team already owns, alongside JMX, HAR, Postman and Insomnia files, and uses AI to convert them into JMeter-based load tests. Humans still approve correlation, data and pass-fail criteria; the transcription disappears. Tests can also replay real production traffic patterns from Google Analytics data.
Every run ends with an AI-written report that names the bottleneck, on top of Grafana dashboards, trend comparison and SLA/SLO pass-fail marks. An MCP server lets an AI assistant create, validate, launch and report a test end to end; our step-by-step guide shows a QA team with no load testing experience getting to a full run this way.
Best for
Teams with a deadline, QA engineers who have never written a load test, and organisations that want JMeter compatibility in the cloud without a performance engineer as the only route in.
Pros
 Hosted, hybrid (inside your perimeter) or fully on-premises load generators.
- AI converts functional test cases into JMeter load tests; production traffic replay from Google Analytics.
- AI-written report that names the bottleneck; MCP server for assistant-driven runs.
- Grafana dashboards, trend tracking across runs, SLA/SLO pass-fail, API for CI/CD.
- No-code builder plus HAR, Postman/Insomnia and JMX import; 100% JMeter compatible.
- No per-test duration cap; PFLB engineers can run the whole programme as a service.
Cons
- No free plan; entry is the paid Kickstart Month or a seat subscription.
- Lacks native integrations with leading APM tools (e.g., Dynatrace, New Relic).
- No browser-based load testing.
Protocols supported
HTTP/HTTPS, REST, SOAP, gRPC, Kafka, MQ (IBM MQ, RabbitMQ, ActiveMQ), plus full JMeter protocol coverage.
Pricing snapshot (checked September 2026) – $$$$$
- Kickstart Month: $299 one-time, 500 VUh and one AI report, guaranteed: a runnable test and an AI report within 30 days or a full refund.
- Team Starter: $149 per seat per month, 1,500 VUh; Growth: $249, 3,500 VUh; Scale: $399, 7,000 VUh.
- Overage from $12 down to $7 per 100 VUh; annual billing takes 15% off.
Notes
PFLB is the pick for teams already invested in JMeter who want a cloud workflow, AI-generated tests and a report that explains itself. It is less suited if browser-based coverage or deep APM integrations are critical.
2. Apache JMeter: Open-Source Load Testing Tool with the Broadest Protocol Coverage

Apache JMeter is the default of this market: half the commercial load testing tools in this list run JMeter scripts, import them, or price themselves against the fact that JMeter is free. It is a Java desktop application with a GUI for building test plans and a command line for headless runs, and its JMX test plans outlive the engineers who wrote them.
HTTP, JDBC, JMS, LDAP, SMTP, FTP and TCP are native, and the official catalogue adds 145 plugins, including an actively maintained ISO 8583 sampler, which is why JMeter still turns up inside payment switches. The edges run where the enterprise suites bill: no SAP GUI or Oracle Forms, and WebSocket only via plugins.
The real cost was never the licence. Someone has to provision the generators, keep the plugins working and read the results, and that is usually the scarce engineer the whole plan depends on. In our benchmark hour, an identical 1,000-user workload for every engine here, JMeter delivered the same 951 requests per second as the rest, used the most memory (1.63 GB at peak) and the least CPU (1,119 CPU seconds).
Best for
Teams with a performance engineer and time, testing protocols nothing else reaches, and anyone who wants portable test assets they can move to a managed platform later.
Pros
- Free and open source (Apache 2.0) with the largest install base in the category.
- Native HTTP(S), JDBC, JMS, LDAP, SMTP(S), FTP and TCP; 145 official plugins.
- JMX scripts run on PFLB, BlazeMeter, OctoPerf, Loadium, LoadView, Azure and OpenText.
- Distributed testing across machines; GUI recorder and headless CLI.
Cons
- No managed service, hosted generators or diagnosis: it is an engine, not a platform.
- Steep curve for correlation and distributed runs; big tests need many injector machines.
- Highest peak memory of the four engines we benchmarked.
- Slow cadence: the current stable release, 5.6.3, dates from January 2024.
Protocols supported
HTTP/HTTPS, REST, SOAP, JDBC, JMS, LDAP, SMTP(S), FTP, TCP; WebSocket, SSE, gRPC, Kafka, MQTT and ISO 8583 via plugins.
Pricing snapshot (checked September 2026) – $$$$$
- Free, Apache 2.0 licence.
- Your real costs are the load generators and the engineer who owns them.
Notes
JMeter remains the safest open default and the lingua franca of the category. Start here if you have the engineer; move the same scripts to a managed platform when that engineer becomes the bottleneck.
3. Grafana Cloud k6: Developer-Focused Load Testing with Observability
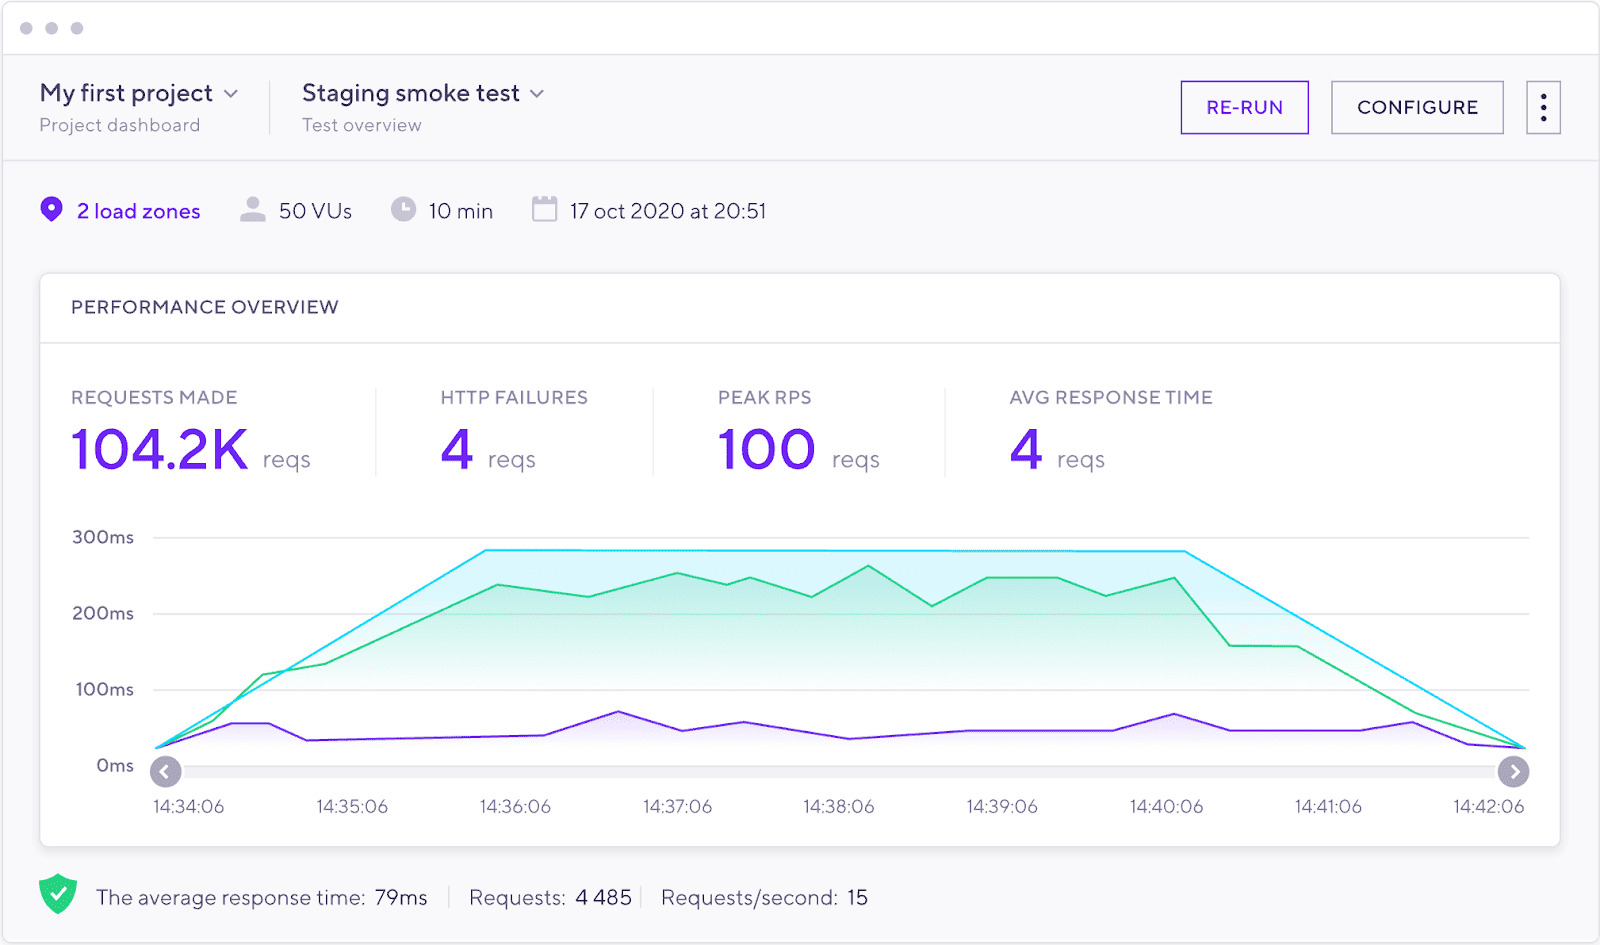
k6 started as an open-source load testing tool written in Go, with tests in JavaScript or TypeScript, a pleasant CLI that drops into CI/CD and thresholds as pass criteria. Grafana Cloud k6 runs the same scripts on managed generators in 20+ regions, with private load zones on paid plans, and wires results into the observability stack.
That is the point: load test and production dashboards live in one place, so you correlate outcomes with metrics, logs and traces and learn why a failure happened. k6 also runs protocol and browser load in one script through a Playwright-inspired (not Playwright-compatible) browser API; browser virtual users bill at ten times protocol ones.
k6 2.0 added AI scaffolding and an MCP server for coding assistants, but the engine stays code-first. Two cautions: the AGPL-3.0 licence, which some corporate policies ban, and a monthly bill that is hard to predict from the published $0.15 per VU hour plus $19 platform fee with volume discounts. In our benchmark hour k6 used 942 MB of memory and the most CPU of the four engines, 1,852 CPU seconds.
Best for
DevOps and SRE teams that already use Grafana and want load results beside their metrics, written in JavaScript and run from CI.
Pros
- Hosted load generators across 20+ regions, plus private load zones on paid plans.
- Deep Grafana integration: correlate test results with metrics, logs and traces.
- Protocol and browser load in one script; SLO-based pass/fail thresholds.
- Free 500 VU hours a month; the open-source engine is free on your own machines.
- k6 2.0: AI scaffolding and an MCP server.
Cons
- Requires JavaScript; no compatibility with JMeter, Gatling or Locust scripts.
- Browser VUs cost 10x protocol VUs; the free tier is far short of a 1,000-user hour.
- Monthly totals are hard to predict; per-test caps are no longer public.
- AGPL-3.0 engine licence: ask legal before the tool spreads.
Protocols supported
HTTP/HTTPS, REST, WebSocket, gRPC, GraphQL; Kafka via xk6 extensions; browser-based testing via k6 browser.
Pricing snapshot (checked September 2026) – $$$$$
- Free tier: 500 VU hours per month.
- Pay as you go: $19 platform fee plus VU hours from $0.15 with volume discounts; browser VUs at 10x.
- Enterprise plans with private load zones and longer retention by quote.
Notes
The top choice for developer-heavy teams that live in Grafana. Not the simplest or cheapest option for a QA team without JavaScript, and the bill should be modelled before the commitment.
4. Gatling: High-Concurrency Load Testing Tool

Gatling treats a load test as source code: versioned, reviewed and run by the build. It ships as an Apache 2.0 engine and as Gatling Enterprise Cloud with hosted generators, hybrid private locations and CI/CD plugins. After a decade of paying for its Scala reputation it shipped a Java DSL in 2021; Java is now the vendor's default recommendation, with Kotlin, Scala, JavaScript and TypeScript beside it.
The engine is the argument. Gatling rates a single generator at 60,000 virtual users, and our benchmark hour agrees with the reputation: the least CPU of the four open-source engines, 882 CPU seconds in 539 MB of memory, for the same 3.4 million requests. Plugins cover Kafka, RabbitMQ, JMS, MQTT and JDBC.
Read the cloud meter before the user counts. Credits are load-generator minutes, so cost follows duration and injector count, and running out blocks the next test rather than adding overage. The €89 Basic plan includes 60,000 virtual users but only 60 minutes of testing a month. Field note: in the closed model a looping scenario does not stop when the injection profile does, so set an explicit maxDuration. Ours ran sixteen flawless hours overnight.
Best for
Engineering teams that need very large-scale, cost-efficient tests and want them in code, under review, in the repository.
Pros
- Scales to hundreds of thousands of virtual users; the most efficient engine we benchmarked.
- Open-source engine and cloud-hosted enterprise version; hybrid private locations.
- Java, Kotlin, Scala, JavaScript and TypeScript DSLs; typed tests that survive code review.
- Enterprise edition exposes an MCP server, so an assistant can drive a run (AI action A3).
- Plugins for Kafka, RabbitMQ, JMS, MQTT and JDBC; web recorder for browser interactions.
- Integrations with Dynatrace, AppDynamics, New Relic, Datadog and CI/CD pipelines.
Cons
- Requires programming; the no-code options in Enterprise feel less intuitive than competitors.
- Cloud credits are generator minutes: the entry plan is spent after one one-hour run.
- Running out of credits stops testing until you buy more.
- Reporting weaker out of the box than Grafana-based platforms or PFLB.
Protocols supported
HTTP/HTTPS, HTTP/2, REST, WebSocket, JMS, SOAP, MQTT, JDBC, Kafka.
Pricing snapshot (checked September 2026) – $$$$$
- Open-source engine: free, Apache 2.0.
- Basic: €89 per month, 60 minutes of testing; Team: €356 per month billed annually, 300 minutes.
- AWS Marketplace: 500 minutes a month for $99, the same product at about a quarter of the Team price.
Notes
One of the most cost-effective options for extreme concurrency and the best fit for teams that treat tests as software. Read the minutes, not the user counts, and buy through the marketplace if you are on AWS.
5. BlazeMeter: Multi-Stack Load Testing Platform

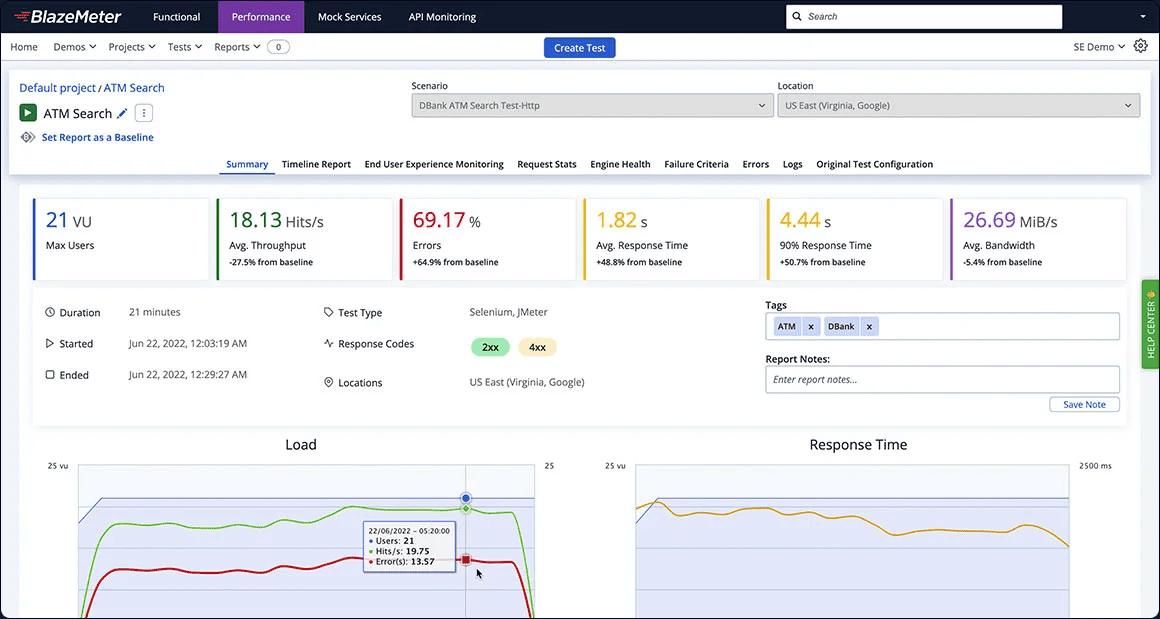
BlazeMeter is a commercial cloud platform that extends open-source performance testing tools with hosted execution, collaboration features and analytics. Built around JMeter, it runs JMeter, Gatling, k6, Locust, Selenium and Taurus scripts without a rewrite and adds reporting, CI hooks, mock services and service virtualisation. It is now a Perforce product, after CA and Broadcom.
Its breadth of integrations is the strongest point: Jenkins and other build tools, New Relic, AppDynamics, Datadog and CloudWatch, plus functional, API and mobile testing in the same platform. Its verified AI is narrower than the marketing suggests: assistance with synthetic test data, not test creation.
The number to watch is the ceiling on a single test: one hour on the entry plan, five on Pro, and the hour includes ramp-up, so a test holding 1,000 users steady runs for well under sixty minutes. The billing unit also changes between tiers: Basic counts whole tests, 200 a year; Pro counts virtual user hours, 80,000 a year. API testing is metered separately.
Best for
Teams that want one platform to run and extend JMeter, Gatling, k6 or Locust scripts in the cloud, with strong CI/CD and monitoring integrations.
Pros
- Hosted load generators in multiple regions; private locations on the Pro tier.
- Runs JMeter, Gatling, k6, Locust, Selenium and Taurus scripts unchanged.
- Integrates with New Relic, AppDynamics, Datadog and AWS CloudWatch.
- Functional, API and mobile testing alongside load testing; mock services included.
- AI assistance with synthetic test data (AI action A1, narrower than the marketing suggests).
Cons
- Basic sits exactly on both limits: 1,000 users and a one-hour test that includes ramp-up.
- Billing unit changes between tiers; API testing metered separately.
- Reporting is shallow; no built-in bottleneck detection, and the verified AI is test-data assistance only.
- Pricing grows quickly with large-scale tests.
Protocols supported
HTTP/HTTPS, REST, WebSocket, browser-based testing (via Selenium and Playwright), plus all JMeter, Gatling, k6 and Locust protocols.
Pricing snapshot (checked September 2026) – $$$$$
- Free tier for small, short tests.
- Basic: $99 per month billed annually ($149 month to month); 1,000 users, one-hour tests, 200 tests a year.
- Pro: 80,000 VU hours a year, five-hour tests, private locations; enterprise by quote.
Notes
BlazeMeter shines as a multi-stack runner for open-source scripts. It fits teams standardising on JMeter or Gatling with CI/CD in place; read the duration cap and billing unit before the price, and look elsewhere for soak tests.
6. OctoPerf: JMeter-Centric Load Testing Platform
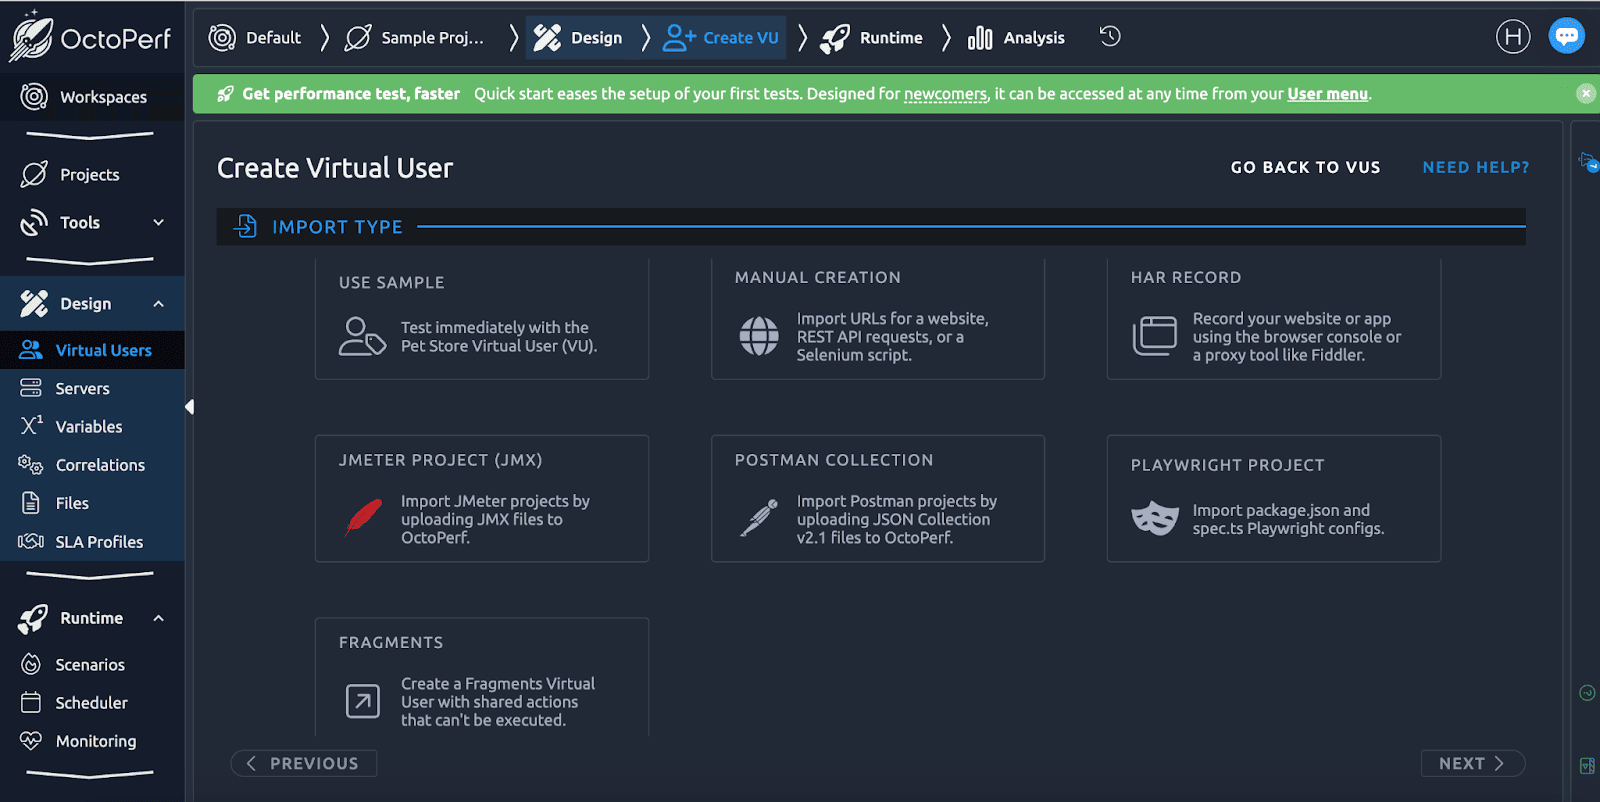
OctoPerf positions itself as a JMeter Performance Center: a visual test designer over JMeter, hosted execution and a polished reporting engine with detailed breakdowns, trend analysis, SLA checks and customisable dashboards. Import existing JMeter scenarios or build new ones without touching the JMX, and add browser virtual users through Playwright scripts.
Distributed tests run on major cloud providers, with private or on-premises generators on the flagship plan. In 2026 OctoPerf also ships an MCP server, so a load test can be driven from an AI assistant.
It is the only tool here with true pay-per-test: $99 buys a single 1,000-user hour with no subscription, and the free tier is permanent (50 users, 20 minutes, no card). For regular testing the arithmetic turns: four such tests a month cost $396, most of the way to the $999 unlimited subscription, which removes the duration cap.
Best for
Teams already on JMeter that want a visual designer, hosted execution and professional reporting, or a one-off launch rehearsal bought as a single test.
Pros
- Hosted and private load generators, including on-premises on the flagship plan.
- Deep configuration: load curves, correlation rules, IP spoofing, data pools, SLA tracking.
- Advanced reporting with trend analysis and customizable dashboards.
- True pay-per-test at $99; permanent free tier; MCP server for AI-assisted runs.
- Playwright scripts for browser-based testing; strong documentation and certification.
Cons
- Pay-per-test runs end at exactly one hour; the unlimited subscription is $999 a month.
- Learning curve for advanced features.
- No production traffic replay and no built-in bottleneck detection.
Protocols supported
HTTP/HTTPS, REST, WebSocket, browser-based testing (via Playwright), and full JMeter protocol coverage.
Pricing snapshot (checked September 2026) – $$$$$
- Free tier: 50 virtual users, 20-minute tests, no card required.
- Pay-per-test: $99 for one 1,000-user hour, no subscription.
- Unlimited subscription: $999 per month, no duration cap; custom pricing for large organizations.
Notes
OctoPerf stands out for JMeter teams that want a robust cloud execution and reporting environment, and for anyone who needs to buy exactly one test. If you test more than once a fortnight, start from the subscription.
7. LoadView: Real-Browser Load Testing from Vendor Cloud or Private Injectors

LoadView drives real browsers rather than protocol traffic from more than 40 zones, with on-premise load injectors and an on-site agent for systems that are not publicly reachable. If the thing that breaks is rendering, third-party scripts or a single-page app under contention, protocol tools report healthy response times while real users watch a page assemble itself.
The EveryStep recorder shortens scripting, JMeter, Selenium and Postman assets are reused, and HLS and MPEG-DASH streaming is a first-class case, which is rare. AI data analysis of the report and waterfall charts flags anomalies after the run. One caveat from the vendor's knowledge base: injector fleets take ten minutes to an hour to provision, so the test starts today, not this minute.
Price it as browser load. The meter counts load-injector hours plus per-tier ceilings on concurrent HTTP users and real browsers, every tier caps a single test at four hours (verification can raise it to 25), and the $129 Starter plan covers a 1,000-user hour only as protocol traffic.
Best for
Ecommerce, media and streaming teams whose risk is in the browser rather than the API, and teams that need load injected from inside their own network.
Pros
- Real browser execution from 40+ zones; on-premise injectors and on-site agent for private systems.
- EveryStep recorder plus JMeter, Selenium and Postman reuse; protocol and browser tests in one account.
- HLS and MPEG-DASH streaming load; AI analysis of reports and waterfall charts.
- Five free tests on trial, no card required.
Cons
- Metered in load-injector hours with per-tier ceilings on concurrent browsers.
- Four-hour cap on a single test on every tier.
- Entry plan runs 1,000 users only as protocol traffic; browser load at that scale costs more.
- Injector fleets take 10 to 60 minutes to provision.
Protocols supported
Real browsers, HTTP/HTTPS, REST, SOAP, HLS and MPEG-DASH streaming; JMeter, Selenium and Postman scripts.
Pricing snapshot (checked September 2026) – $$$$$
- Trial: five free tests, no card.
- Starter: $129 per month billed annually ($199 month to month) on LoadView's pricing page, 30 load-injector hours, protocol load at 1,000 users. The same 30 hours also cover real-browser tests at a smaller scale.
- Higher tiers raise the concurrent browser and HTTP user ceilings; enterprise by quote.
Notes
LoadView is the managed real-browser option with a private-network story most browser tools lack. Choose it for front-end risk and price it as browser load, not as the cheapest row in a table.
8. Locust: Python-Based Open-Source Load Testing Framework

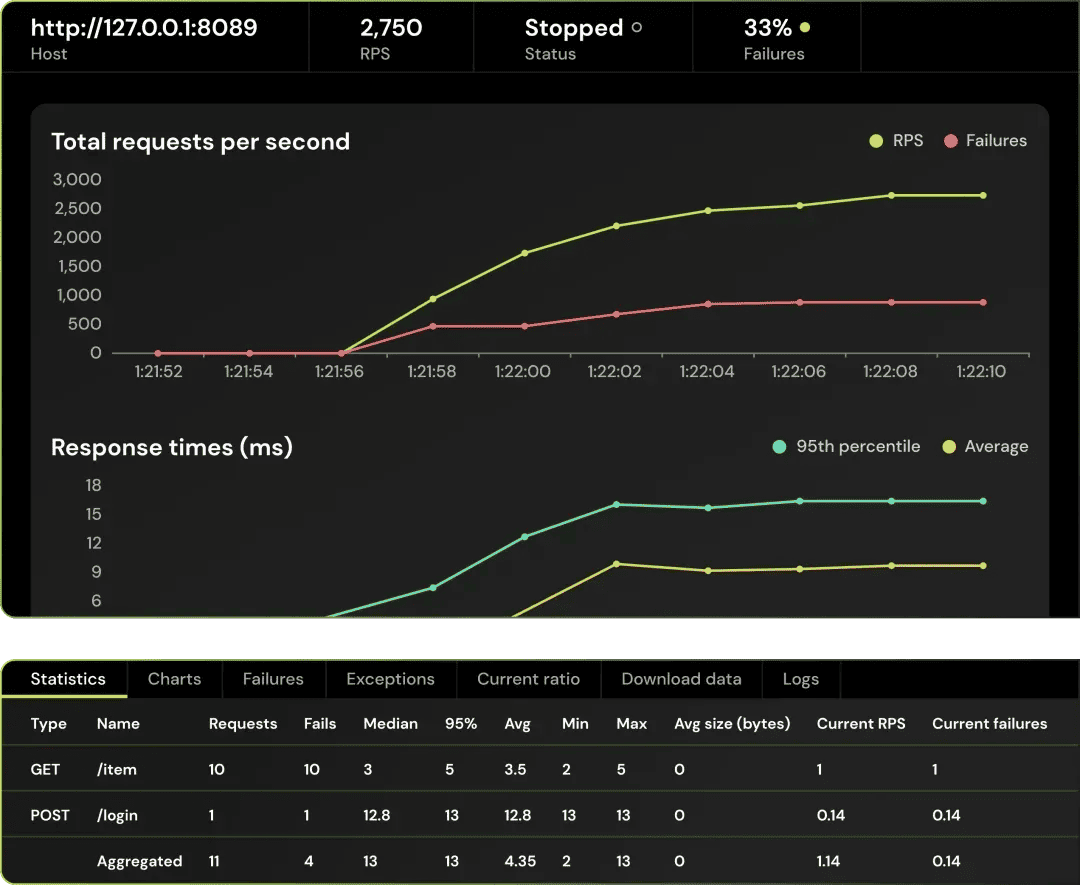
Locust makes the load a Python program. Testers write code to describe user behaviour, which is liberating if your team writes Python and a wall if it does not; behaviour that would be awkward in a GUI is a few lines here, and a primary-and-worker model distributes the test across your own machines.
The hosted story turned over in 2025. Locust Cloud, the maintainers' own paid service, shut down in December 2025 after roughly a year. Microsoft now sponsors the lead maintainer, and the official docs point hosted users to Azure Load Testing, which runs Locust and JMeter scripts. The open-source tool is unaffected and better funded than before.
One architectural fact decides your infrastructure: a Locust process is bound to a single core, so one worker per core is mandatory. In our benchmark hour, run as four workers, Locust matched the shared 950 requests per second in 260 MB of peak memory, the smallest footprint of the four engines, at 1,619 CPU seconds.
Best for
Python teams who want the test to be a program, not a configuration file, and are comfortable running their own worker fleet.
Pros
- Full scripting flexibility with Python; anything Python can call becomes a load client.
- Smallest memory footprint of the four engines we benchmarked (260 MB at peak).
- Distributed execution out of the box; live web UI; MIT licence with sponsored maintenance.
- Hosted execution available through Azure Load Testing and LoadForge.
Cons
- Requires Python skills; no built-in script recorder.
- Locust Cloud closed in December 2025; no maintainer-run hosted service.
- One worker process per CPU core, so more processes than JVM or Go engines.
- Basic reporting compared to platforms like PFLB or k6.
Protocols supported
HTTP/HTTPS, REST natively; WebSocket, gRPC, Kafka and anything else via custom Python clients.
Pricing snapshot (checked September 2026) – $$$$$
- Free, MIT licence.
- Hosted runs: Azure Load Testing at $0.15 per VU hour, or LoadForge subscriptions.
Notes
A developer favourite for scripting flexibility, and the closure of Locust Cloud changed nothing about the engine. Plan the worker fleet, or hand hosting to Azure.
9. Artillery: Flexible Scripting for Modern Protocols

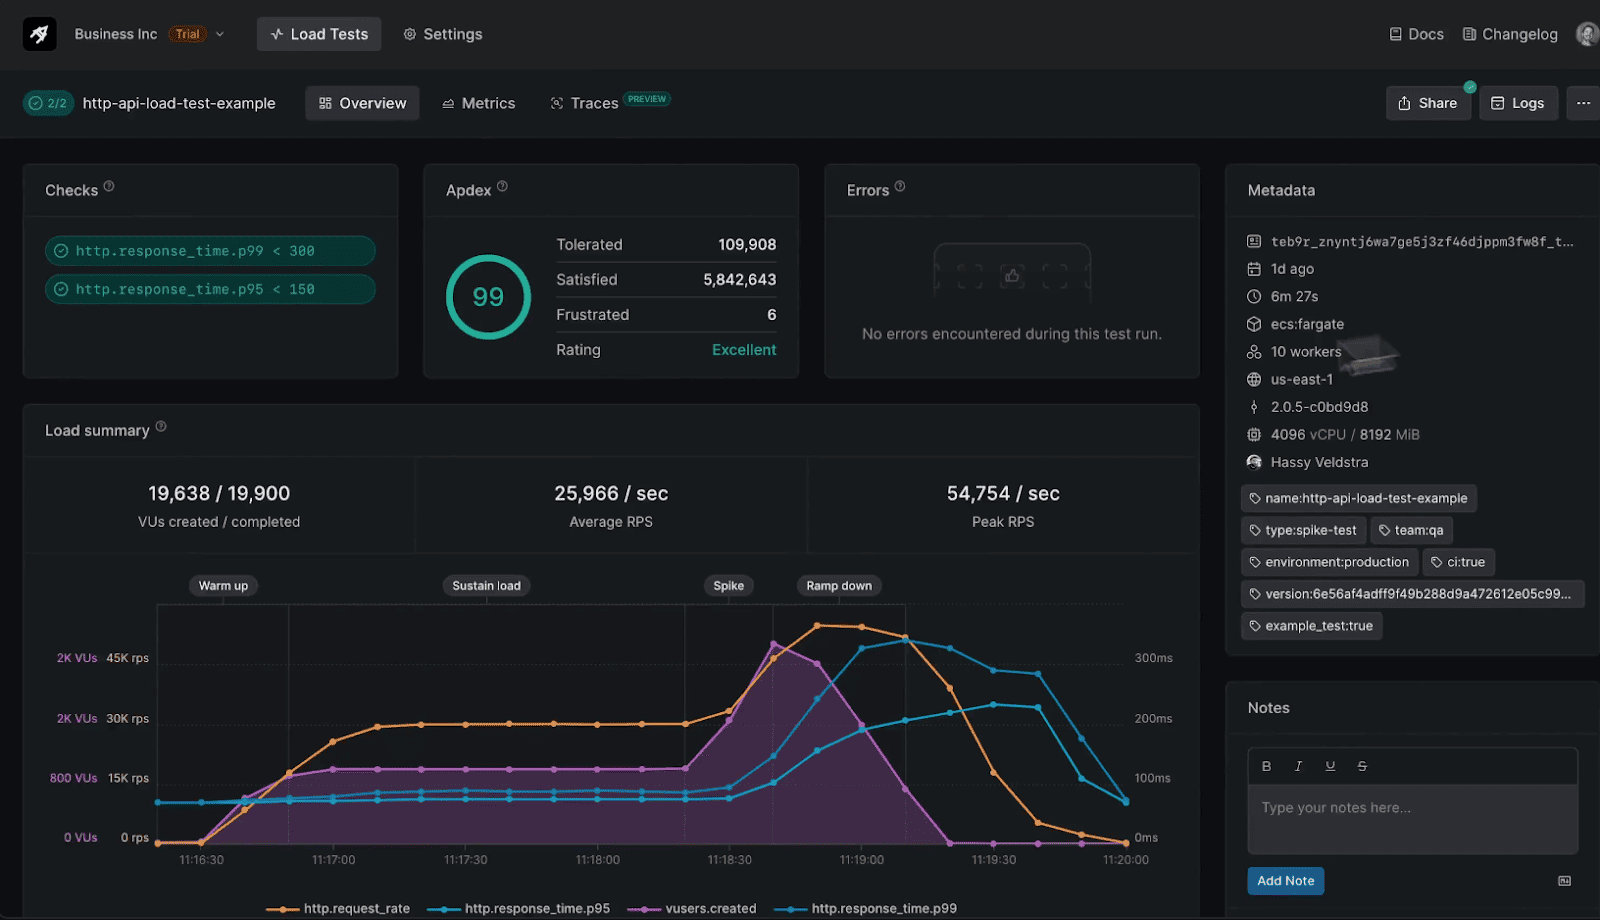
Artillery is code-first and pipeline-native: tests are lightweight YAML with JavaScript where needed, the CLI is open source (MPL-2.0), and distributed runs fan out to Lambda or Fargate workers inside your own AWS or Azure account. Artillery Cloud adds the dashboard, history and per-test reports.
What sets it apart is pairing backend load with end-to-end browser tests: Playwright scripts run as load, Chromium only, in the same pipeline as HTTP, WebSocket and Socket.IO scenarios. Artillery even publishes the arithmetic for a 5,000-browser test ($34.06 of Fargate Spot for half an hour), which is unusually honest and unusually split.
The subscription meter counts test reports (1,000 a month on Team), while the load runs in your cloud account on your bill. Three caps to check before the price: a test stops at 30 minutes on Free and two hours on Team, a Lambda run cannot exceed 15 minutes or be aborted, and Azure needs a subscription beyond five workers.
Best for
Developer-centric teams on AWS or Azure that want load and end-to-end tests in one pipeline, with workers inside their own account.
Pros
- Lightweight, developer-friendly syntax (YAML/JS); open-source CLI.
- Distributed load from your own AWS or Azure account; no vendor generators to trust.
- Playwright support for browser-based testing alongside protocol load.
- Artillery Cloud adds hosted dashboards, history and collaboration; free tier available.
Cons
- CLI-driven; requires scripting and technical expertise.
- No support for JMeter, Gatling, or other OSS frameworks.
- Two bills: the subscription covers reporting, your cloud account covers the load.
- Test caps of 30 minutes (Free) and two hours (Team); limited analytics, no bottleneck detection.
Protocols supported
HTTP/HTTPS, REST, WebSocket, Socket.IO; browser-based testing via Playwright (Chromium); gRPC, GraphQL and Kafka via plugins.
Pricing snapshot (checked September 2026) – $$$$$
- Open-source edition: free (MPL-2.0); Artillery Cloud Free with 30-minute tests.
- Team: $159 per month billed annually ($199 month to month), 1,000 test reports a month, two-hour tests.
- Business: no per-test limit, by quote; cloud compute billed by AWS or Azure separately.
Notes
Best for developer-heavy teams that want fine-grained control and one pipeline for load and end-to-end tests. Budget the cloud compute separately and read the duration caps before the plan.
10. Loadium: Cloud Load Testing with Script Reuse

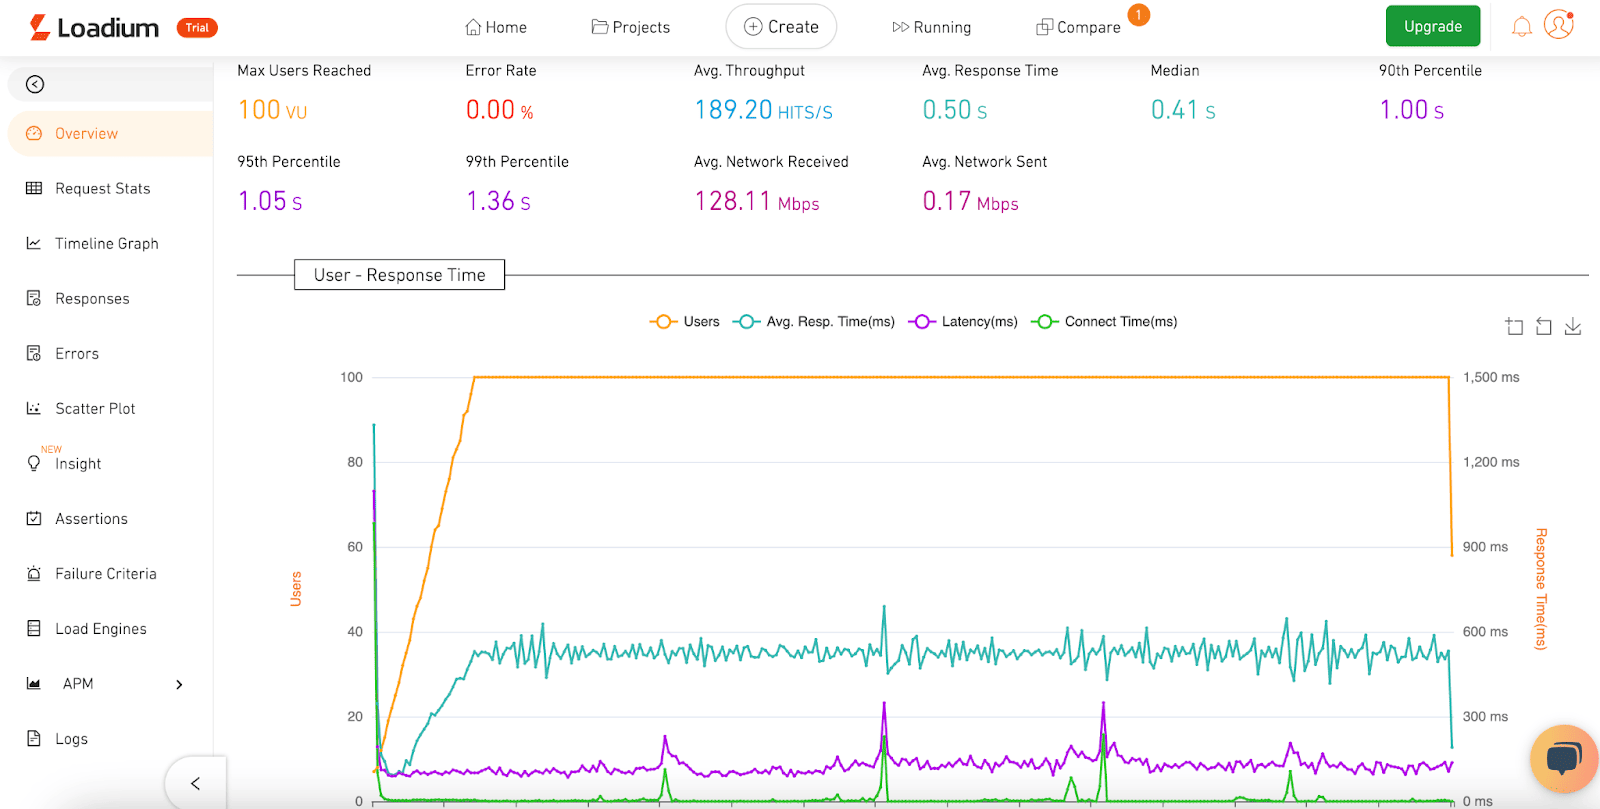
Loadium is a cloud load testing platform built around open-source compatibility: upload and run existing JMeter, Gatling or Selenium scripts as they are, or capture a scenario with the Record & Play browser extension. Distributed tests run from up to 50 locations across AWS, Azure and Google Cloud, with dedicated IPs, slow network emulation and APM integrations for New Relic, AppDynamics and Datadog.
At $79 a month on annual billing ($129 month to month) it is the cheapest published route to a 1,000-user, one-hour test in this comparison, and it passes with nothing to spare: Basic allows exactly 1,000 users, caps a test at exactly one hour and includes 15 tests a month. Pro switches to virtual user hours, 10,000 a month, with three-hour tests.
Finding those numbers is the hard part: the pricing page is a JavaScript application that serves an empty document to anything that does not run scripts, and the vendor's wiki still describes a tier lineup that no longer exists.
Best for
Teams that rely on JMeter or Gatling and want the cheapest published way to scale exactly that test in the cloud, with flexible geography and APM integrations.
Pros
- Runs JMeter, Gatling and Selenium scripts for fast onboarding; Record & Play extension.
- Distributed testing from up to 50 locations across AWS, Azure and GCP; dedicated IPs.
- Cheapest published price for a 1,000-user hour in this comparison.
- Integrates with APM tools (New Relic, Datadog, AppDynamics).
Cons
- Basic stops at exactly 1,000 users and one hour; the next stop is $499.
- No bottleneck detection or production traffic replay; no native gRPC or Kafka.
- Pricing page unreadable without JavaScript; documentation lags the tier lineup.
- Reporting is functional but lacks advanced analytics.
Protocols supported
HTTP/HTTPS, REST, WebSocket, JMS, MQTT, HLS/MPEG-DASH streaming, browser-based testing (via Selenium), plus full JMeter protocol coverage.
Pricing snapshot (checked September 2026) – $$$$$
- Basic: $79 per month billed annually ($129 month to month); 1,000 users, one-hour tests, 15 tests a month.
- Pro: $499 per month; 10,000 VU hours, three-hour tests; custom pricing available.
Notes
Loadium balances ease of use with a low published price for straightforward JMeter cloud runs. Check the user and duration ceilings against your test before choosing on price.
11. LoadNinja: Real-Browser Load Testing Without Scripting

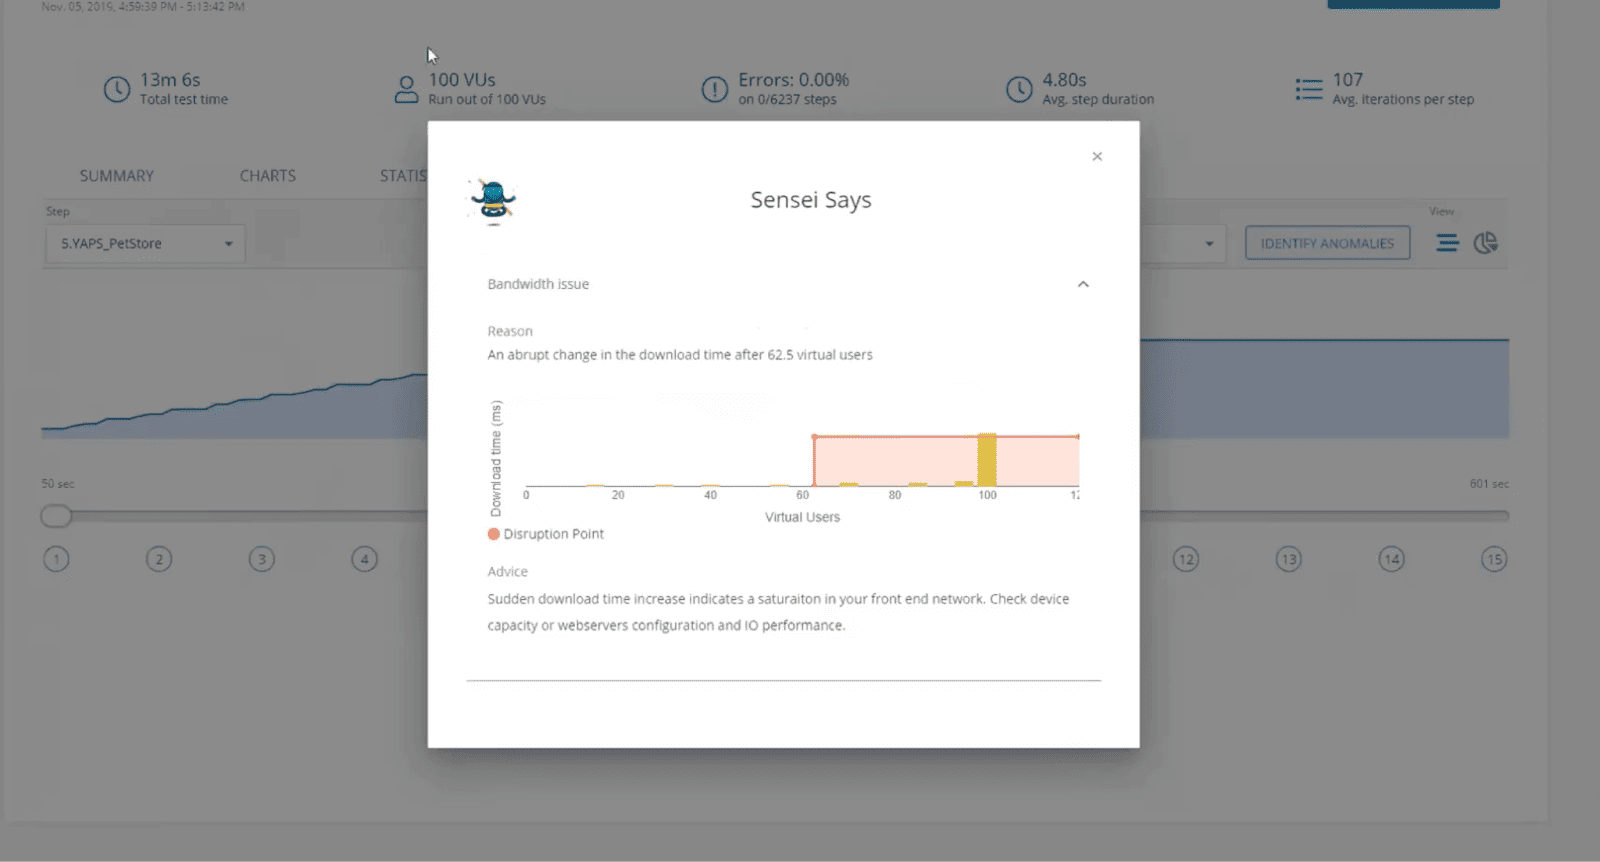
LoadNinja, a SmartBear product, records real browser sessions and replays them as load. Every virtual user runs in its own browser on the vendor's machines and keeps its own state, so, as the documentation puts it, no data correlation is needed. That removes the scripting step for QA teams that would otherwise not have one.
Know what comes back: navigation timings, DNS, connect, first byte and DOM load, per step and per user. Not Core Web Vitals; if LCP and INP under load are the numbers you need, NeoLoad RealBrowser and k6 browser report them and LoadNinja does not. Injectors start from eleven zones, and there is no private cloud option.
Pricing is a bundle of load testing hours at a fixed user ceiling: $350 for 25 hours at 100 users, rising to $1,375 at 500. Unused hours expire after a year, heavier machine tiers burn them at 2x and 4x, and beyond 500 users you are talking to sales.
Best for
QA and development teams that want fast, browser-level load tests of smaller applications with minimal scripting effort.
Pros
- Real browser execution for accurate end-user performance metrics.
- Record-and-playback scenarios without scripting or correlation.
- Detailed browser-level analytics per step and per user.
- Prepaid hour packs with no subscription; 14-day trial.
Cons
- No private cloud or on-premise injectors.
- Published plans stop at 500 virtual users; larger tests are quote-only.
- No Core Web Vitals in results; no AI workflow we could verify.
- Prepaid hours expire after a year; heavier machine tiers consume them at 2x and 4x.
Protocols supported
Browser-based testing (real browsers), REST and SOAP via browser interactions, Oracle Forms, SAP GUI Web.
Pricing snapshot (checked September 2026) – $$$$$
- Free trial: 14 days, no credit card required.
- Packs of 25 load testing hours: $350 at 100 virtual users, up to $1,375 at 500 virtual users.
- Above 500 virtual users: custom enterprise pricing.
Notes
The simplest route to browser-level validation of a smaller application. For 1,000-browser peaks or systems behind a firewall, look at LoadView or NeoLoad instead.
12. LoadForge: Locust-Based Cloud Load Testing with AI Script Generation

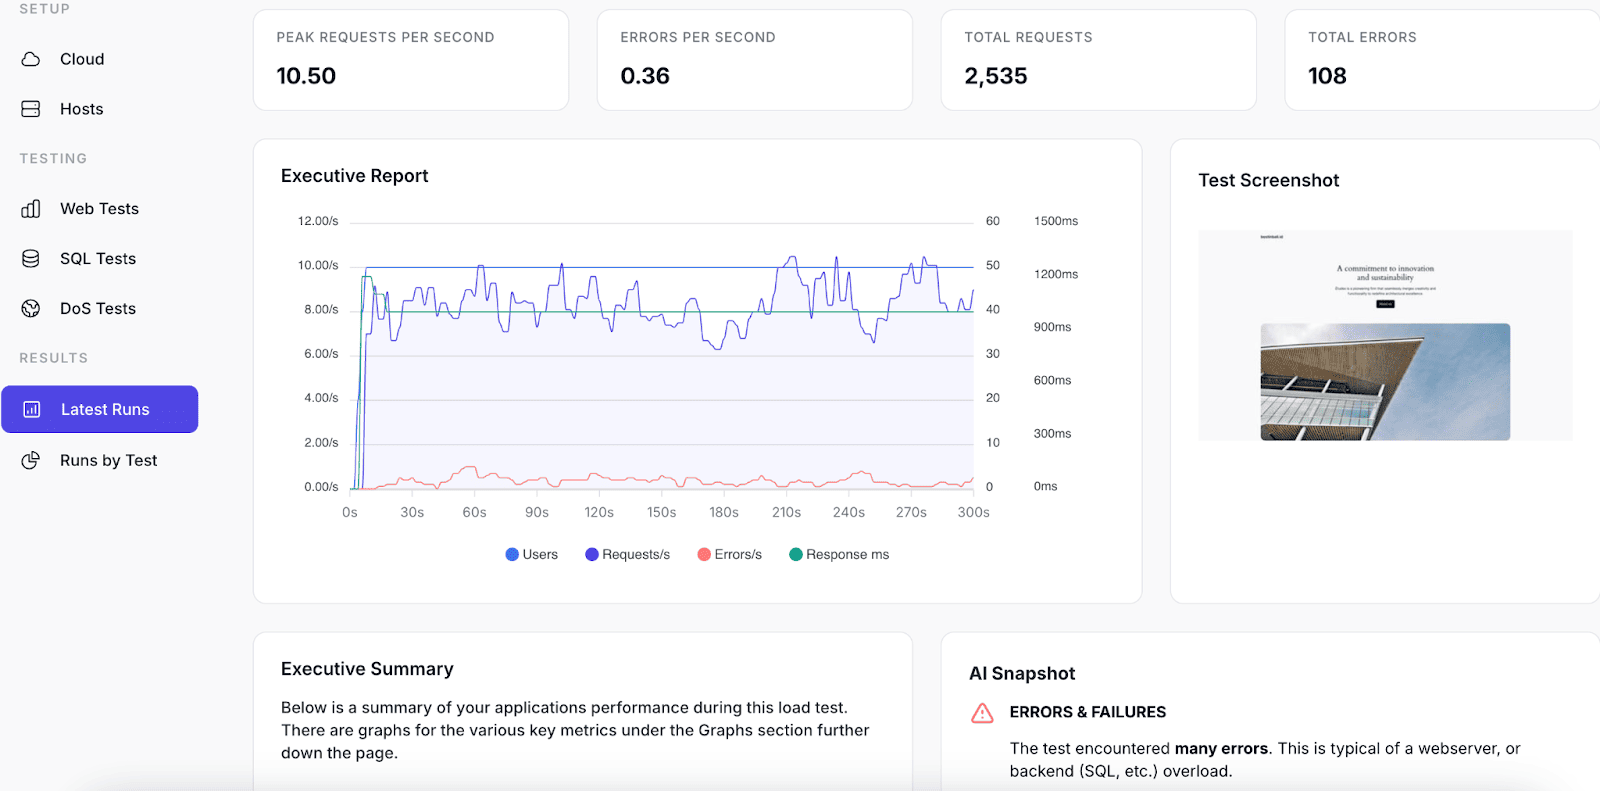
LoadForge is Locust as a service: a web interface and hosted generators over the Locust engine, with scheduled runs, CI/CD integration and public pricing. Tests are built in the UI, pasted in as Python, or generated by an AI assistant that writes Locust scripts from a description.
It competes on the meter rather than the engine: virtual user hours are unlimited on every tier and you pay for test minutes instead, with bring-your-own workers at $1 per server-hour. The catch is stated plainly on the pricing page and missed by most comparisons: a single test is capped at ten minutes on Basic and thirty on Essential, while those plans advertise ten and fifty thousand concurrent users.
A weekly one-hour test is therefore impossible below the $417 Premium tier, which turns the cheapest headline price in this comparison into one of the more expensive real ones. That is an argument for reading the duration column before the price column, here and everywhere else.
Best for
Small teams that test in short bursts, dislike per-VU-hour metering and want a simple Locust-compatible cloud service with AI script generation.
Pros
- Hosted load generators with optional bring-your-own workers at $1 per server-hour.
- Intuitive web interface; Locust script support; AI assistant writes Locust scripts.
- Unlimited virtual user hours on every tier; CI/CD integration and real-time analytics.
- Public pricing and a library of example scripts.
Cons
- No free plan.
- Tests capped at 10 minutes on Basic and 30 on Essential, whatever their user counts promise.
- A one-hour test requires the $417 Premium tier.
- Limited configurator (no ramp-up curves, limited parameterization); basic reporting.
Protocols supported
HTTP/HTTPS, REST, WebSocket, gRPC, plus Locust coverage via custom Python clients.
Pricing snapshot (checked September 2026) – $$$$$
- Basic: $67 per month, tests up to 10 minutes; Essential: $242, up to 30 minutes.
- Premium: $417 per month, tests up to 6 hours, 60,000 test minutes a month.
- Bring your own workers: $1 per server-hour.
Notes
A fair managed Locust with an unusual meter. Short spike tests get a bargain; hour-long soaks should be priced at the Premium tier from the start.
13. OpenText Core Performance Engineering (LoadRunner): Enterprise Load Testing Suite with 50+ Protocols

LoadRunner did not go away, it was renamed. In October 2025 OpenText retired the LoadRunner names: LoadRunner Cloud became OpenText Core Performance Engineering, Professional and Enterprise followed, and existing scripts keep working. The family spans a vendor-operated SaaS control plane with cloud or private generators and a self-managed edition you run yourself.
The stagnation folklore is wrong too. The release record shows several releases a year: an ISO 8583 finance protocol, Oracle 2-Tier on 23ai, OpenTelemetry export, and in 26.1 AI-driven analysis, the Aviator scripting assistant, MCP workflows and a purpose-built LLM protocol for testing applications with embedded language models. The protocol list is still the widest in the market: SAP GUI, Citrix ICA, Oracle Forms, MQTT and fifty more.
The commercial motion changed less. The product page routes to sales, but the AWS Marketplace listing prices Core Performance Engineering at $0.15, $0.30 and $1.50 per virtual user hour for developer, protocol and browser traffic. A weekly 1,000-user hour at the protocol rate is about $1,200 a month, before a load-generator multiplier that doubled consumption in the licensing docs' own example, and the subscription only activates against an already-provisioned tenant.
Best for
Regulated enterprises with unusual protocols (SAP GUI, Citrix, Oracle Forms, ISO 8583), LoadRunner-compatible assets to protect and a compliance case to answer.
Pros
- The broadest protocol list in the market: 50+ including SAP GUI, Citrix ICA, Oracle Forms, ISO 8583 and an LLM protocol.
- SaaS with cloud or private generators, hybrid, or fully self-managed deployment.
- AI-driven analysis, Aviator scripting assistant and MCP workflows in release 26.1.
- Existing LoadRunner assets keep working; runs JMeter, Gatling and Selenium scripts too.
- Published metered rates on AWS Marketplace.
Cons
- Provisioning starts with a sales conversation, whatever the marketplace listing says.
- Load-generator multiplier can double VU-hour consumption; licensing by edition, capacity and protocol class.
- The most expensive published protocol rate in this comparison.
- Binary script formats and VuGen skills: the learning curve is the enterprise one.
Protocols supported
50+ protocols: Web HTTP/HTML, TruClient browser, SAP GUI, Citrix ICA, Oracle 2-Tier and Forms, ISO 8583, MQTT, JDBC, Java, .NET, plus a dedicated LLM protocol.
Pricing snapshot (checked September 2026) – $$$$$
- AWS Marketplace: $0.15 (developer), $0.30 (web protocol) and $1.50 (GUI/browser) per virtual user hour.
- A weekly 1,000-user hour at the protocol rate is about $1,200 a month before the generator multiplier.
- Professional and Enterprise editions by quote.
Notes
If your estate speaks SAP GUI, Citrix or a payment switch, this is still the suite that reaches it, and it moves faster than its reputation. Everyone else pays for protocols they do not use.
14. Tricentis NeoLoad: Enterprise Performance Testing with Governed Authoring

NeoLoad is the other enterprise suite, owned by Tricentis since 2021 and the usual shortlist rival to LoadRunner. Its protocol set is narrower but covers the expensive ground: SAP GUI with RFC actions, Citrix, Oracle Forms, HTTP/2 and WebSocket. The designer runs on Windows, Mac and Linux, and tests can live as YAML in Git, which the incumbent's binary format still cannot do.
Its RealBrowser engine drives actual browsers and reports Core Web Vitals (LCP, INP and CLS), making NeoLoad the one enterprise suite here that measures what the user saw rather than what the server sent. A machine-learning pass over rate, error and duration metrics flags anomalies after the run. Two absences to check: gRPC sits on the roadmap, not in the docs, and ServiceNow support is a marketing page, not a protocol.
Tricentis publishes no price. The number that circulates, about $20,000 a year for 300 virtual users, comes from a third-party price guide, so treat it as a bearing, not a quote. Reviewers call NeoLoad the cheaper of the two enterprise suites and its newer licensing policy the less friendly to smaller companies.
Best for
Enterprises on SAP, Citrix or Oracle Forms that want protocol reach with a modern designer, governed asset reuse and tests as YAML in version control.
Pros
- SAP GUI with RFC actions, Citrix, Oracle Forms, HTTP/2 and WebSocket coverage.
- RealBrowser engine reports Core Web Vitals under load.
- Visual and code-based (YAML) design; designer on Windows, Mac and Linux.
- Automated analysis and assistant integrations (AI action A2); licensed virtual users across cloud or private zones.
Cons
- No public pricing; the quote comes before the first test.
- Licensing policy is unattractive for smaller companies.
- gRPC still on the roadmap; some integrations are marketing pages rather than protocols.
- Platform breadth requires a real pilot to evaluate.
Protocols supported
HTTP/HTTPS, HTTP/2, WebSocket, SAP GUI (RFC), Citrix, Oracle Forms, SOAP, JMS, MQTT; real browsers via RealBrowser.
Pricing snapshot (checked September 2026) – $$$$$
- Quote only; concurrent-VU packs or VU hours priced by sales.
- Third-party guides cite about $20,000 a year for 300 virtual users; not a vendor figure.
Notes
The enterprise suite to pilot when SAP or Citrix is in scope and you want tests in Git and Core Web Vitals in the report. Small teams should look elsewhere: nothing is published.
15. Azure Load Testing: Managed JMeter and Locust Execution Inside Azure
Azure Load Testing is what the closure of Locust Cloud points at. It runs JMeter and Locust scripts on managed engines inside your Azure subscription, reaches private applications through VNet injection, collects Azure Monitor metrics (CPU, disk, network) for the servers under test, and lands on the subscription bill like any other resource. RBAC, Azure DevOps and GitHub Actions come with the platform.
It is an execution service, not a substitute for test design: you still write the JMX or the Locustfile. Browser testing is a separate product, Playwright Workspaces, billed per browser-minute.
The meter is pure consumption, and finding it takes archaeology: the pricing page renders placeholder dollar signs while the real rates sit in Microsoft's Retail Prices API. At $0.15 per virtual user hour for the first 10,000 a month, $0.06 beyond, plus a $10 resource fee, a weekly 1,000-user hour is about $610 a month, more than every self-serve platform here. Being already in the building is the argument; price is not.
Best for
Teams already on Azure who want managed JMeter or Locust execution as one more resource in the subscription, with VNet reach and Azure metrics on the same screen.
Pros
- Runs JMeter and Locust scripts unchanged on managed engines.
- VNet injection for private applications; Azure Monitor server metrics during the run.
- RBAC, Azure DevOps and GitHub Actions integration; bills to the existing subscription.
- The hosted path recommended by the Locust maintainers; Azure Monitor assists the investigation after a run (AI action A1).
Cons
- A portal feature for Azure estates, not a product you adopt on its own.
- No test design help; scripting is entirely yours.
- More expensive per VU hour than every self-serve platform here at a weekly 1,000-user hour.
- Rates hidden behind a calculator; browser testing is a separate, separately billed product.
Protocols supported
Everything JMeter and Locust support on managed engines; browser via Playwright Workspaces (separate product).
Pricing snapshot (checked September 2026) – $$$$$
- $0.15 per virtual user hour for the first 10,000 a month, $0.06 beyond, plus a $10 monthly resource fee; 50 VU hours a month free.
- A weekly 1,000-user hour is about $610 a month.
- Browser testing: Playwright Workspaces, billed per browser-minute.
Notes
If you are on Azure and own the scripts, this is the path of least resistance. If you are not, it is not a product you would choose.
Other Load Testing Tools Worth Knowing
Three more names come up in every shortlist conversation. None of them fits the numbered list above, each for a different reason, and each deserves a paragraph.
BrowserStack Load Testing
BrowserStack runs API load through k6, JMeter, Gatling and Locust scripts and real-browser cohorts through common automation frameworks, in one managed service and one report. Capacity is reserved rather than metered loosely: API engines take blocks of 1,000 virtual users, browsers use one pod per user, and multi-region runs reserve extra engines. The meter is documented, the price is a quote, so model both before comparing it with a $99 platform. AI action: A1.
Speedscale
Speedscale captures real traffic in Kubernetes and replays its shape against the service under test, with automatic mocks for downstream dependencies, so nobody authors the user journeys. Pricing follows ingested data rather than virtual users, which makes a per-VU comparison meaningless, and captured production traffic brings a privacy and retention decision with it. AI action: A1.
WebLOAD
RadView's WebLOAD is the one independent, publicly traded vendor left in the enterprise tier. Scripts are JavaScript, and the documented protocols cover HTTP(S), HTTP/2, SOAP, WebSocket, JMS, IBM MQ, MQTT, AMQP and JDBC, plus Oracle Forms and other enterprise clients. The published Starter plan is $499 a month with a 500-user ceiling and a two-hour cap per test; the Professional tier that reaches 1,000 users is priced by quote.
Vegeta
Vegeta is a single Go binary with a different model: you declare a request rate, not virtual users, and it holds that rate constant while workers scale to sustain it. MIT licensed, 25,000 GitHub stars, text, JSON and histogram reports. For the questions it answers (can this service hold 5,000 requests a second, and what happens to latency when it does) a pool of simulated users is the wrong abstraction. It does not simulate people clicking.
Taurus
Taurus is not a load generator. It is a YAML front end that installs, configures and runs the real ones: JMeter by default, plus Gatling, Locust, k6, Selenium, Playwright and a dozen others, with unified pass-fail criteria and reporting. Maintained by BlazeMeter (Perforce), Apache 2.0, and alive: release 1.16.51 shipped in June 2026. One configuration format and one CI step for a team that runs several engines.
Conclusion
Choosing the right load testing tool in 2026 ultimately comes down to who will own the work. If you need a first result in hours, AI-generated tests from the functional cases you already have and a report that explains the bottleneck, PFLB stands out. For developers who want deep observability, Grafana Cloud k6 ties directly into monitoring stacks. Teams invested in JMeter may prefer OctoPerf, BlazeMeter or Loadium, while Gatling delivers cost-effective scalability at very high concurrencies and Apache JMeter remains the free default. LoadView and LoadNinja focus on browser-based validation, Locust and Artillery appeal to teams that prefer scripting, and OpenText Core Performance Engineering and NeoLoad still own SAP, Citrix and Oracle Forms.
In the end, the best choice depends on your specific requirements: protocol coverage, budget, team skills, CI/CD integration, or end-user simulation. Read the cap on a single test before the price, take advantage of free tiers where possible, compare results against your service-level goals, and select the platform that aligns best with your applications and workflow. If you would rather buy the outcome than drive the platform, PFLB's performance testing services run the whole programme with the engineers who built the tool. Request a quote and an engineer will scope it with you.
Frequently Asked Questions About Load Testing Tools
What is the best load testing tool in 2026?
It depends on who will own the work. PFLB is the fastest route to a first result for a QA team without a performance engineer. Apache JMeter is the safest open-source default for protocol breadth on your own generators. Grafana Cloud k6 fits JavaScript teams that live in Grafana, Gatling fits JVM teams that treat tests as code, OpenText Core Performance Engineering and NeoLoad reach SAP GUI, Citrix and Oracle Forms, and LoadView or LoadNinja are the choice when the risk is in the browser.
Which load testing tools are free?
Apache JMeter, Locust, Gatling, k6, Artillery, Vegeta and Taurus are free open-source engines; you provide the load generators. Free cloud tiers exist too: Grafana Cloud k6 includes 500 VU hours a month, OctoPerf runs 50 users for 20 minutes at no cost, and Azure Load Testing includes 50 VU hours a month. PFLB has no free plan; its $299 Kickstart Month carries a full-refund guarantee instead.
Is JMeter still relevant in 2026?
Yes. JMeter has the largest install base in the category, and half the commercial platforms here run JMX scripts unchanged: PFLB, BlazeMeter, OctoPerf, Loadium, LoadView, Azure Load Testing and OpenText. Its weaknesses are the old ones: someone has to own the generators and plugins, the current release 5.6.3 dates from January 2024, and buyer attention is moving to k6 and Gatling while the installed base stays put.
What happened to Locust Cloud?
Locust Cloud, the maintainers' own hosted service, closed in December 2025 after roughly a year on the market. The open-source Locust engine is unaffected; Microsoft sponsors the lead maintainer, and the official documentation now points hosted users to Azure Load Testing, which runs Locust and JMeter scripts at $0.15 per virtual user hour.
Is LoadRunner still available?
Yes, under a new name. In October 2025 OpenText retired the LoadRunner product names: LoadRunner Cloud became OpenText Core Performance Engineering, and the Professional and Enterprise editions followed. Existing scripts keep working, the protocol list is still the widest in the market, and the AWS Marketplace listing publishes rates of $0.15, $0.30 and $1.50 per virtual user hour.
How much does load testing software cost?
Entry-level cloud plans cluster between $79 and $149 a month: Loadium at $79, Gatling at €89, BlazeMeter at $99, LoadView at $129 and PFLB Team Starter at $149 per seat. Metered services charge about $0.15 per virtual user hour (Grafana Cloud k6, Azure Load Testing) and OpenText publishes $0.30 per protocol VU hour. NeoLoad and WebLOAD Professional are quote-only. Always compare the cap on a single test alongside the price: several entry plans stop at exactly one hour.
Should browser-based virtual users be compared with protocol virtual users?
No. A browser virtual user renders the page in a real browser and costs far more to run: k6 bills browser VUs at ten times protocol VUs, and LoadView's $129 entry plan covers 1,000 users only as protocol traffic. Use protocol load to find server-side bottlenecks at scale and a smaller browser cohort to measure what the user sees.
What does AI change in load testing tools?
Three different things, and the labels blur them. Most tools explain results: LoadView analyses reports and waterfall charts, NeoLoad and Azure assist the investigation, BlazeMeter helps with synthetic test data. Fewer create executable assets: LoadForge writes Locust scripts from a description. A handful operate the lifecycle through an MCP server, so an assistant can create, run, analyse and report: PFLB, which also converts existing functional test cases into JMeter load tests, plus OctoPerf, Grafana Cloud k6 2.0, Gatling Enterprise and OpenText 26.1 with its AI scripting assistant and LLM protocol. We rate that on one scale, A0 to A3, in the table above: ask a vendor which tier it means before comparing checkboxes.