Speed.. It’s not just for cars and athletes; your website needs it too. We know nothing is more frustrating than clicking on a link and waiting…and waiting…for the page to load. If you’re tired of your WordPress site dragging its feet, you’re in the right place.
In this guide, we’ll tackle one of the most concerning questions: how do you speed up a WordPress website? That’s exactly what we’re here to explore. From practical WordPress speed optimization tips to advanced WordPress performance tuning strategies, this guide will help you transform your site’s speed and overall performance.
So, grab a cup of coffee (or tea, no judgment), and let’s dive into the simple tweaks and smart strategies that can turn your sluggish site into a speedster.
Why Do WordPress Websites Slow Down?
Websites are getting heavier every year, and WordPress sites are no exception. To understand this trend, let’s look at some key data and the underlying issues contributing to slow-loading pages.
The Growing Size of Web Pages
The size of web pages has grown significantly over the last decade. According to httparchive.org, the median desktop page weight and mobile page weight has increased.
Today, mobile pages are nearly as heavy as desktop pages, meaning users expect mobile networks and devices to deliver the same experience as desktops, an expectation that is often unmet.
This growth is driven by several factors:

WordPress is a versatile platform, but its flexibility can sometimes lead to performance issues. Here are the most common reasons WordPress sites experience slow loading times:
Why Should You Speed up WordPress Site?
A fast WordPress site doesn’t just increase WordPress speed; it also helps improve overall user experience, SEO rankings, and conversions. By focusing on strategies that improve WordPress performance, you can ensure your site stays competitive and delivers a seamless browsing experience
| Reason | Impact |
| Improved User Experience | Visitors expect pages to load in under 3 seconds. Slow sites frustrate users, leading to higher bounce rates. |
| Higher Search Rankings | Google considers page speed a ranking factor. A faster site improves your SEO and increases visibility. |
| Better Conversion Rates | Studies show faster websites boost conversions, with every second of delay costing potential leads and sales. |
| Reduced Bounce Rates | Users leave slow sites quickly. Faster loading pages keep visitors engaged and exploring. |
| Mobile-Friendly Performance | Speed is critical on mobile devices, where users expect quick and seamless browsing. |
| Competitive Edge | A faster website gives you an advantage over slower competitors, keeping users on your site instead of theirs. |
Key Statistics to Consider

What Is a Fast Website?
Your first question might be, “What is a fast website or app?” The table below shows different levels of response to the system interface.
| Response delay, milliseconds | User perception |
| 0-100 | Instant response |
| 100-300 | A small but noticeable delay |
| 300-1000 | The system works, but it is overloaded |
| 1000-10000 | Likely switching thoughts to other tasks |
| 10000 and more | The task is cancelled (the system does not work) |
For example:
If your potential customers have e-commerce projects, they may have multiple tabs open at the same time with different contractors. Customers will just close the page that does not load quickly. They will not even care what offer was on the page. Content is secondary to loading speed. If customers do not see the offer, it simply does not exist for them.
Actual Website Loading Time
Actual speed is the real-world loading time your users experience. Measuring this helps you understand how your site performs under different conditions. Here are the tools you can use:
Challenges in Analysis
Data will vary due to differences in devices (desktop vs. mobile) and network conditions. For instance, mobile users often face slower speeds.
Synthetic Testing
In this paragraph, we take a look at synthetic testing, which is testing done on our terms. It consists of the server testing part and complex metrics, which we will discuss in more detail.
We recommend using JMeter, a remarkable load testing tool, to test server performance.
Complex metrics measure how a website behaves in a real browser, which is exactly what a client sees, including network parameters, device type.
Tools like Lighthouse and WebPageTest provide insights into how to speed up WordPress website load time and improve WordPress performance by identifying key bottlenecks.
WebPageTest is a system that became open source in 2008. It is now actively maintained and developed. The system is big and contains many advanced features.
Lighthouse is not a separate system but a subsystem of the Chrome browser that executes performance testing in the browser. That is, it loads and collects metrics and then generates reports. The system is much newer than WebPageTest; it was created only a few years ago and is being actively developed. Both systems work with the Chrome browser.
Each system has two types of applications:
WebPageTest
The WebPageTest system offers the following capabilities:
The system’s distributed architecture includes a server responsible for issuing tasks and responding to agents, which execute the tasks.
Most importantly, WebPageTest supports all major browsers: Edge, IE, Firefox, Chrome, and Opera. This is the main advantage of WebPageTest, as your audience most likely uses different browsers.
Additionally, agents are available for Windows and Linux, with the capability to connect to iOS and Android devices. The system also allows customization of channel parameters, such as bandwidth limitations, delays, and packet loss. Furthermore, it collects TCPdump data and screenshots at various load levels, which can be compiled into videos for analysis.
WebPageTest architecture
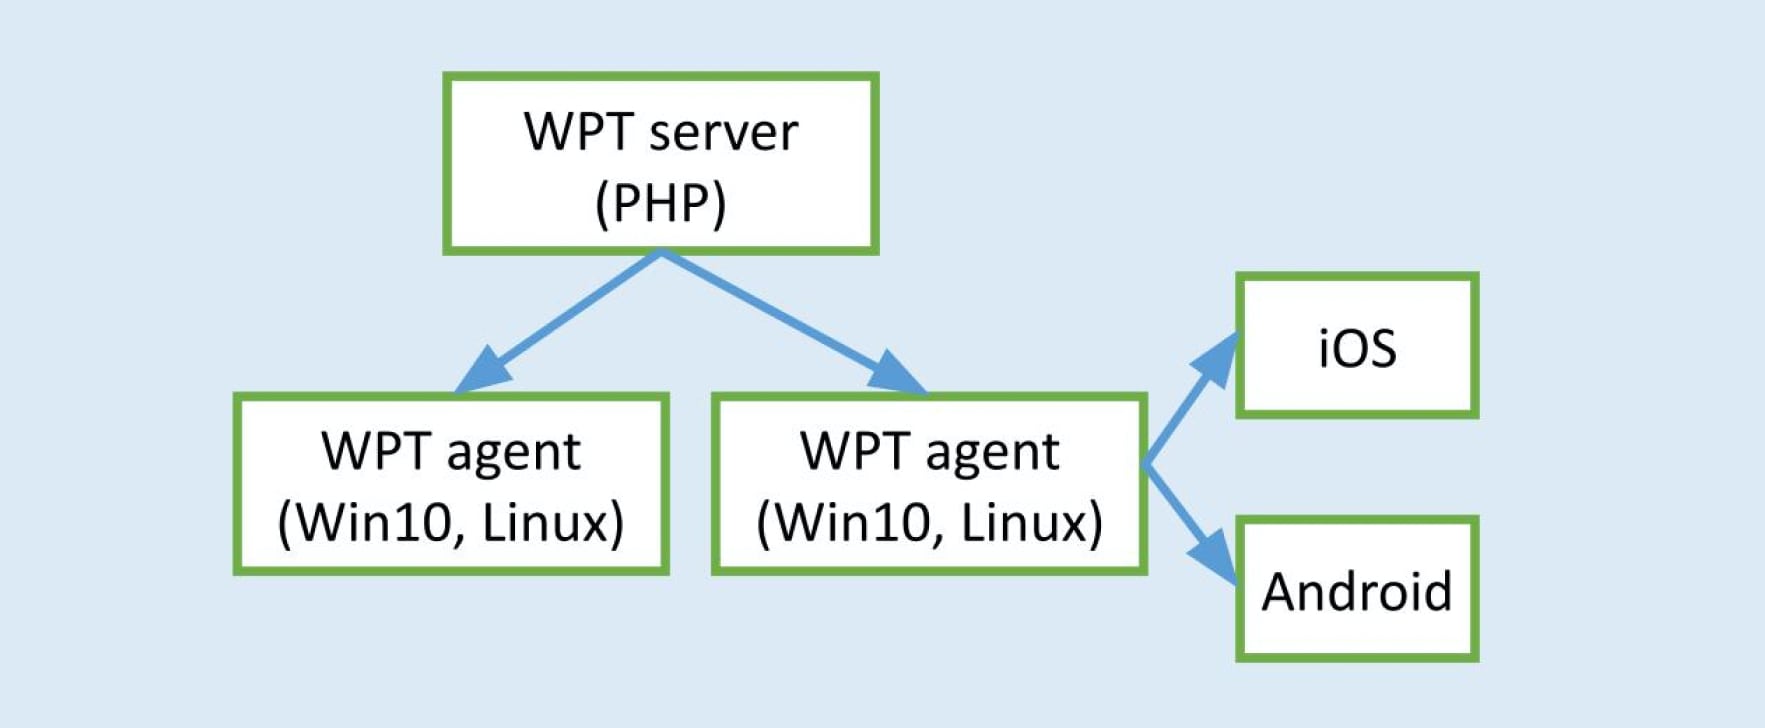
The WebPageTest architecture features a web server that is primarily managed by a PHP application.
WebPageTest web interface
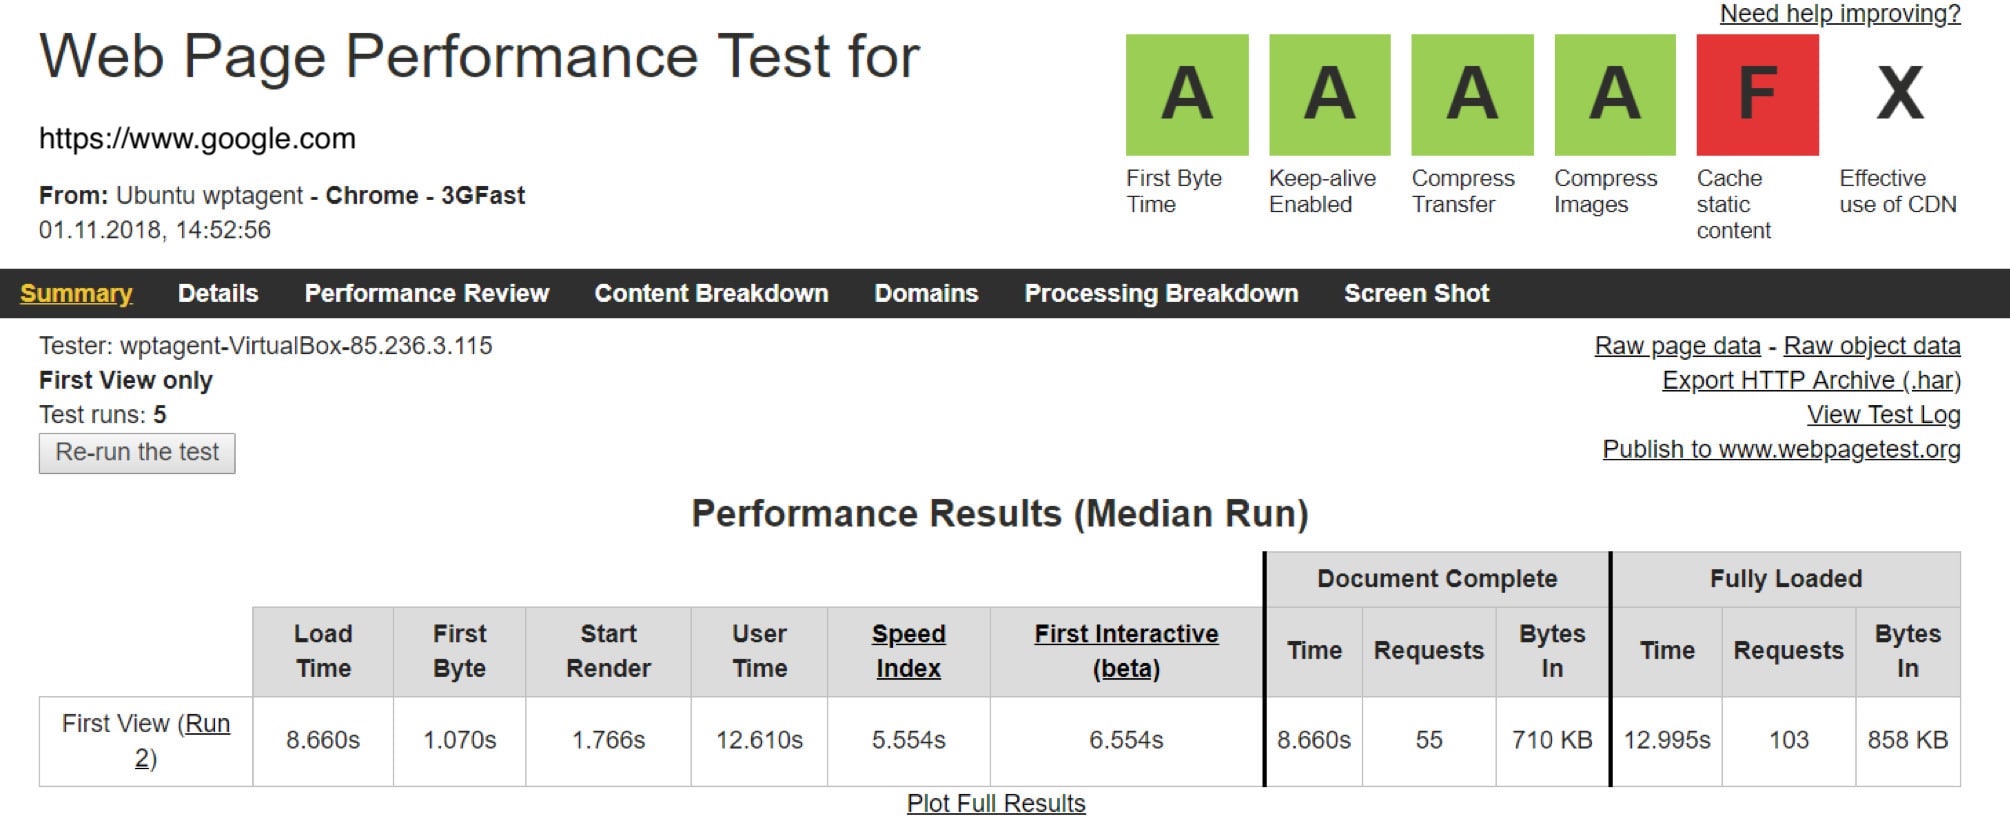
The WebPageTest web interface uses a grading system, ranging from A to F, alongside text-based metrics.
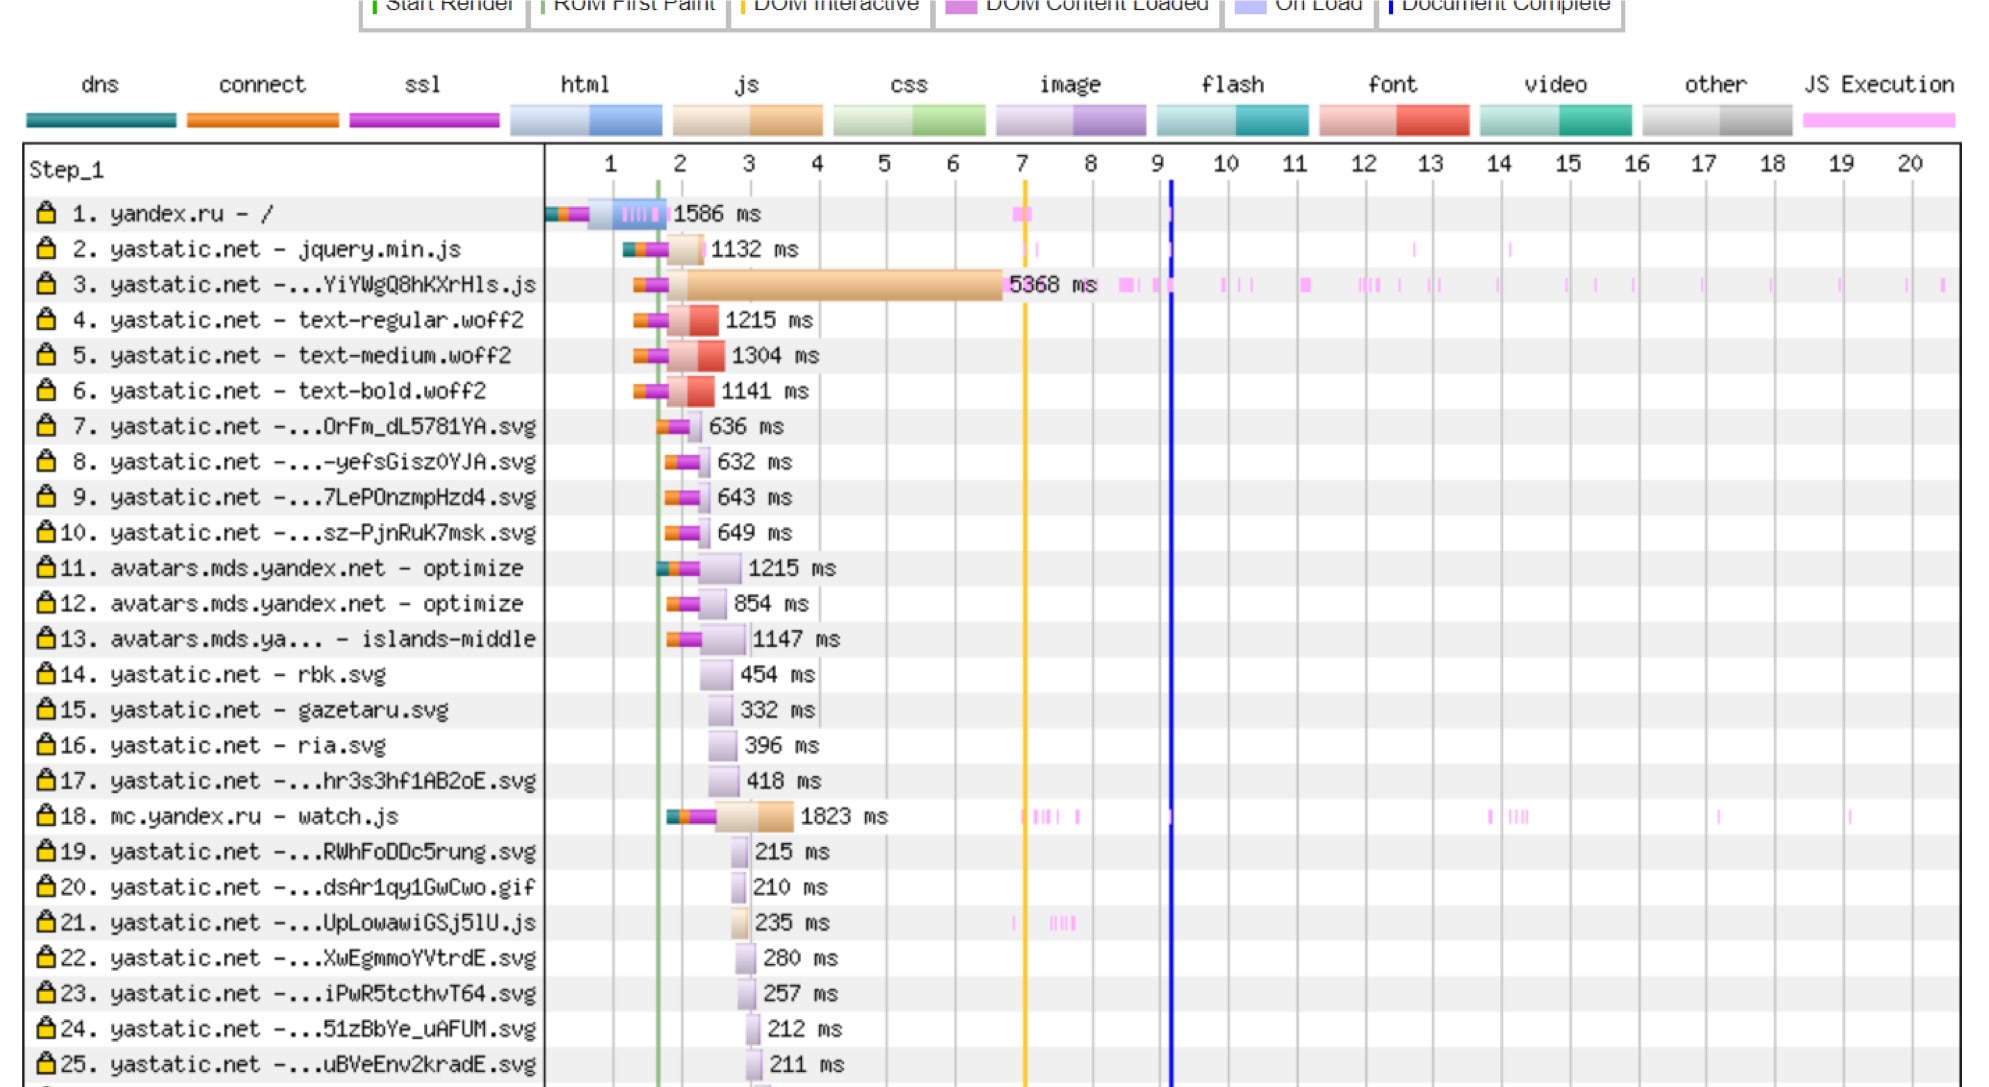
An important feature of WebPageTest is the charts. They show the loading speed for each page or application.
At the top left is the time for HTML, then for CSS, Java Script, text, images, etc. After the seventh second, for example, you can see the overall load time of the page.
At this stage, it is interesting to look at problems that prevented the page from loading faster. This is how the basic website performance optimization happens.
Comparative WebPagetest report
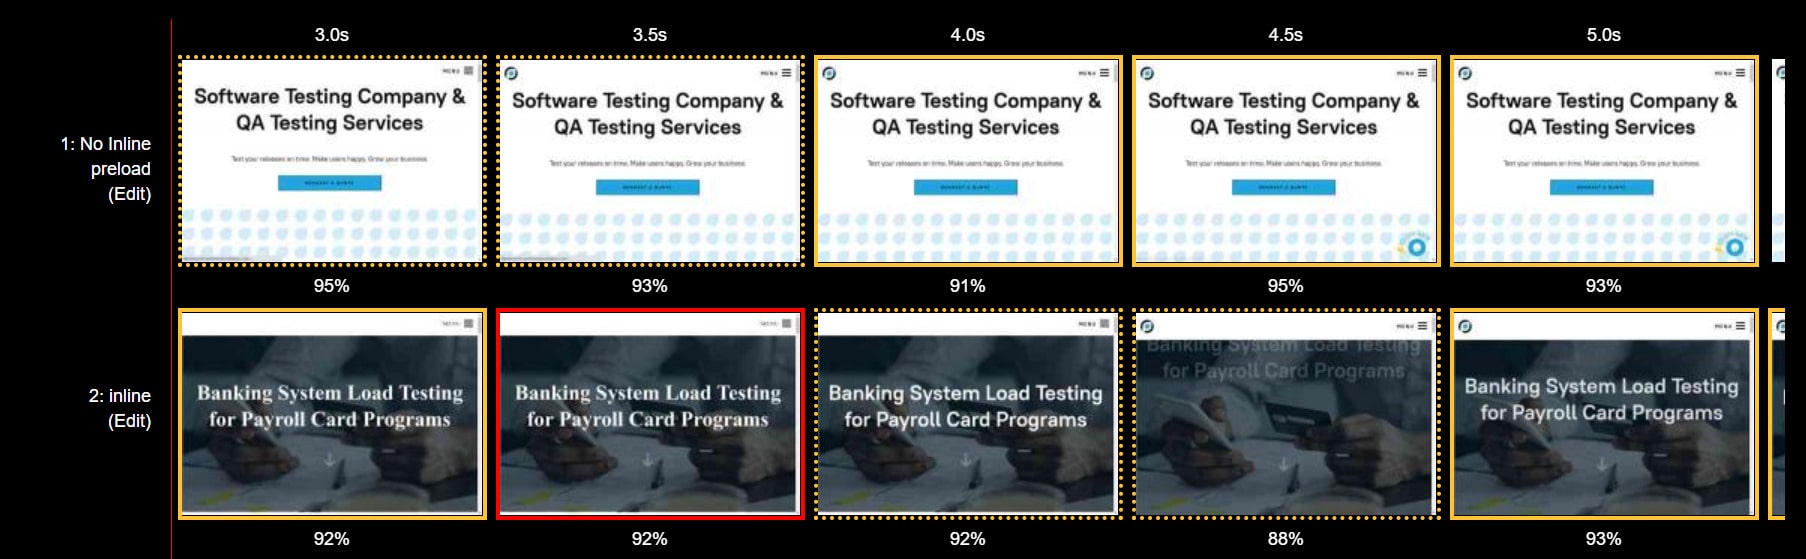
The most important feature of WebPageTest is the screenshots. You can take two tests and compare their progress for each moment. At the bottom of the screenshot, you can see what percentage of the page content has been loaded.
Test result Data Plots
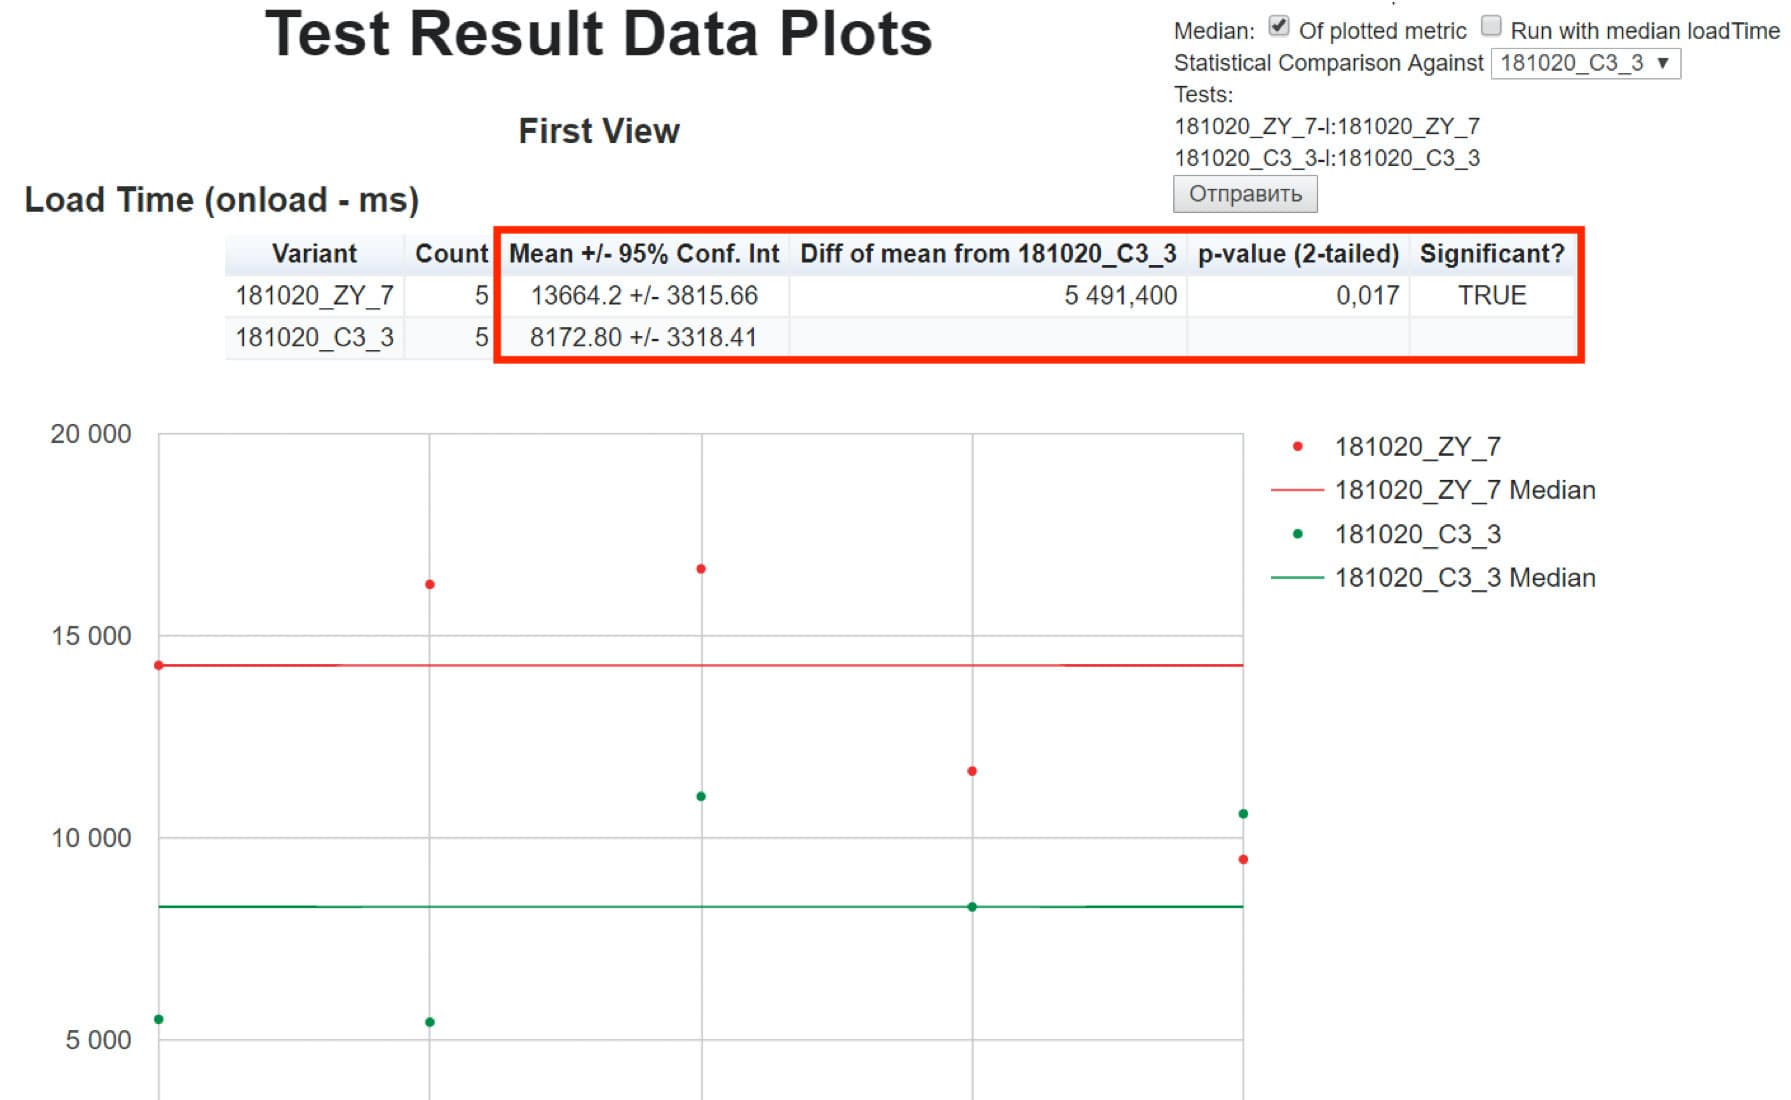
If you are interested in pure analytics, you can take two pre-made tests and compare them. You will see the metric values for each test, the calculated confidence interval and difference in means, and an indication of whether the event was significant. In our example, the event was significant.
WebPageTest WPT can be automated with API. We recommend using the personal version, as you will have to wait a long time for the public version. For automation, you need to do the following:
Lighthouse
Lighthouse provides comprehensive audit and all valuable data to use in website speed optimization. Here are its core features:
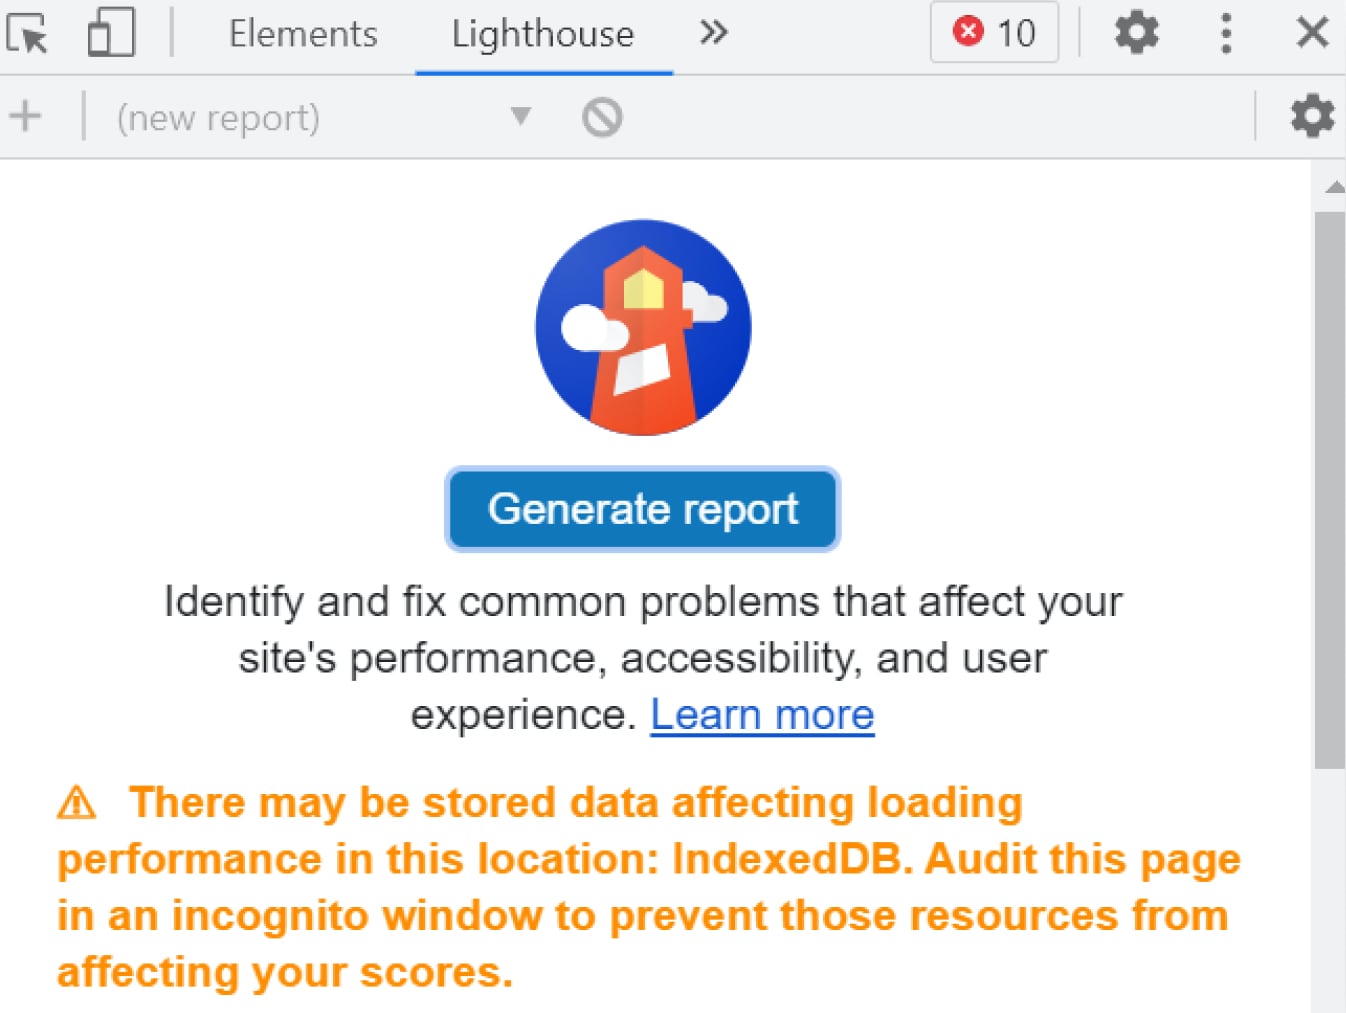
Lighthouse interface
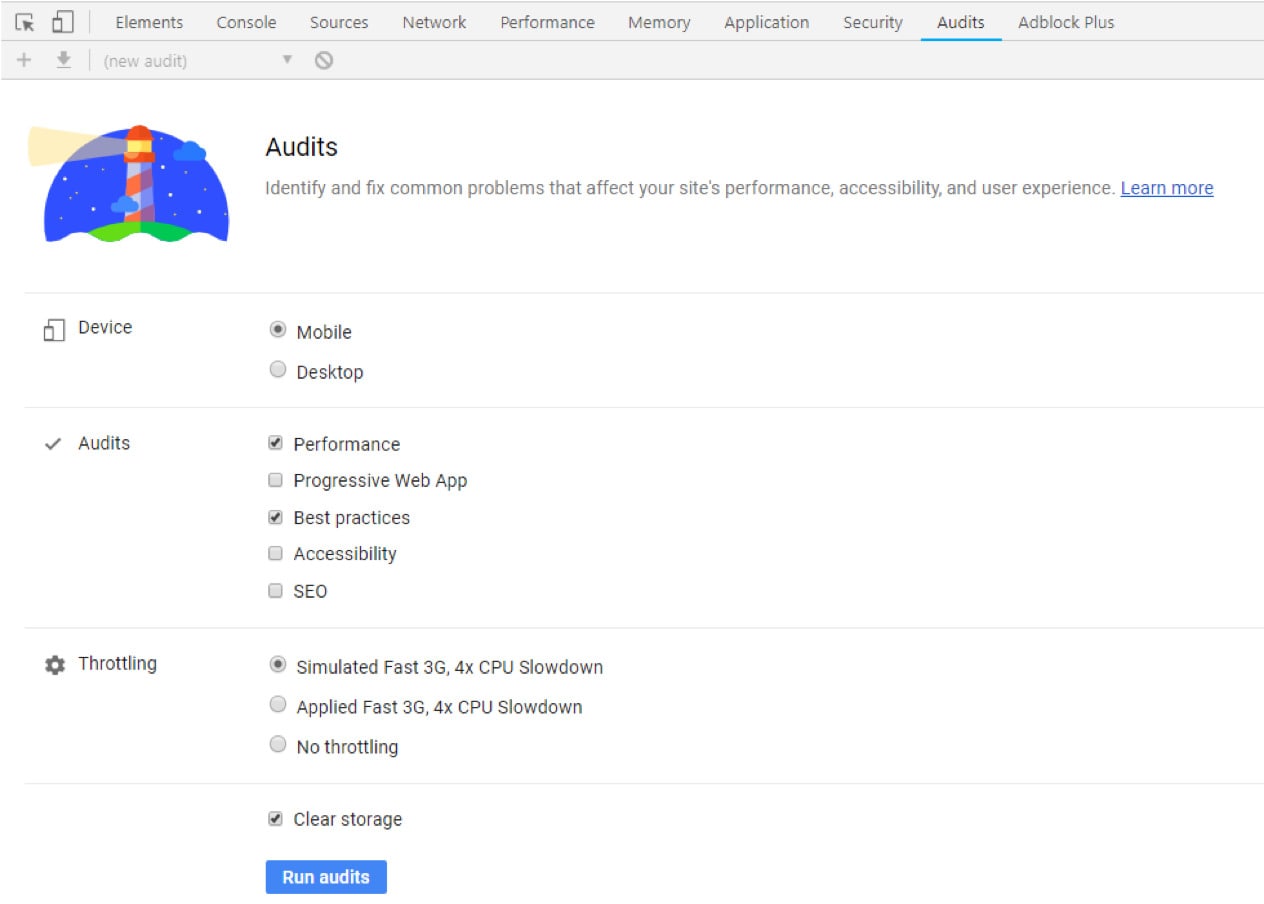
The service interface is a tab within Chrome DevTools. There are also mobile and desktop versions. We recommend paying attention to the following modes in the interface: Performance and Best Practices.
If you want to start Lighthouse locally, you should push the F12 button in the Chrome browser, then choose Lighthouse in the panel and push the Report button.
In Lighthouse, there are fewer network limitation options than in WebPageTest. In the latter, there are various limitations, from 2G to a wired connection, while in the former, there are only three types of limitations. Also, Lighthouse slows down the downloading processes to imitate a real mobile device.
Lighthouse test results
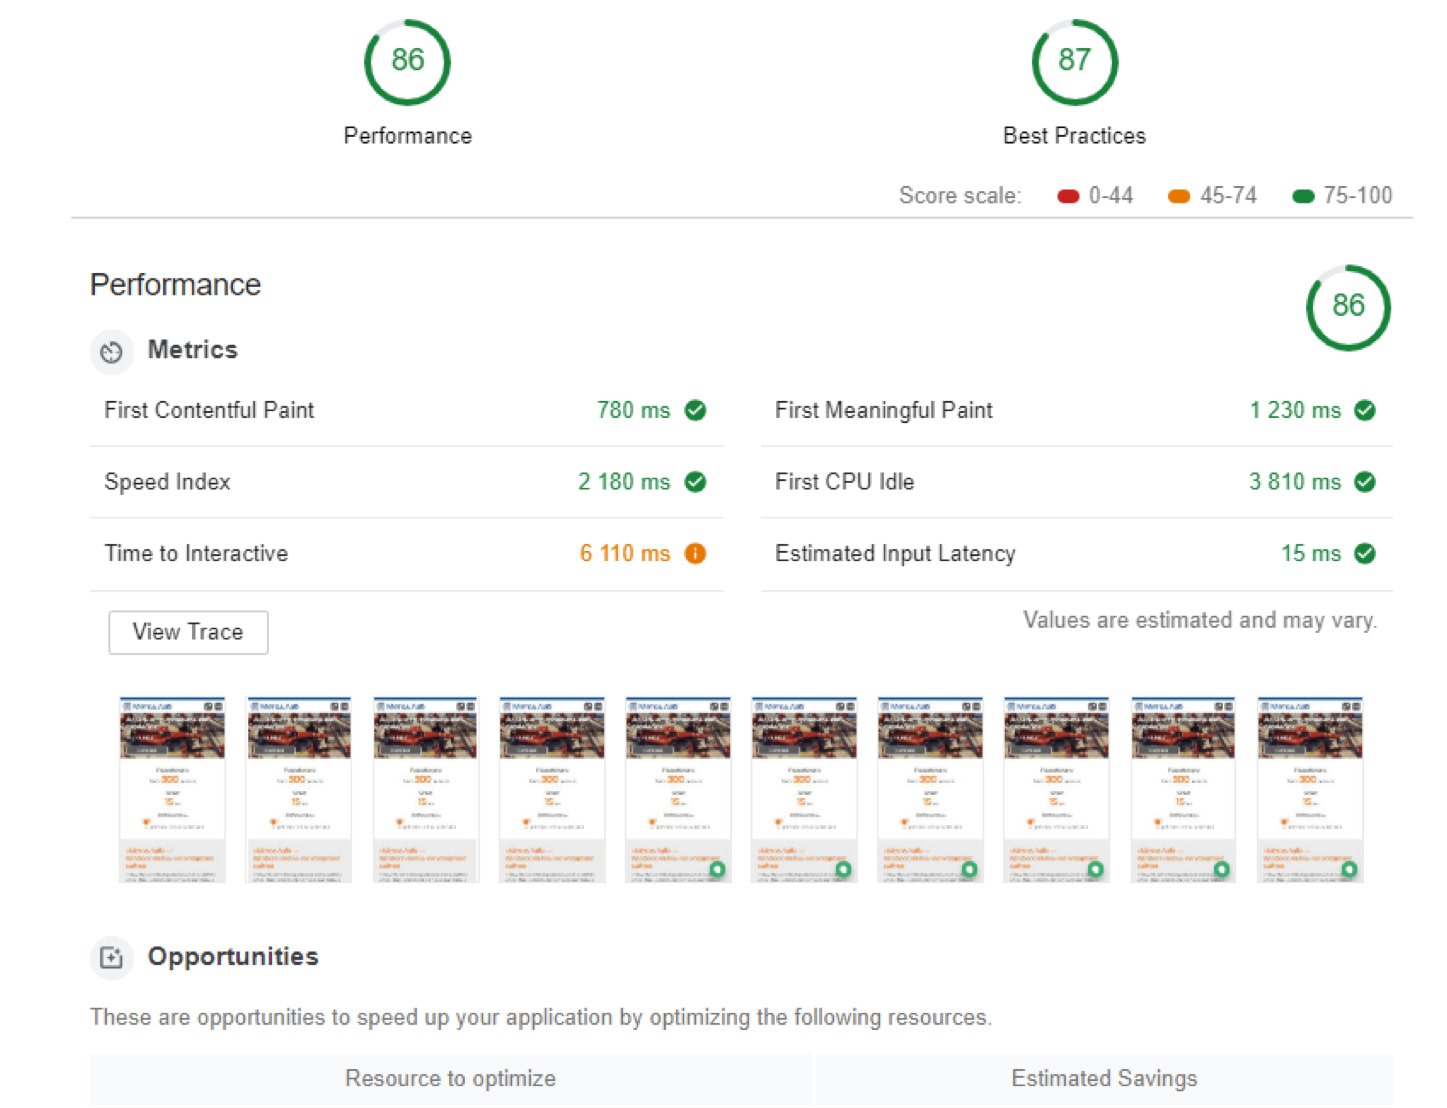
In the report, you can see quality marks at the top. They are almost the same as the marks on the top right of WebPageTest.
That being said, a checklist in Lighthouse comes with the service. When we use it we get a lot of data. But the real metrics are much more important. Lighthouse also provides screenshots, but they are relatively impractical because they do not show the speed index.
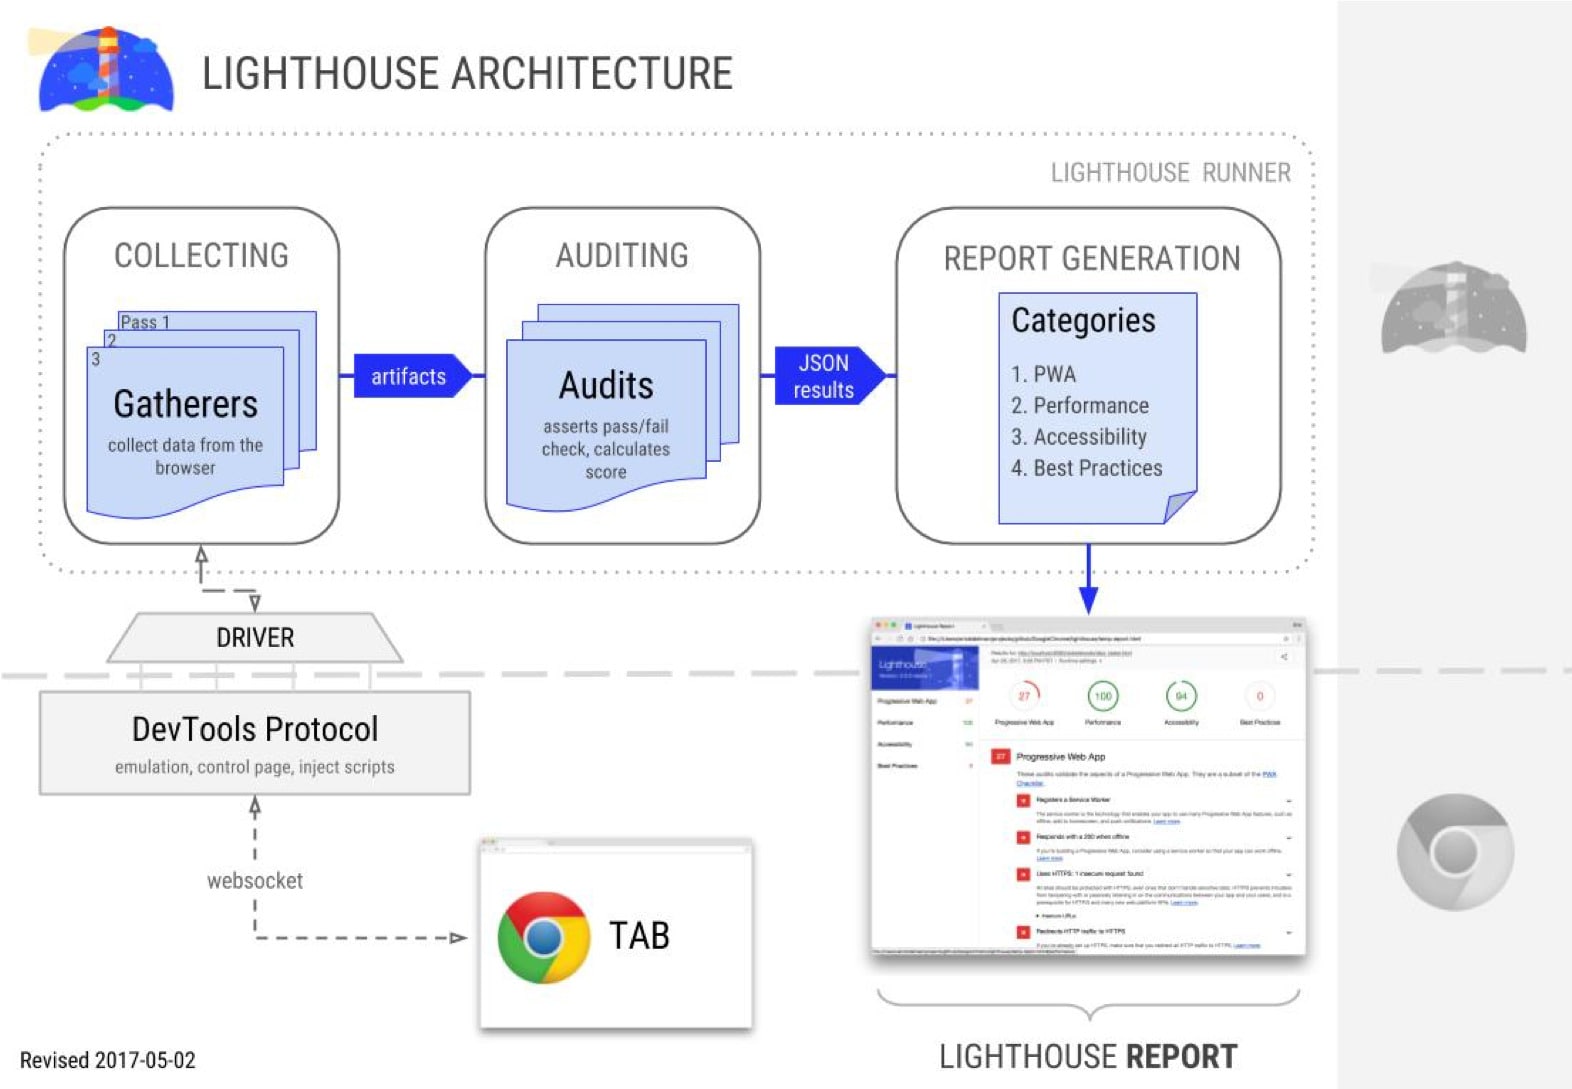
The Lighthouse architecture looks like this: at the bottom, there is a Chrome tab that is connected to the Lighthouse module via the DevTools protocol. The Lighthouse collects the results of three test runs, calculates the metrics from them, and generates the report. The report can be in HTML or other formats.
Lighthouse CLI works in the command line as follows:
Speed Metrics
It’s important to know which metrics to pay attention to for each device. It pays to look at multiple metrics rather than picking just one. In particular, we recommend taking a look at the following parameters:
01 Load time
02 Rendering start time
This is a critically important parameter. A user only pays attention to the moment when the white screen changes to something new while a page is loading. Even if it just changes color, the user sees that the system has reacted and something is happening inside it. That is why some resources use handy spinner icons that rotate while the page loads.
03 Time to first byte
This metric collects all the server performance information. If there are problems on the back end, it’s not as important to run front-end wordpress site speed optimization at the beginning. It’s worth paying attention to the server because it will take longer to respond and to fix the issues.
With the growth of wordpress website performance tuning, new metrics have evolved.
They aim to find a solution to the problem when a metric is not showing the true picture.
04 Speed index (Lighthouse, WebPageTest)
This is an important parameter that shows not only the page loading speed but also how fast the content of a page is visibly populated.
05 First contentful paint (LH)
Measured by Lighthouse, this marks the time when the first text or image is painted.
06 First meaningful paint (LH)
This is the time when the primary content of a page becomes visible, such as a product description or text in a header.
07 Input latency (LH)
Measured by Lighthouse, this is the time between a click and the response of the interface. It is often very long because CSS selectors perform many calculations.
08 Time to interactive (LH)
This is the time that it takes for the page to become fully interactive. When a user clicks, all the buttons are working.
The speed index metric can be displayed as a graph with time and percentage of visibility as axes.
Speed index chart
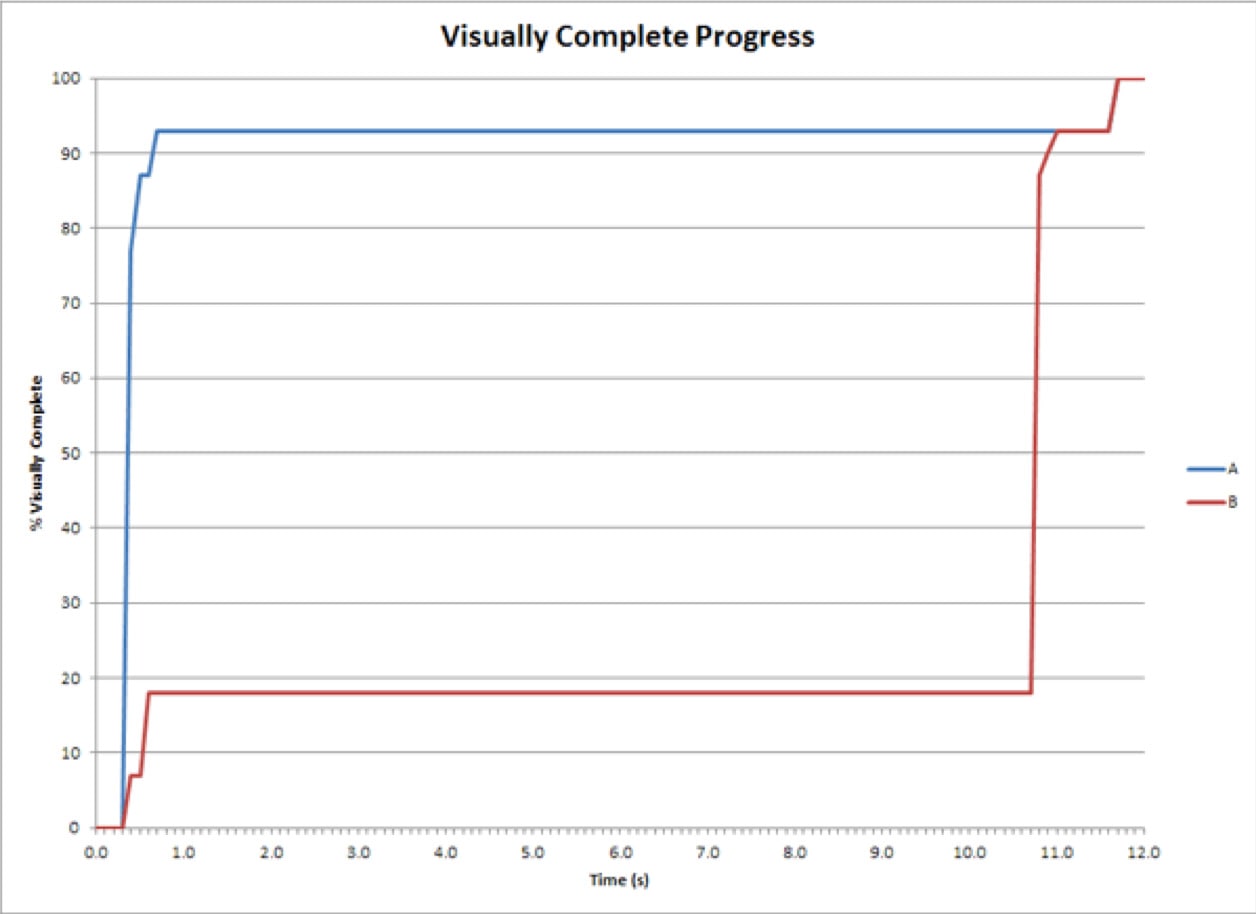
The first example is the red test B, which loaded 18% of the content and stayed at that level until the 11th second, when it started loading the rest of the content. This is an example of a page that takes a long time to load but is fully displayed afterward. The second example is the blue test A, where 92% of the content loaded and the rest followed after the 11th second.
Speed index metric
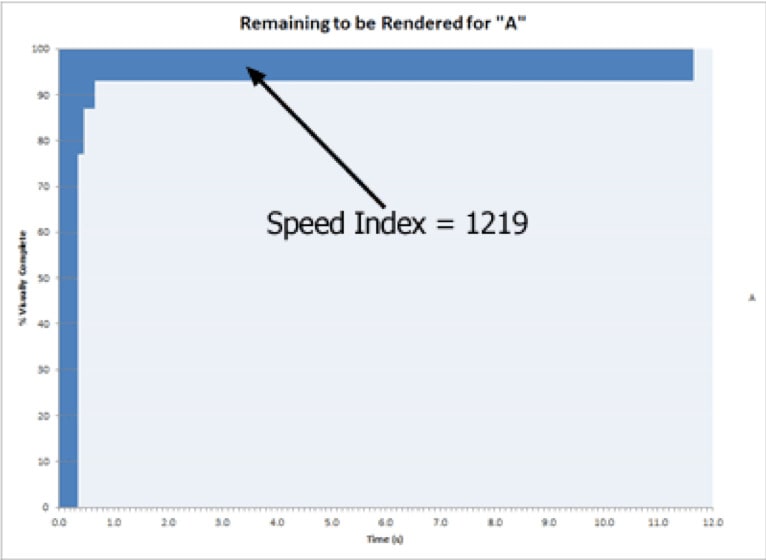
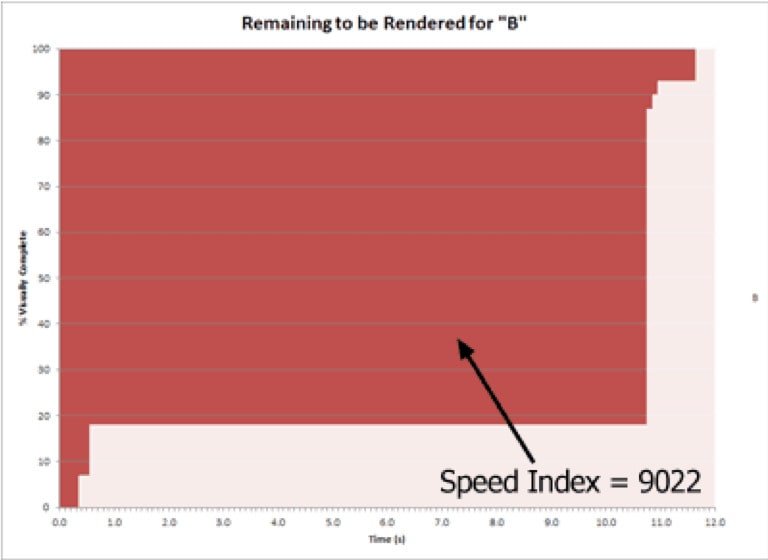
In this case, the pages took the same time to load, but their behavior was completely different. Due to this, a formula that integrates the area above the graph up to 100% is perfect. It is the speed index. The smaller it is, the better.
How to Speed Up a WordPress Website Front-End Loading?
Optimizing your WordPress website’s front-end loading time is essential for improving user experience, boosting SEO rankings, and increasing conversions. Below, we’ve outlined actionable steps, explained their importance, and recommended tools to help you speed up your site.
01 Configure the server
Proper server configuration ensures smooth and efficient delivery of website content.
02 Optimize text resources (CSS, JS, HTML)
Poorly optimized code can slow down your website. Minify your CSS, JavaScript, and HTML files to improve WordPress website speed and ensure faster page rendering.
03 Use text instruments
Text compression ensures files are lightweight and delivered quickly.
04 Optimize images
Large, unoptimized images can significantly slow down your site. HubSpot highlights the importance of compressing images and using appropriate formats.
05 Use web fonts
Fonts can impact loading times if not optimized.
06 Shorten JS blocks
Large JavaScript bundles can delay rendering.
07 Avoid a front-end single point of failure (SPOF)
A single resource failure shouldn’t block the entire page from loading.
08 Use Faster Plugins
WordPress plugins can be a double-edged sword. Choose plugins that are lightweight and well-optimized. For example:
09 Optimize WordPress Database
Over time, your WordPress database accumulates unnecessary data, slowing down queries. Use tools like WP-Optimize to:
10 Choose a Fast, Lightweight Theme
Themes with excessive features or heavy code can slow your site. Select a theme designed for performance, such as:
These themes are lightweight, fast, and built with SEO in mind.
11 Use a Content Delivery Network (CDN)
A CDN distributes your website content across multiple servers worldwide, ensuring faster delivery to users, regardless of location. Popular options include:
12 Reduce Redirects
Redirects are often necessary for guiding users to updated pages or handling moved content, but excessive or poorly managed redirects can significantly slow down your website. Every redirect adds an extra HTTP request and response cycle, increasing load times and frustrating visitors.
To improve performance, audit your site for unnecessary redirects, such as redirect chains (when one redirect leads to another) or loops (redirects that send users in a circle). These not only slow down page loading but can also confuse search engines and harm SEO.
Consider PFLB Your Best Performance Testing Provider
When it comes to performance testing, PFLB stands out as a trusted partner with years of expertise in delivering reliable, tailored solutions. Whether you’re optimizing a WordPress website or scaling enterprise applications, our team ensures your digital systems meet the highest performance standards.
Why Choose PFLB?
PFLB specializes in performance testing, offering unique strengths that set us apart:
Conclusion
Your website’s load speed is a vital asset for business success, directly impacting user satisfaction and conversions. Many websites fall short on performance, but by optimizing your WordPress site, you can gain a competitive edge.
Focus on the key areas covered in this article:
Performance testing is essential, especially during high-traffic events like sales. For more tips and real-world examples, read our article “How to Speed Up a WordPress Site Part 2.” Optimize now to ensure a faster, seamless experience for your customers.