Software interfaces were invented to integrate applications. They work as a kind of port through which you can connect to third-party software and interact with it, for example, send a request to a database and get a response. To make the interface usable for other software, there have to be some rules—what requests can be sent to the application and what the responses will be.
Several standard platforms and protocols are used to create software interfaces. One of the most well-known systems is REST API, based on a popular Internet protocol HTTP. However, there are other ways to organize communication between applications, and one of them is the gRPC framework.
Key Takeaways:
- gRPC uses HTTP/2 and Protocol Buffers, enabling high-performance communication.
- JMeter, Gatling, and specialized plugins can be used for gRPC load testing.
- Important metrics include latency, throughput, and error rate.
- Test scenarios should simulate streaming, unary, and bidirectional calls.
- gRPC benchmarks often outperform REST, but require proper configuration.
- Performance testing ensures microservices using gRPC scale reliably under load.
What Is gRPC
gRPC is a platform that helps create software interfaces based on Remote Procedure Call (RPC) (learn more about what is gRPC). gRPC was originally developed by Google but was later converted to open-source software. Unlike REST API, the system allows third-party subprograms to run as if they were run locally, although in fact they may be running on a different computer. This approach is faster and simpler than traditional HTTP requests.
The API created with gRPC consists of a server and a client. The client generates procedure calls, and the server processes them. There may be a variety of such interactions, as gRPC initially supports different programming languages and lets clients of different applications communicate with the server. Architectural differences provide a framework with a speed higher than in REST API. The thing is, the messages exchanged by applications under gRPC are smaller. In addition, HTTP/2 allows a full-fledged, bidirectional flow of data exchange, instead of acting in the “request-response” paradigm, as in HTTP 1.1.
Testing gRPC’s performance requires tailored approaches to capture its unique strengths and potential limitations.
You can also read our detailed comparison of gRPC vs REST, , and if you’re weighing broader options beyond these two, browse gRPC alternatives for side‑by‑side use cases and trade‑offs.
Core Objectives of gRPC Performance Testing
The goal of gRPC load testing is to ensure the API can handle real-world scenarios efficiently while maintaining stability under varying loads. Here are some key objectives:
- Assess the throughput (queries per second or QPS) under normal and heavy loads.
- Measure the latency (response time) for different types of gRPC calls, including unary, streaming, and bidirectional.
- Evaluate resource utilization, such as CPU and memory usage, during peak traffic.
- Ensure scalability to accommodate increased demands without performance degradation.
Discover more about gRPC performance testing, how it works, and more- gRPC performance testing guide
How to Test gRPC Performance
No matter how fast and progressive gRPC is, do not forget to check its speed. If the API is not working well, you may lose some requests, along with some users of your application. Therefore, it is important to regularly check performance by defining API benchmarks, which include:
- Average and maximum delay of a single request sent by a single client;
- Number of queries per second (QPS) sent by a pair of clients using 64 bidirectional channels and a 100-message stack;
- QPS per a processor core.
The main difference between gRPC performance testing tool and that of other parts of an application or site is the necessity to check the complete two-way data exchange. Its analysis requires special methods and tools, because the testing involves two parties. It is important not only to check the ability of the server to handle many requests from the client, but also the client’s ability to “digest” the data stream from the server. We have selected the best gRPC testing tools for you.
Curious about the most effective gRPC performance testing tools? Check out our curated list of tools and take your testing to the next level! Check Top 7 gRPC Performance Testing Tools
Methods and Strategies for gRPC Performance Testing
Simulate Real-World Workloads
Begin by recreating realistic client-server interactions. This involves testing various types of gRPC calls:
- Unary calls: A single request and response cycle.
- Server streaming: The server sends a stream of responses to a single client request.
- Client streaming: The client sends a stream of requests to the server.
- Bidirectional streaming: Both client and server exchange streams of data simultaneously.
By simulating these scenarios, you can evaluate how the system behaves under typical workloads.
Load Testing for Throughput and Latency
Measure how many queries per second (QPS) the system can handle while maintaining acceptable latency. gRPC load testing tools like PFLB allow you to define test parameters such as the number of concurrent clients, message sizes, and call types to understand the system’s performance envelope.
Stress Testing to Identify Limits
Push the system to its breaking point by increasing the number of concurrent streams or data flows. Focus on:
- The server’s ability to manage multiple requests simultaneously.
- The client’s capacity to process incoming data streams without lag.
Test Protocol Buffers Serialization
Since gRPC uses Protocol Buffers for serialization and deserialization, it’s crucial to test how efficiently your Protobuf schemas handle large or complex data. Inefficient schemas can introduce delays and resource bottlenecks.
HTTP/2-Specific Testing
Test the impact of HTTP/2’s multiplexing and header compression on gRPC performance. Verify that connections are reused efficiently and that the server can handle multiple streams over the same connection.
Monitor Resource Utilization
Monitor CPU time, memory, and network bandwidth during tests to ensure that your gRPC implementation scales efficiently without overloading resources.
Performance Profiling with Observability Tools
Use observability tools like Grafana to gather real-time insights into latency, QPS, and resource utilization. Profiling data helps pinpoint bottlenecks and areas for optimization.
Automate Testing for Consistency
Automate gRPC performance tests using continuous integration tools. Regular testing ensures that updates or changes to your API don’t inadvertently degrade performance.
Tools like PFLB support automated testing pipelines, ensuring consistency in performance tests as your system evolves.
How to Set Up gRPC service for performance testing
Before diving into load testing gRPC processes, you need to set up a functioning gRPC server and client. This step-by-step guide will walk you through the process using Python, from installing the required tools to creating a simple gRPC testing client and server.
Step 1: Install gRPC for Python
To begin, install the necessary Python packages for gRPC using pip:
pip install grpcio grpcio-tools
The grpcio package provides the core gRPC library, while grpcio-tools helps compile Protocol Buffers (Protobuf) files into Python code.
Step 2: Define the Service Interface in a Protocol Buffers File
Create a .proto file to define your gRPC service. For example, let’s create a service called TestService with a method GetMessage that takes a Request message and returns a Response message.
syntax = "proto3";

service TestService {
  rpc GetMessage(Request) returns (Response);
}

message Request {
  string name = 1;
}

message Response {
  string message = 1;
}
Save this file as test_service.proto.
Step 3: Generate Python Code from the .proto File
Use grpcio-tools to compile the .proto file into Python code:
python -m grpc_tools.protoc -I. --python_out=. --grpc_python_out=. test_service.proto
This command generates two files:
test_service_pb2.py: Contains message classes.test_service_pb2_grpc.py: Contains service classes and stubs.
Step 4: Implement the gRPC Server
Create a Python script (server.py) to implement and run the gRPC server:
import grpc
from concurrent import futures
import test_service_pb2
import test_service_pb2_grpc

# Implement the service
class TestServiceServicer(test_service_pb2_grpc.TestServiceServicer):
    def GetMessage(self, request, context):
        return test_service_pb2.Response(message=f"Hello, {request.name}!")

def serve():
    server = grpc.server(futures.ThreadPoolExecutor(max_workers=10))
    test_service_pb2_grpc.add_TestServiceServicer_to_server(TestServiceServicer(), server)
    server.add_insecure_port("[::]:50051")
    print("Server is running on port 50051...")
    server.start()
    server.wait_for_termination()

if __name__ == "__main__":
    serve()
This script:
- Implements the
TestServiceinterface defined in the.protofile. - Creates and starts a gRPC server listening on port
50051.
Step 5: Create a gRPC Client
Write a Python script (client.py) to interact with the gRPC server:
import grpc
import test_service_pb2
import test_service_pb2_grpc

def run():
    with grpc.insecure_channel("localhost:50051") as channel:
        stub = test_service_pb2_grpc.TestServiceStub(channel)
        response = stub.GetMessage(test_service_pb2.Request(name="gRPC Tester"))
        print(f"Server response: {response.message}")

if __name__ == "__main__":
    run()
This script:
- Connects to the server on
localhost:50051. - Calls the
GetMessagemethod, passing aRequestwith the name “gRPC Tester.”
Step 6: Test Your Setup
- Start the server by running
server.py:python server.py - Run the client to interact with the server:
python client.py
You should see the server respond with Hello, gRPC Tester!.
This setup forms the foundation for performance testing. Once your gRPC service and client are running, you can integrate performance testing tools like PFLB, ghz, or Fortio to evaluate your API’s throughput, latency, and scalability.

• Discuss different options
• Receive a personalized quote
• Sign up and get started
gRPC Performance Testing with PFLB
PFLB provides powerful tools for performance testing gRPC services, helping you measure throughput, latency, and scalability. Here’s a step-by-step guide to using PFLB for gRPC performance testing:
Step 1: Set up PFLB
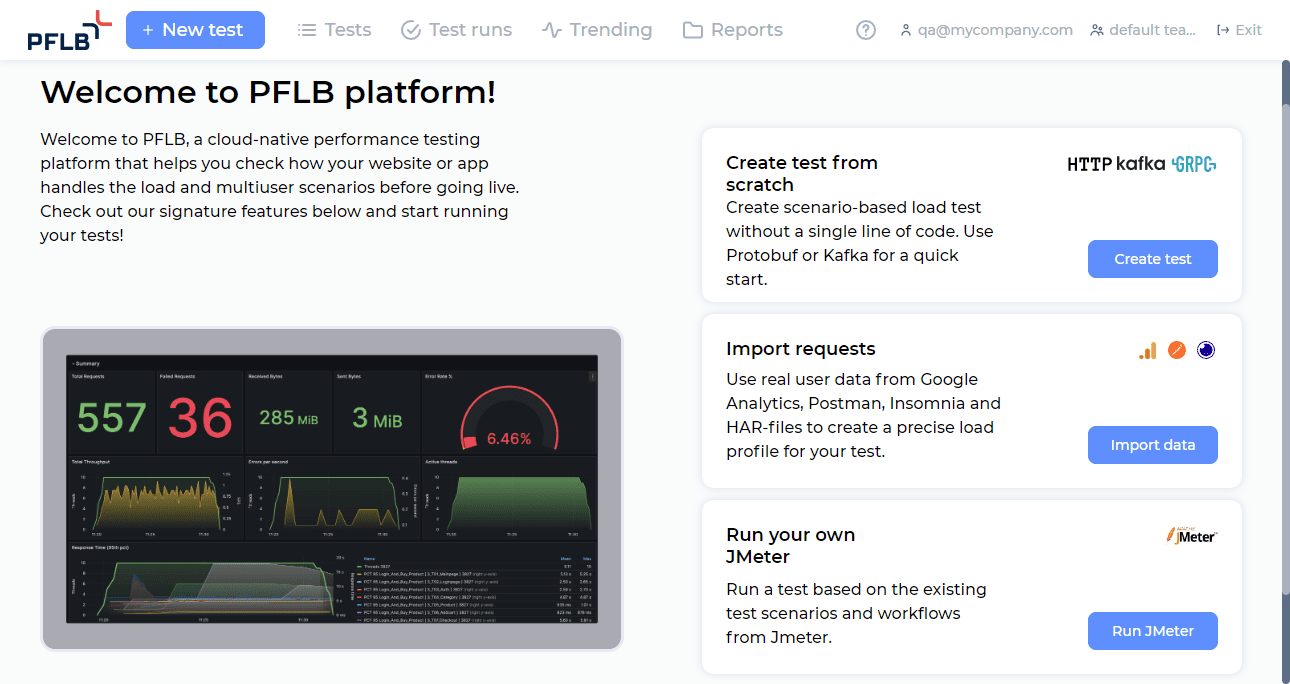
Simply visit the PFLB Platform login page, click Sign up, and fill in your email and password. Once you’ve created your account, the platform’s start screen will open, and you’ll automatically be added to the default team, ready to start testing.
Step 2: Import Your .proto File
To begin testing your gRPC service, you’ll need to import the Protocol Buffers (Protobuf) file that defines the service’s methods and messages. The .proto file acts as a blueprint for the platform to understand your gRPC API.
- Open the Import Data pane in the PFLB interface.
- Click the
 button to upload your
 .protofile. - Select the file from your system (ensure it’s under 100 MB).

- Once uploaded, click Close to save the configuration.
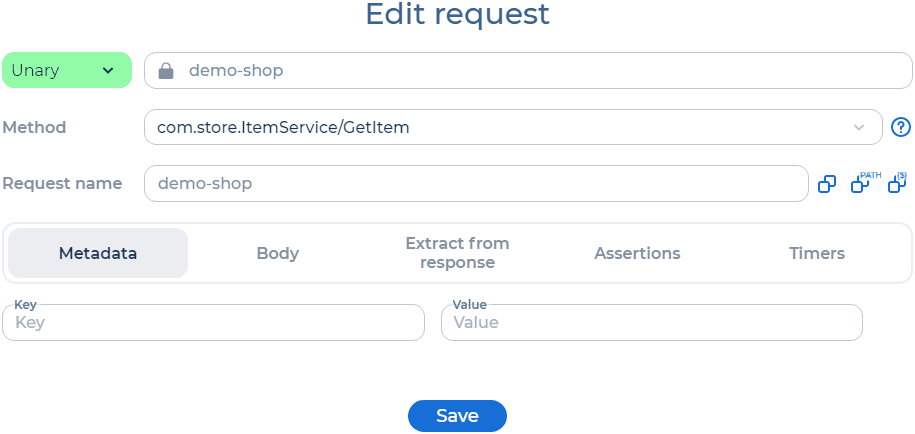
Step 3: Configure gRPC Requests for Testing
After importing the .proto file, configure the gRPC requests that will be used in your performance test:
- Add a gRPC request element to your test workflow.
- Configure the request parameters:
- Enter the target URL for your gRPC server.
- Choose the method to test (e.g., unary call, streaming method).
- Provide request payloads and metadata if required.
Step 4: Design the Performance Test Scenario
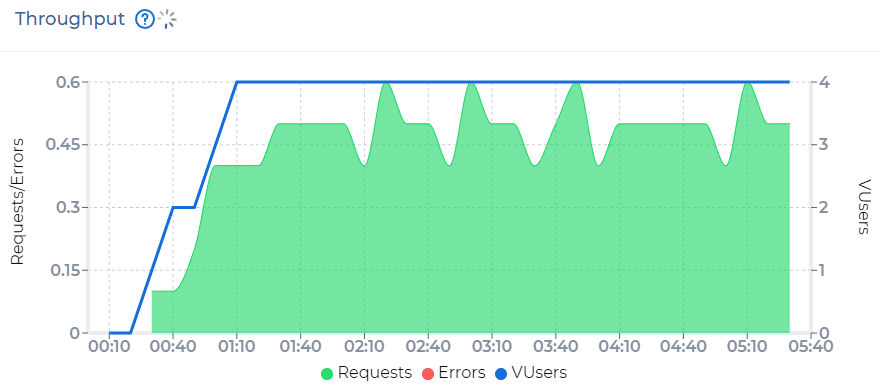
Performance testing focuses on evaluating how your gRPC service handles different loads and conditions. Using the PFLB platform, you can configure scenarios to test:
- Throughput: Simulate multiple concurrent clients making requests to measure queries per second (QPS).
- Latency: Measure response times under various load conditions.
- Resource Utilization: Monitor CPU, memory, and network usage during the test.
Example configuration in PFLB:
- Number of Virtual Users: Set how many clients will simulate requests.
- Request Rate: Define how frequently requests are sent.
- Duration: Specify the length of the test.
Step 5: Run the Performance Test
Once the test scenario is configured, execute the test:
- Click Run Test and monitor the test progress in real-time via the PFLB interface.
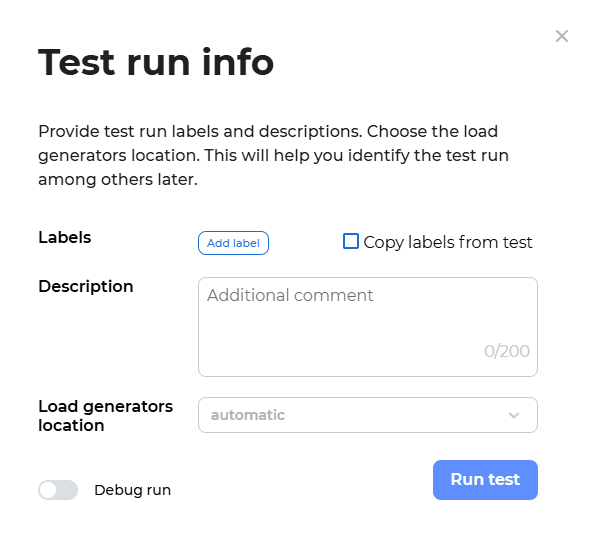
- Use integrated tools like Grafana to track key metrics.
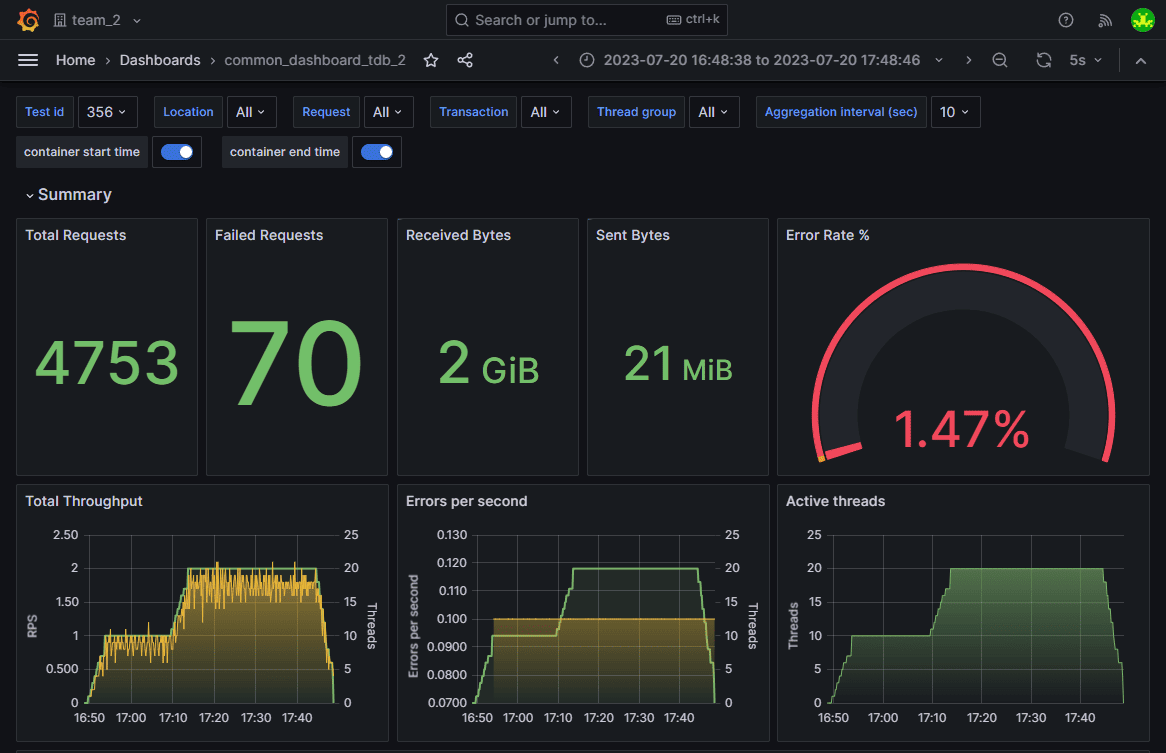
Step 6: Analyze and Optimize
After the test completes, review the detailed reports generated by PFLB. Focus on metrics such as:
- Latency: Identify spikes or trends that indicate bottlenecks.
- Throughput: Ensure the system can handle the desired QPS without degradation.
- Error Rates: Investigate and address failed requests.
Use these insights to optimize your gRPC service, such as:
- Adjusting server configurations for better concurrency.
- Optimizing Protobuf schemas to reduce serialization overhead.
- Refining resource allocation to improve scalability.
Consider PFLB Your Best gRPC Performance Testing Provider
When it comes to ensuring your gRPC services perform at their peak, PFLB stands out as a trusted leader in performance testing. With years of expertise in delivering top-tier load testing solutions, PFLB has helped businesses optimize their APIs, streamline data exchange, and ensure reliability under heavy loads.
Specialization in Performance Testing
PFLB is not just another testing tool; it’s a full-scale solution designed to handle even the most complex performance challenges. With expertise in handling gRPC-specific features like bidirectional streaming and Protocol Buffers, we bring tailored solutions to meet your unique needs.
Cloud-Based Efficiency
Our platform simplifies the testing process by eliminating the need for complex infrastructure. In just minutes, you can upload your .proto file, configure your gRPC requests, and start running meaningful performance tests.
Why Businesses Trust PFLB
- Comprehensive and Scalable Testing: PFLB covers all aspects of gRPC performance, from load to stress testing, with a highly scalable platform to meet businesses of any size.
- Preconfigured Environment: Save time with a fully set-up, distributed testing environment, so you can focus on results instead of configuration.
- AI-Powered Insights: Gain actionable recommendations with AI-driven analytics to optimize your gRPC services faster and smarter.
- Grafana Integration: Monitor real-time performance metrics with Grafana’s powerful visualization tools for clear, data-driven decisions.
- Custom Reporting: Easily share tailored, detailed reports with your team to drive actionable improvements.
- Proven Success: From fintech to healthcare, PFLB delivers measurable results, helping businesses achieve reliability, speed, and growth.
Ready to Experience the PFLB Advantage?
Join the businesses that trust PFLB for their gRPC performance testing needs. With a robust platform, expert solutions, and tools designed for real business benefits, PFLB helps you optimize your APIs for reliability, scalability, and user satisfaction.
Start your free trial today and take your gRPC performance to the next level.