
Introduction to Site Reliability Engineering
Site Reliability Engineering is a modern IT approach designed to ensure that software systems are both highly reliable and scalable. By leveraging data and automation, SRE helps manage the complexity of distributed systems and accelerates software delivery.
A key aspect of SRE is monitoring, which provides real-time insights into both software and hardware systems. This visibility enables teams to quickly address issues, optimize performance, and ultimately improve customer satisfaction.
Through automation and a strong focus on system reliability, SRE transforms traditional IT operations into streamlined, efficient processes. Want to dive deeper? Check out our detailed article “What is SRE.”
Understanding System Health
System health encompasses the overall performance and reliability of a system, ensuring it meets operational and customer demands consistently.
A key part of this is monitoring system health to proactively identify issues before they impact performance. Without proper monitoring, systems are vulnerable to performance degradation, which can lead to downtime or customer dissatisfaction.
System health is assessed through various metrics, including latency, errors, saturation, and monitoring traffic levels. These indicators provide insight into how well a system is functioning and help SRE teams respond to potential problems in real time, ensuring system stability and reliability.
By keeping a close eye on these metrics, SRE teams can maintain the high availability and performance that users expect.
The Four Golden Signals
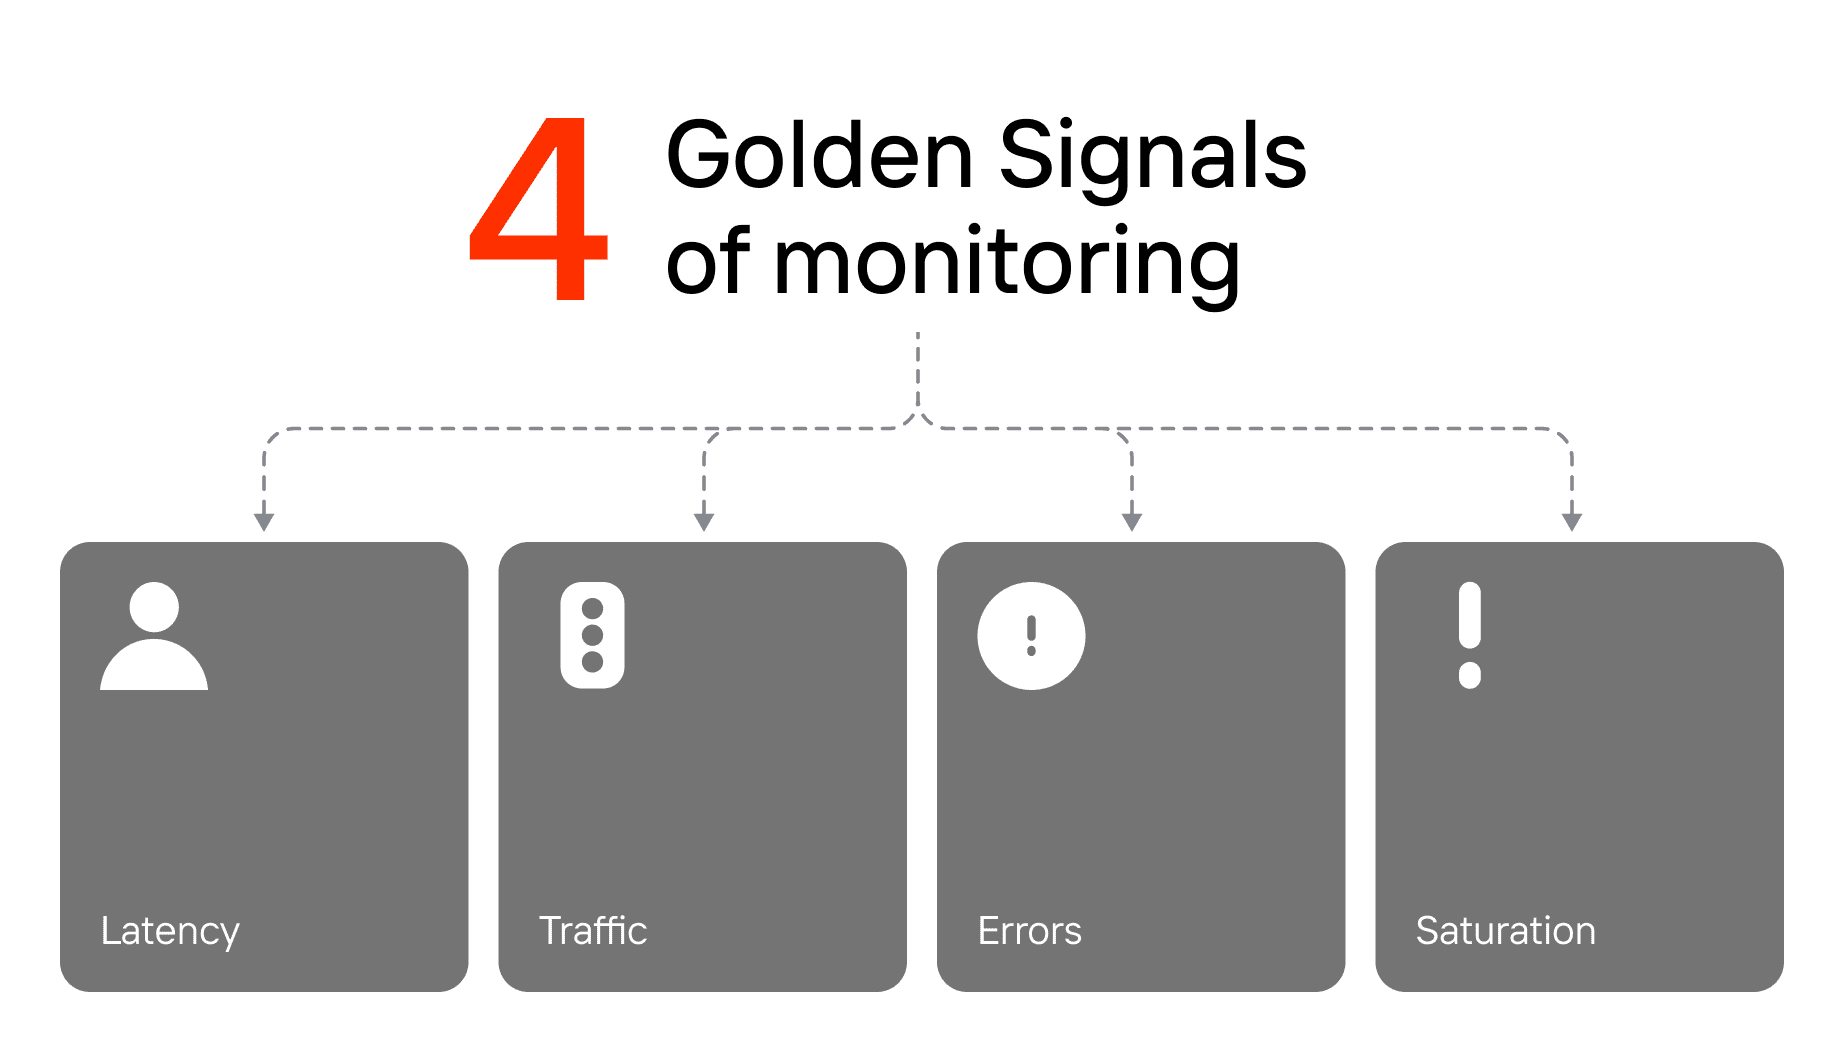
When referring to the Four Golden Signals of monitoring, site reliability engineers typically mean traffic, errors, saturation, and latency – fundamental metrics for assessing the health and performance of any IT system. By focusing on these golden signals, SRE teams gain essential insights into system behavior, enabling them to maintain reliability and efficiency.
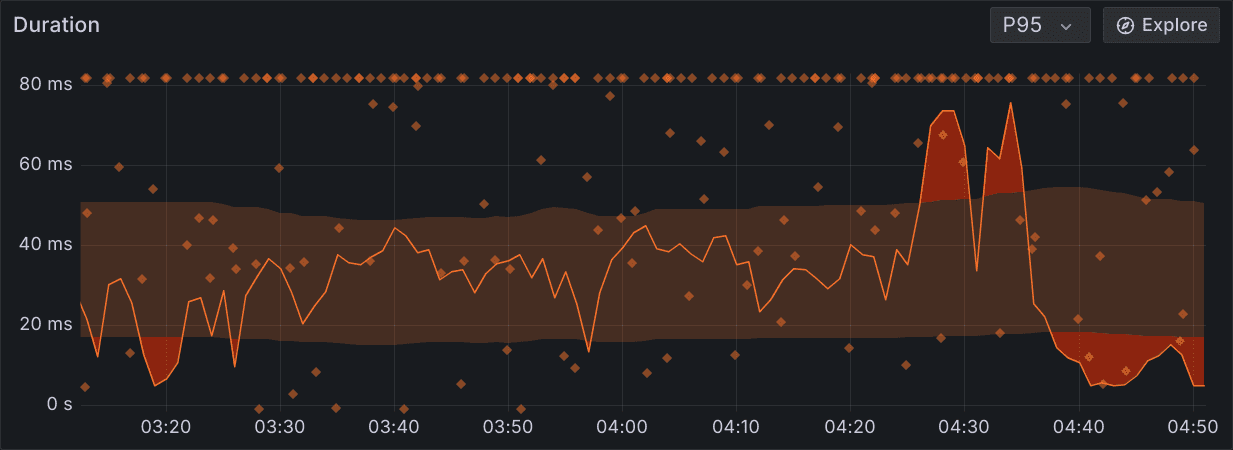
Latency
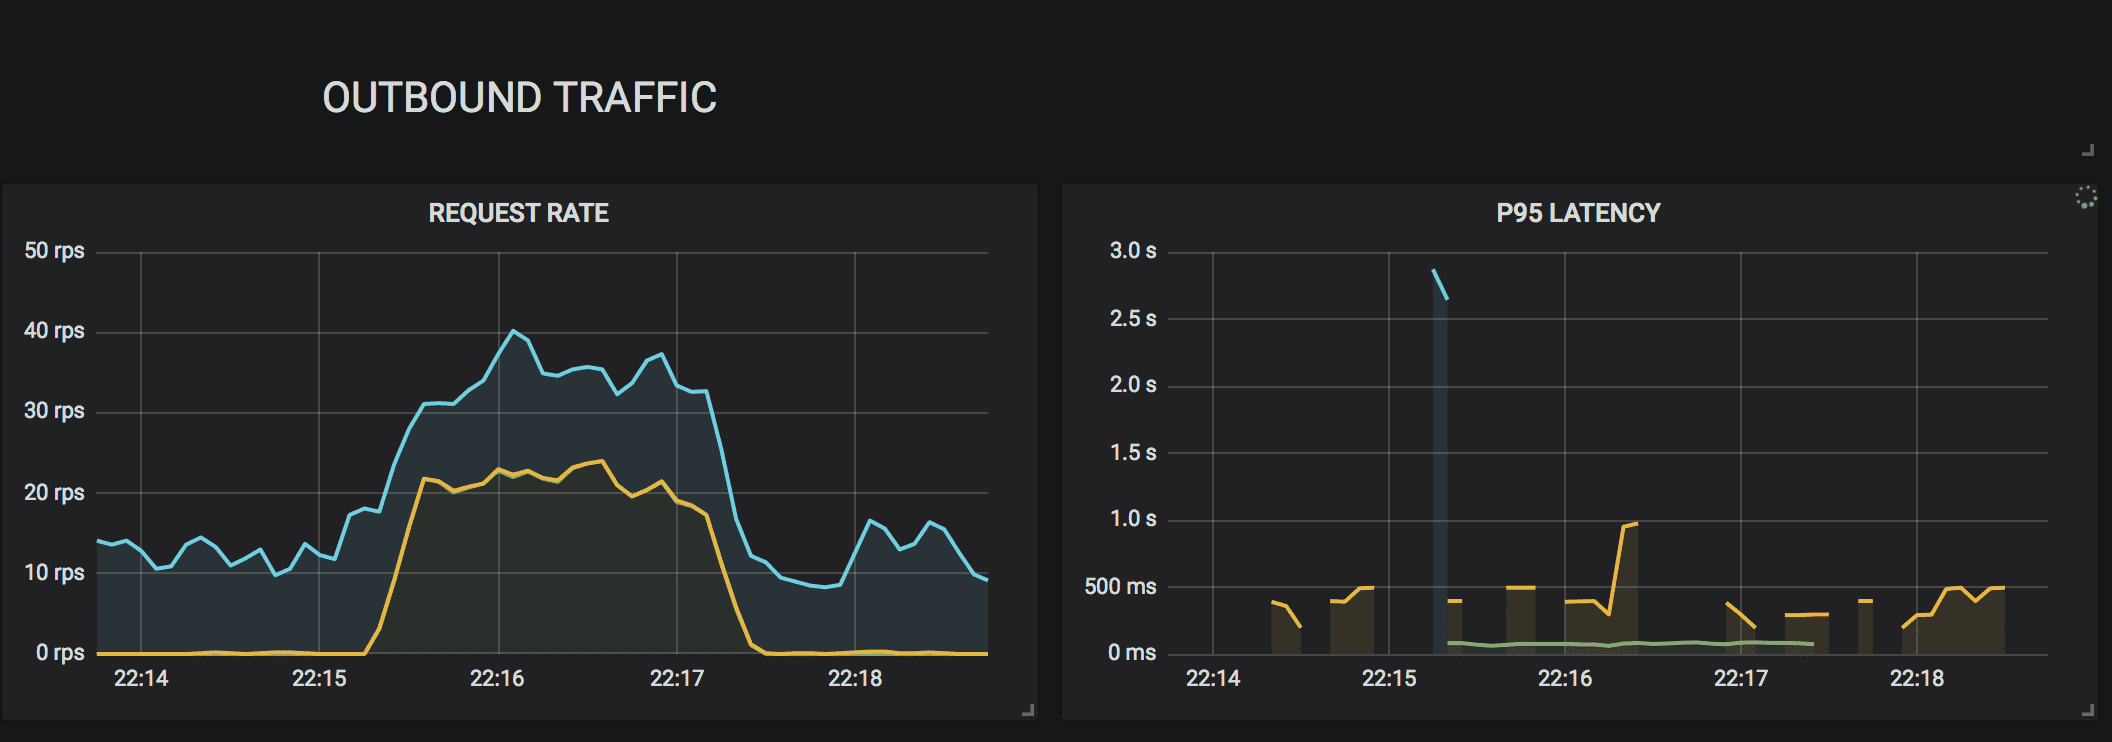
Latency measures the time it takes for a system to respond to a request. It is a key indicator of performance, as high latency can lead to degraded user experiences. Monitoring latency helps SRE teams quickly identify bottlenecks or slowdowns that need to be addressed to ensure optimal performance.
Traffic
Traffic refers to the volume of requests hitting a system. Monitoring traffic levels allows SREs to track how well a system is handling load, ensuring that it scales appropriately to meet demand. Sudden spikes or drops in traffic can indicate potential issues, such as outages or security concerns.
Errors
Errors represent the rate of failed requests. Monitoring errors provides visibility into failures, helping SRE teams pinpoint problems before they escalate. Whether due to system bugs, misconfigurations, or external factors, tracking errors is critical for maintaining reliability.
Saturation
Saturation measures how close a system is to its full capacity. When saturation levels are high, a system is at risk of declining performance or failure. Monitoring saturation helps SRE teams plan for capacity increases and ensure system resilience under heavy loads.
By focusing on these Four Golden Signals, SREs can proactively manage service health, ensuring that infrastructure availability and performance meet the demands of a high-quality application service.
Measuring and Optimizing Golden Signals
Measuring the Four Golden Signals—latency, traffic, errors, and saturation—is crucial for maintaining service health and performance. These metrics provide a clear view of how well your system is functioning and where improvements are needed.
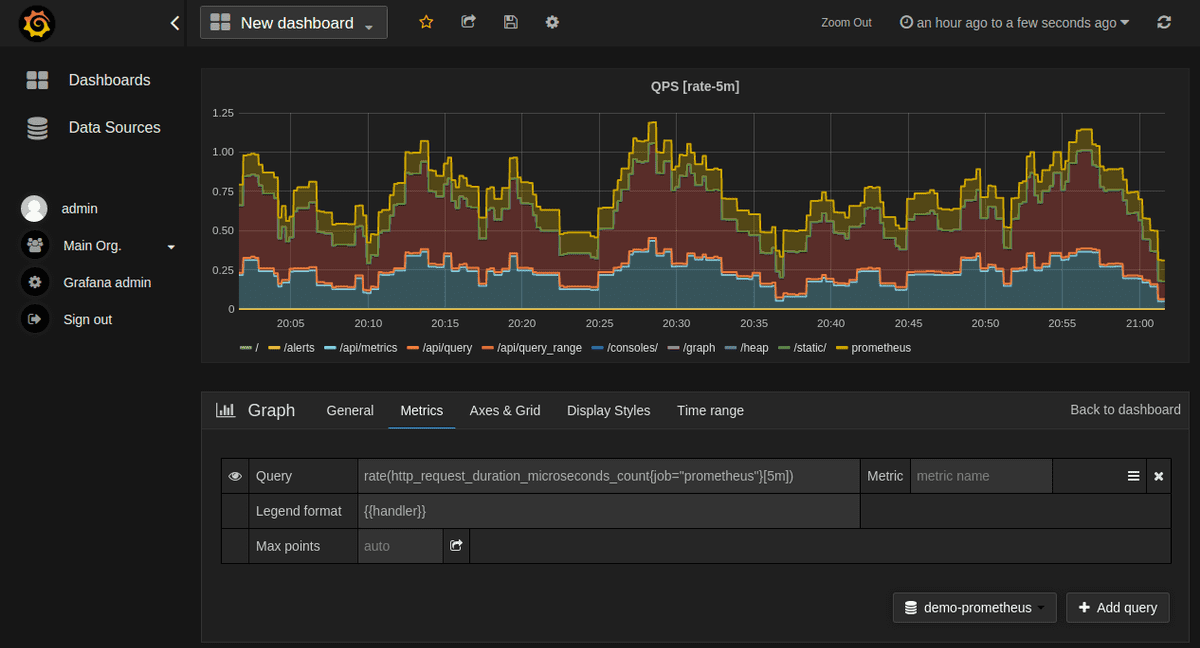
To improve reliability, start by monitoring these golden signals in real time using tools like Prometheus. This lets you quickly identify performance bottlenecks and respond to issues before they escalate. For example, tracking latency helps catch slow response times, monitoring CPU time reveals processing efficiency, while monitoring traffic ensures your system is scaled appropriately for demand.
Optimizing these golden signals can significantly reduce performance degradation and gain a positive user experience. Regularly review your error rates to prevent system failures, and keep an eye on saturation to ensure system resources aren’t overextended.
By focusing on measuring and optimizing the Four Golden Signals, you can proactively manage service performance and deliver a more reliable, efficient service to your users.
Implementing Golden Signals in Observability
In SRE, monitoring system health and performance is crucial. The four golden signals (latency, traffic, errors, and saturation) offer a framework to track essential metrics for system reliability and efficiency. When these signals are effectively implemented into your observability strategy, they give SREs a clear view of how their production systems behave and where potential risks may lie. Additionally, understanding the key responsibilities of site reliability engineers is essential to ensure that monitoring strategies align with broader system management goals. This actionable insight enables quicker resolution of issues and better optimization of system performance.
Observability is not just about monitoring for failures but about providing a comprehensive understanding of your software system. By implementing these key metrics, teams can foresee problems, track trends, and take action before minor issues become major disruptions. This approach also supports scalability, as SREs can evaluate how well their infrastructure adapts to changing loads or growing user bases.
Setting Baselines and Thresholds For System Performance
To get the most out of the Four Golden Signals, it’s essential to set clear baselines and thresholds. Baselines reflect normal system behavior under typical conditions. For example, you might establish that your average request latency is 100 milliseconds during normal usage. Once you know what’s typical, you can spot when something falls outside the norm.
Thresholds act as your alert system. They set the limits for what is considered acceptable performance before taking action. For instance, if your baseline latency is 100 milliseconds, you might set a threshold of 300 milliseconds, beyond which alerts are triggered.
The same approach applies to other metrics like traffic, errors, and critical resource usage thresholds, which are essentially an early warning system for potential issues.

It’s crucial to periodically review and adjust these baselines and thresholds. As systems evolve, what was considered acceptable performance at one point may no longer be sufficient.
Teams should regularly revisit and calibrate these metrics to keep pace with growth, demand, or architectural changes. This ensures that alerts remain meaningful and that teams can focus on the most critical areas of system health.
Choosing the Right Tools and Techniques
Once you’ve established the metrics to monitor and the baselines to compare them against, it’s time to choose the right tools. The selection of tools depends largely on your system architecture and the depth of insights you need.
One powerful option is PFLB, a platform for performance and load testing service. PFLB enables SREs to simulate real-world conditions to test how their system performs under varying traffic loads and stress levels. It provides insights into all Four Golden Signals (latency, traffic, errors, and saturation) by running high-volume tests and collecting detailed metrics. This allows teams to analyze system behavior, assess scalability, and pinpoint performance bottlenecks in real time.
Prometheus is another widely used tool for collecting time-series data and generating real-time alerts based on user-defined thresholds. Prometheus is especially effective for complex systems, offering integration with popular tools like Grafana, which can visualize performance trends and anomalies.
For deeper insights and visual analysis, Grafana, Datadog, and New Relic provide dashboards that help you track trends across various metrics, including network bandwidth usage, latency, and saturation. They allow SREs to monitor multiple signals together, which is crucial for understanding how different factors influence system behavior.
For organizations using microservices or containers, tools like Jaeger and Istio provide distributed tracing and effective monitoring of service-to-service traffic, helping teams isolate performance issues in complex environments.
By including PFLB in your toolkit, you can simulate stress tests to ensure your system holds up against all the key metrics, from user traffic spikes to latency and resource utilization. For organizations working with microservices, understanding performance testing of microservices becomes even more critical. The combination of PFLB and other observability tools provides a well-rounded, proactive approach to reliability and performance testing, ensuring your systems remain robust and reliable.

Best Practices for SRE Metrics
Implementing and optimizing the Four Golden Signals requires a thoughtful approach, and following best practices can help teams maintain system reliability and performance.
Below are key strategies for effectively managing SRE metrics:
- Monitor All Four Golden Signals Together: Each signal tells part of the story, but it’s the combination that provides a complete view of system health. A sudden increase in traffic might cause saturation, leading to higher error rates and latency spikes. By observing these signals in tandem, SREs can detect cascading issues and tackle them early.
- Dynamic Baselines and Thresholds: Instead of using static thresholds that may become outdated, consider leveraging dynamic baselines. Machine learning-based monitoring tools can adjust thresholds based on historical performance, reducing false alarms and improving alert accuracy. As your system evolves, dynamic baselines adapt, ensuring you’re alerted to real problems and not just normal fluctuations.
- Use Alerts Intelligently: Alert fatigue is a real problem for SRE teams. When every minor deviation triggers an alert, critical issues may be missed. Tune your alerts to trigger based on sustained deviations rather than momentary spikes. This keeps the focus on actionable problems and reduces noise.
- Automate Responses Where Possible: Automating routine responses to performance issues can significantly improve efficiency. For example, automatic scaling when traffic spikes or restarting services when saturation is detected can keep your system running smoothly without human intervention.
- Capacity Planning and Performance Testing:
Capacity planning is essential for accurately predicting the four golden signals during critical changes like software updates, infrastructure upgrades, migrations, or anticipated traffic surges. A strong capacity plan ensures that your system is ready to handle these events without experiencing performance degradation. Regular performance testing is crucial to keep your capacity plan alive and relevant, as it allows you to anticipate how your system will react to changing loads and conditions. - Review and Optimize Continuously: Continuous improvement is key. Regularly reviewing your monitoring strategy, baselines, and thresholds ensures your system is prepared for growth and changing demands. Post-incident analysis is an excellent opportunity to refine your alerts and understand what went wrong so that future issues are caught even sooner.
- Leverage Distributed Tracing for Microservices: For systems that rely on microservices, understanding how HTTP requests flow between services is essential. Distributed tracing tools like Jaeger and Zipkin help you follow the life cycle of HTTP requests and see how different services impact overall latency and errors. This is particularly helpful for identifying bottlenecks in a complex distributed system.
By applying these practices, teams can create a more resilient and efficient monitoring strategy, helping to reduce downtime, mitigate risks, and enhance the user experience.
Conclusion
The four golden signals offer a clear and powerful framework for understanding system health and performance. By establishing strong baselines and thresholds, choosing the right monitoring tools, and following best practices, SREs can ensure their distributed system remains reliable, scalable, and efficient.
Monitoring isn’t a one-time setup but a continuously evolving process that requires regular fine-tuning. As systems grow and change, dynamic baselines, automation, and intelligent alerting become even more critical to maintaining smooth operations.
Organizations that effectively implement these strategies can proactively manage system performance, anticipate challenges, and reduce the risk of downtime, all while providing users with the seamless, high-quality experience they expect.