Programming with Grafana and InfluxDB for Load Testing Engineers
Part of the service that performance testing companies offer to their customers is a report that summarizes the results of the tests. Professional load and performance testing engineers know that writing a report takes around a week. It also takes dozens of pages, but sometimes only one person from the customer’s side reads them, or, in the worst-case scenario, no one does. Reports are costly, though: customers have to pay for engineers’ time, and the cost is, of course, included in the overall performance testing service price.
Test reports automation is the way to optimize testing costs and make performance testing more affordable. By cutting the cost, you will also be able to attract smaller businesses as customers. Good news: test reports automation is possible with the help of such popular tools as Grafana and InfluxDB, that all testers are already familiar with, to say the least.
In this article, we start with a major topic, and then, in the following parts, we’ll go deeper into super-hardcore stuff.
Monitoring: Preparation and Approach to Development
If you start preparing for monitoring from scratch and gather the data yourself, your main focus should be on how to keep your report simple. Nobody wants a report that is incomprehensible. Think of the graphs you will need and choose the data for these graphs. If, on the contrary, you have your data layout already prepared for you, and you are using, say, Gatling, that stores the necessary metrics in the tables, at first it will look like you need to design some very complex report for this kind of data.
But it is the wrong way. InfluxDB makes it easy to change the data design in order to make a simple report and save you time and money.
Load Testing Tools and InfluxDB
Why choose InfluxDB? Most of the tools used by load testing companies support InfluxDB.
For instance, such load testing tools as Gatling, Yandex.Tank, LoadRunner Enterprise/Performance Center, and Apache JMeter, all do. All of them store metrics in InfluxDB. When selecting the right tool for your needs, a comprehensive performance testing tools comparisson can help you evaluate the strengths and capabilities of different solutions beyond just their InfluxDB compatibility.
This table shows which protocols are used to send data from a particular load testing tool to the storage. All the tools use InfluxDB 1.8, while JMeter can also store metrics in InfluxDB 2.0.
Tool | Protocol | Storage |
|---|---|---|
Gatling | Graphite | InfluxDB 1.8 |
LoadRunner Enterprise | InfluxLine | InfluxDB 1.8 |
Apache.JMeter | Graphite InfluxLine InfluxLine 2.0 | InfluxDB 1.8 InfluxDB 1.8 InfluxDB 2.0 |
Yandex.Tank | InfluxLine | InfluxDB 1.8 |
InfluxDB has better support with JMeter. Other tools only use InfluxDB 1.8. It is crucial for a load tester to know how to use InfluxDB and store data there. To store the data, two protocols may be used: a text protocol InfluxLine and Graphite. Graphite is a protocol over tcp or udp, but it is binary and more compact. It is also important to be able to extract queries. There are 2 languages: InfluxQL and Flux. Flux appeared in the support of InfluxDB 2.0. Using it, you can extract, process and update data.
Grafana, too, is a must-have tool for a load tester. InfluxDB doesn’t have the most native Grafana support yet, so there may be some difficulties in using it. That is why we chose the following better-supported versions.
Versions used:
- InfluxDB 1.8 (not 2.0);
- Grafana 7.0
The syntax used:
- InfluxQL (not Flux)
Developer’s Environment
Before you do anything, you need to reinvent your developer’s environment. The thing is, a good Grafana dashboard has a version, and the version of the environment and plugins is also specified. Looking at all Grafana dashboards at www.grafana.com, you can’t really get how they’ve released so many versions and what works with which version and which components.
Turns out that an excellent Grafana dashboard has a repository and a bug tracker. The repository has a history of commits. Our dashboards turned out to be far from perfect, since we did not have the appropriate developer environment, and so we came to the conclusion that everything needs to be stored in git: docker start parameters, configs, plugins, and dashboards.
To store your environment parameters in git, you need to write a batch file that contains all the key points, such as which version of InfluxDB you use or which ports you open. Make it an .sh file and save it.
It will look like this:
docker network create test
docker pull influxdb:1.8
DEV=$(pwd)

docker run --name=influxdb
  --network=test -p 8086:8086 -p 2003:2003 -p 2004:2004
  -v $DEV/influxdb.conf:/etc/influxdb/influxdb.conf:ro
  -v $DEV/var/lib/influxdb:/var/lib/influxdb
influxdb:1.8 -config /etc/influxdb/influxdb.conf
The same can be done for Grafana. Store Grafana configuration files, dashboards and a directory with plugins in git, however, miscellaneous data, such as databases, logs, etc, should be stored in .gitignore:
docker pull grafana/grafana
ID=$(id -u)

docker run --name=grafana
--network=test --user $ID -p 3000:3000
-v $DEV/grafana.ini:/etc/grafana/grafana.ini
-v $DEV/plugins:/var/lib/grafana/plugins
-v $DEV/provisioning:/etc/grafana/provisioning
-v $DEV/var/lib/grafana:/var/lib/grafana
-v $DEV/usr/share/grafana:/var/usr/share/grafana
-v $DEV/var/log/grafana:/var/log/grafana
grafana/grafana
In the start parameters of the docker container, it is possible to load plugins when starting Grafana, but we do not advise doing so, as they download with errors:
docker run --name=grafana

--network=test --user $ID -p 3000:3000
-v $DEV/grafana.ini:/etc/grafana/grafana.ini
-e "GF_INSTALL_PLUGINS=yesoreyeram-boomtable-panel"
It’s easier to just download the plugins directory, and then use the desired version from the catalog. Saves you time, really.
Most of the dev takes place in sqlite, which is a Grafana database that is put into a .gitignore file.
[database]
# Either "mysql", "postgres" or "sqlite3", it's your choice
type = sqlite3
# For "sqlite3" only, path relative to data_path setting
path = grafana.db
There is a database section in the grafana.ini configuration file, and default types for it are sqlite3 and grafana.db. The only parameter that we change is versions_to_keep. Consider changing it to 200 instead of 20, so that more history could be saved in the database.
[dashboards]
# Number dashboard versions to keep. Default:20
versions_to_keep = 200
After you have developed a dashboard and want to download it, use the provisioning directory in grafana: etc/grafana/provisioning. It is inside the docker container, and you can mount an external directory there. The content of the directory can be versioned, and files can be stored there. There is only a small directory in git, while the Grafana environment is in docker, and you do not version it.
In version 6, provisioning in the file named provisioning.json has an option AllowUiUpdates, which allows you to download a file, and then, if the developer has edited it, to save all the changes in Grafana DB, so you will have your original version from the disk, and all sorts of updates will be kept in Grafana DB.
We do not recommend using AllowUiUpdatesForce. We’ve tried to and we’ve tested it, but errors just keep happening. Something keeps blinking on the disk, and Grafana thinks that the file on the disk has been updated and says that you have the latest version on your disk, although in fact nothing has changed. Beware of losing data.
So this is the right way:
apiVersion: 1

providers:
- name: 'GIT boards'
  orgId: 1
  folder: 'GIT'
  type: file
  allowUiUpdates: false
  updateIntervalSeconds: 0
  options:
path: /etc/grafana/provisioning/dashboards/json
And this is wrong:
allowUiUpdates: trueThis is what the development process should look like: you update everything in the Grafana interface, and when you need to upload a version, you use a script, and then you have a new version in git again.
When developing, save your dashboard in Grafana interface (click Save)
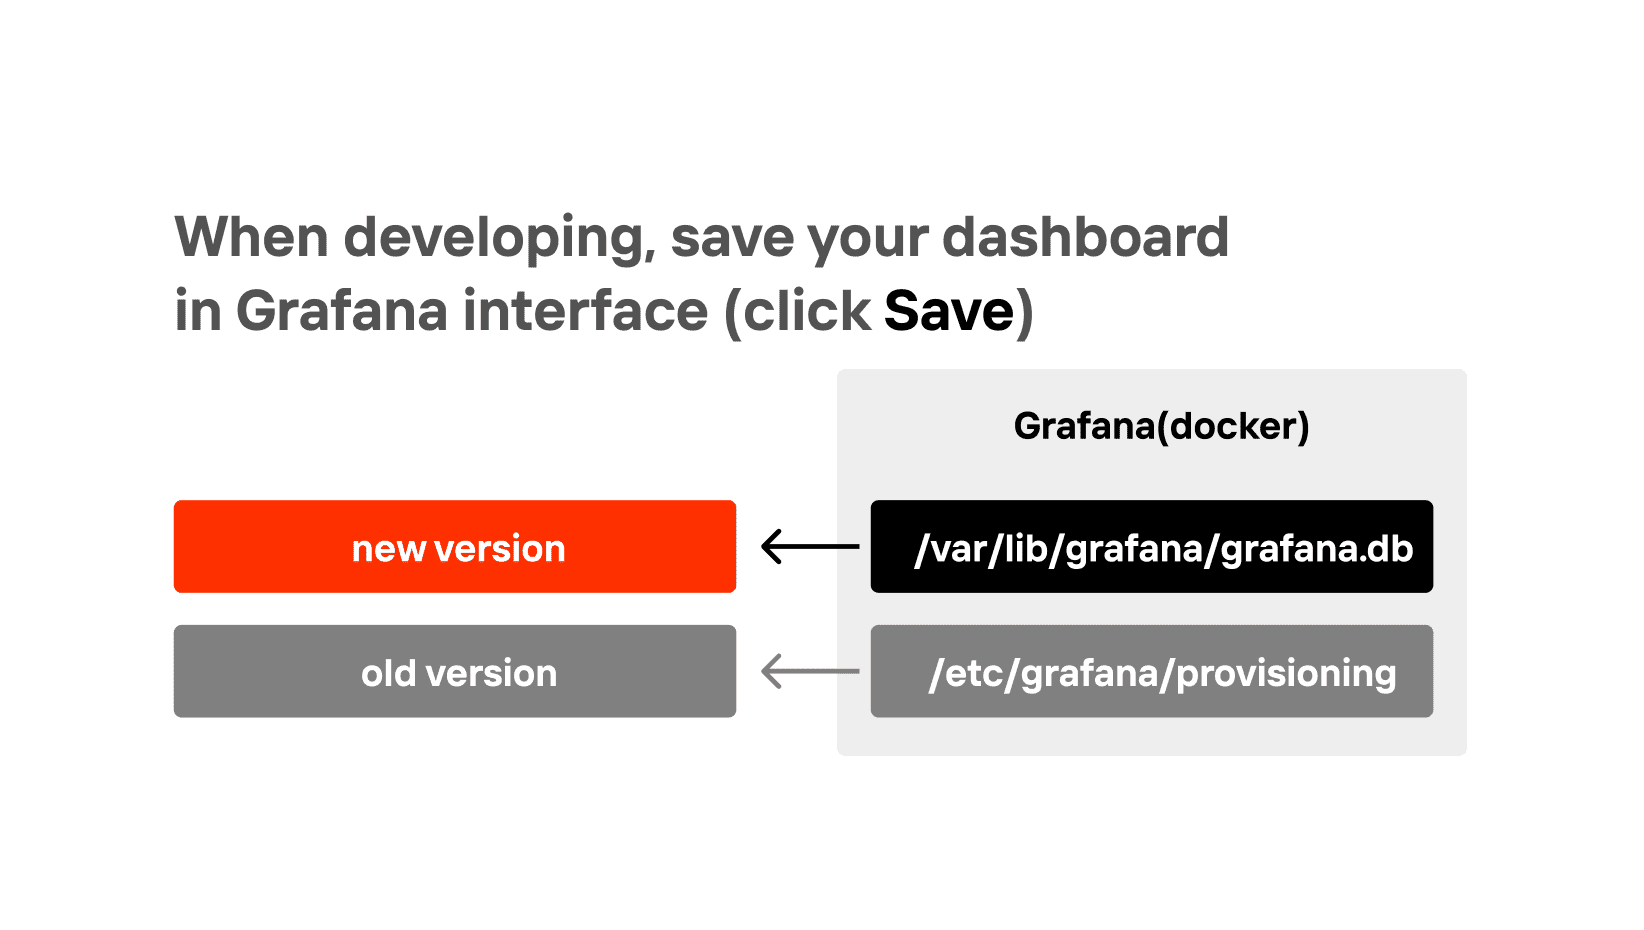
But remember to download the dashboard from the DB into a file and save it in GIT once in a while. If you’re using a MacBookPro, you can automate this process. This model has a customizable panel at the top, and you can add a button to download and git your dashboard in one click. To do so, use Grafana API. You can create an API key that will allow you to do it simply by CURL and automate the download of dashboards with the IDs you need.
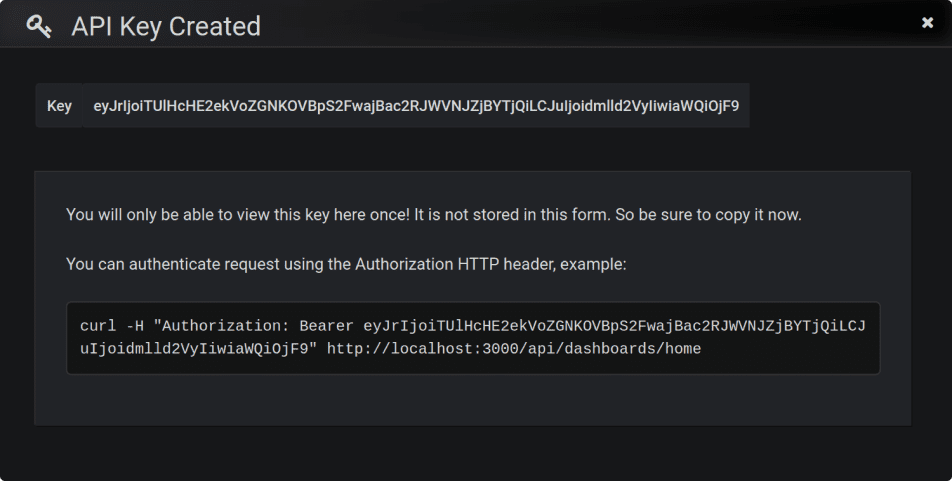
Once you have a key and a Grafana ID, and you can save the dashboard using the API dashboard suite. First, save the $UID.json file using CURL and HTTP API.
#!/bin/sh -x

KEY="eyJrIjoiTUlHcHE2ekVoZGNKOVBpS2

VyIiwiaWQiOjF9"
UID="gatlingTrend"

curl -H "Authorization: Bearer $KEY"
  "http://localhost:3000/api/dashboards/uid/$UID"
  -o "/tmp/$UID.json"
Second, extract the contents of the dashboard from the JSON file using JQto get only one dashboard from the list, use JQ utility, that works with json and is able to extract a smaller json from a bigger one.
#!/bin/sh -x

DIR="./provisioning/dashboards/json/"
UID="gatlingTrend"

jq .dashboard "/tmp/$UID.json" > "$DIR/$UID.json"
Third, since it will not be possible to upload two dashboards with the same name from provision and the database to Grafana at once, you need to change your dashboard’s name by adding the suffix GIT to it.
#!/bin/sh -x

DIR="./provisioning/dashboards/json/"
UID="gatlingTrend"
TITLE=`jq -r '.title' "$FOLDER/$UID.json"`
tmpFile=$(mktemp)
jq --arg a "${TITLE} (GIT)" '.title=$a' $DIR/$UID.json>
  "$tmpFile"
mv "$tmpFile" "$FOLDER/$UID.json"
Now, add the GIT suffix to the board UID. It can also be done using JQ with simple scripts.
#!/bin/sh -x

DIR="./provisioning/dashboards/json/"
UID="gatlingTrend"

tmpFile=$(mktemp)
jq --arg a "${UID}_GIT" '.uid=$a' $DIR/$UID.json>
"$tmpFile"
mv "$tmpFile" "$FOLDER/$UID.json">
Finally, save the JSON file in GIT and put the default message “update gatlingTrend” at the end.
#!/bin/sh -x

FOLDER="$DEV/provisioning/dashboards/json/"
UID="gatlingTrend"

git add "$FOLDER/$UID.json"
git commit -m "Update $UID"
And just like that, you’re done with the preparation of your environment. Here is the code altogether, once again:
#!/bin/sh -x

# API-KEY Grafana, need change
KEY="eyJrIjoiR3dsbXA0Szd1dEtudVNOdmF5Y

nM0dDlDeXN1bW9nY3UiLCJuIjoiVmlld2V

yIiwiaWQiOjF9"
# Grafana Dashboard UID, need change
UID="gatlingTrend"
DIR="./provisioning/dashboards/json/"

tmpFile=$(mktemp)
curl -H "Authorization: Bearer $KEY"
"http://localhost:3000/api/dashboards/uid/$UID"
-o "$tmp"
jq .dashboard "$tmpFile" > "$DIR/$UID.json"

TITLE=`jq -r '.title' "$DIR/$UID.json"`
jq --arg a "${TITLE} (GIT)" '.title = $a' "$DIR/$UID.json" > "$tmpFile"
mv "$tmpFile" "$DIR/$UID.json"
jq --arg a "${UID}_GIT" '.uid = $a' "$DIR/$UID.json" > "$tmpFile"
mv "$tmpFile" "$DIR/$UID.json"

git add "$DIR/$UID.json"
git commit -m "Update $UID"
Don’t forget to save this page and our blog to favourites: in Part 2, we will take a closer look at how to create multiple DBs to prevent Grafana from slowing the system down, how to filter tags in InfluxDB, how to work with complicated tables in Grafana. You can also check out PFLB’s API load testing tool.