Programming with Grafana and InfluxDB for Load Testing Engineers
In Part 1 of this tutorial, we had a close look on how to update your load testing environment to make load testing results automation possible. Instead of preparing your load testing report manually for days, with the environment discussed above, your data structure will depend on you, not you on your data structure.
In this part, let’s tackle a problem that engineers in every load testing company complain about, — namely, how Grafana slows down the system, — and several other quick fixes to your Grafana dashboards.
Multiple Databases and Data Sources with InfluxDB
Hopefully, by now you have prepared your load testing environment. The next lifehack will save you from all the negative feedback associated with InfluxDB. You can often hear that Grafana gets really slow when processing intensive workloads that consume significant CPU time, but the antidote does exist. Create multiple databases, and it will do the trick.
There are two editions in InfluxDB: open source, which is simple and free, without a cluster, and enterprise — fast and smart. In this article, we only work with open source. In open source, it is convenient to use cluster emulation with several servers, that is, to do “scaling” of InfluxDB. Since InfluxDB does not work well with huge databases, non-unique tags and long strings, we can fix huge databases by using several databases instead of a large one: you can call it “sharding”. Imagine you have two teams: a client bank for individuals and one for legal entities, and they store all the metrics to one InfluxDB database. Now, this is a mistake.
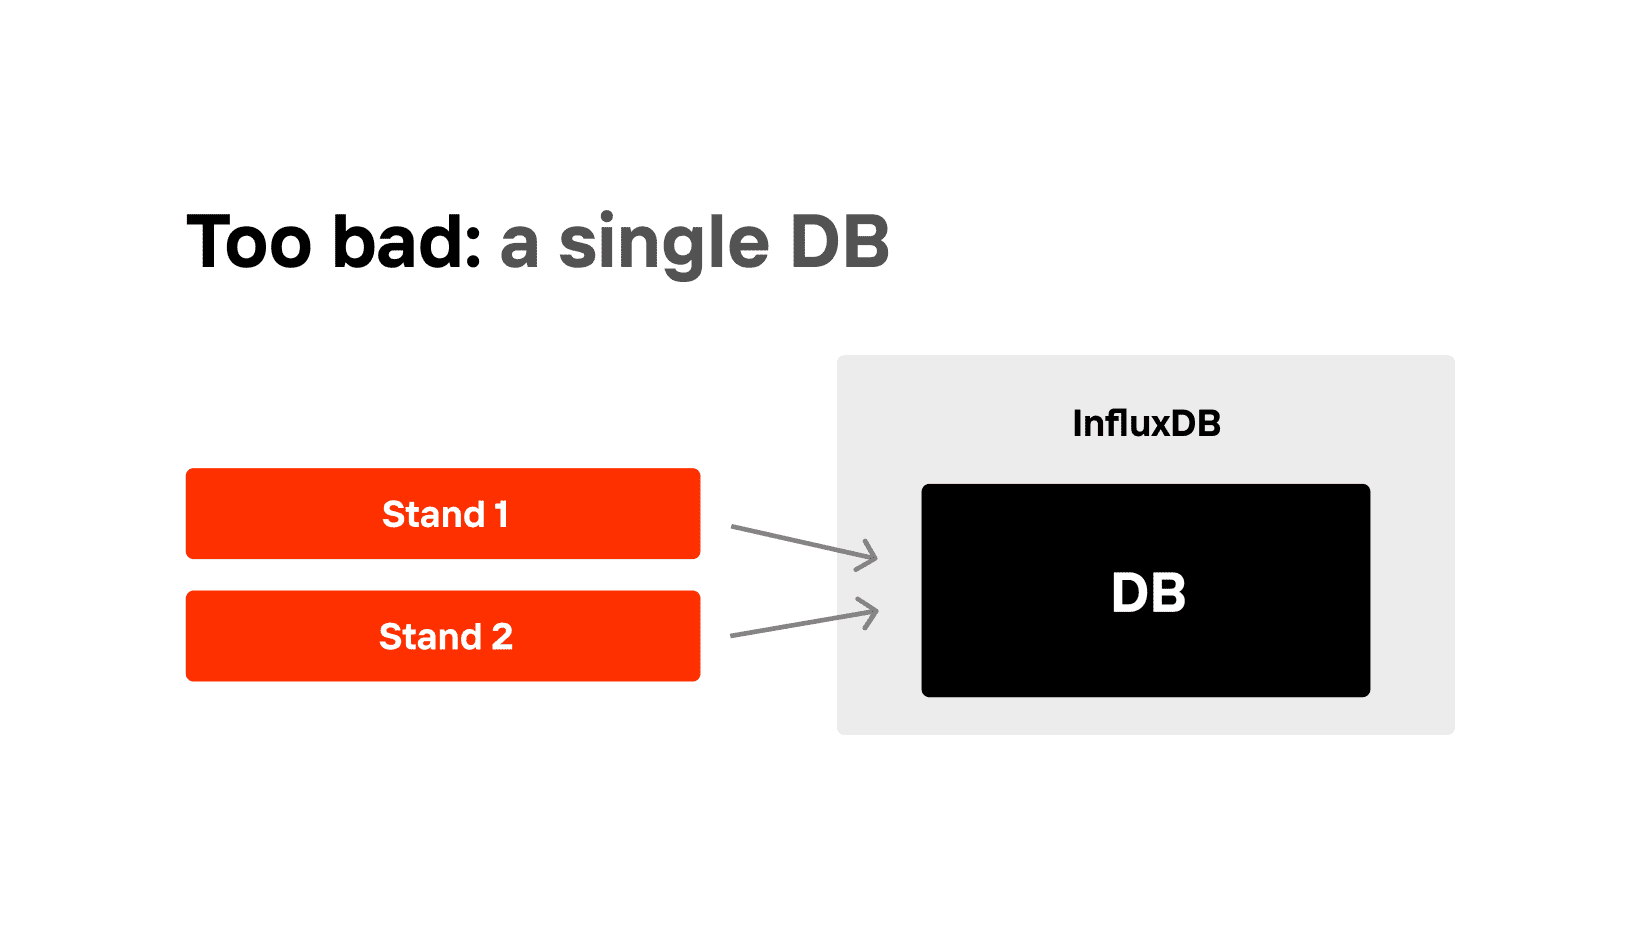
Make it one server, but two different DBs. It should be easy: Gatling and JMeter work in the same way everywhere.
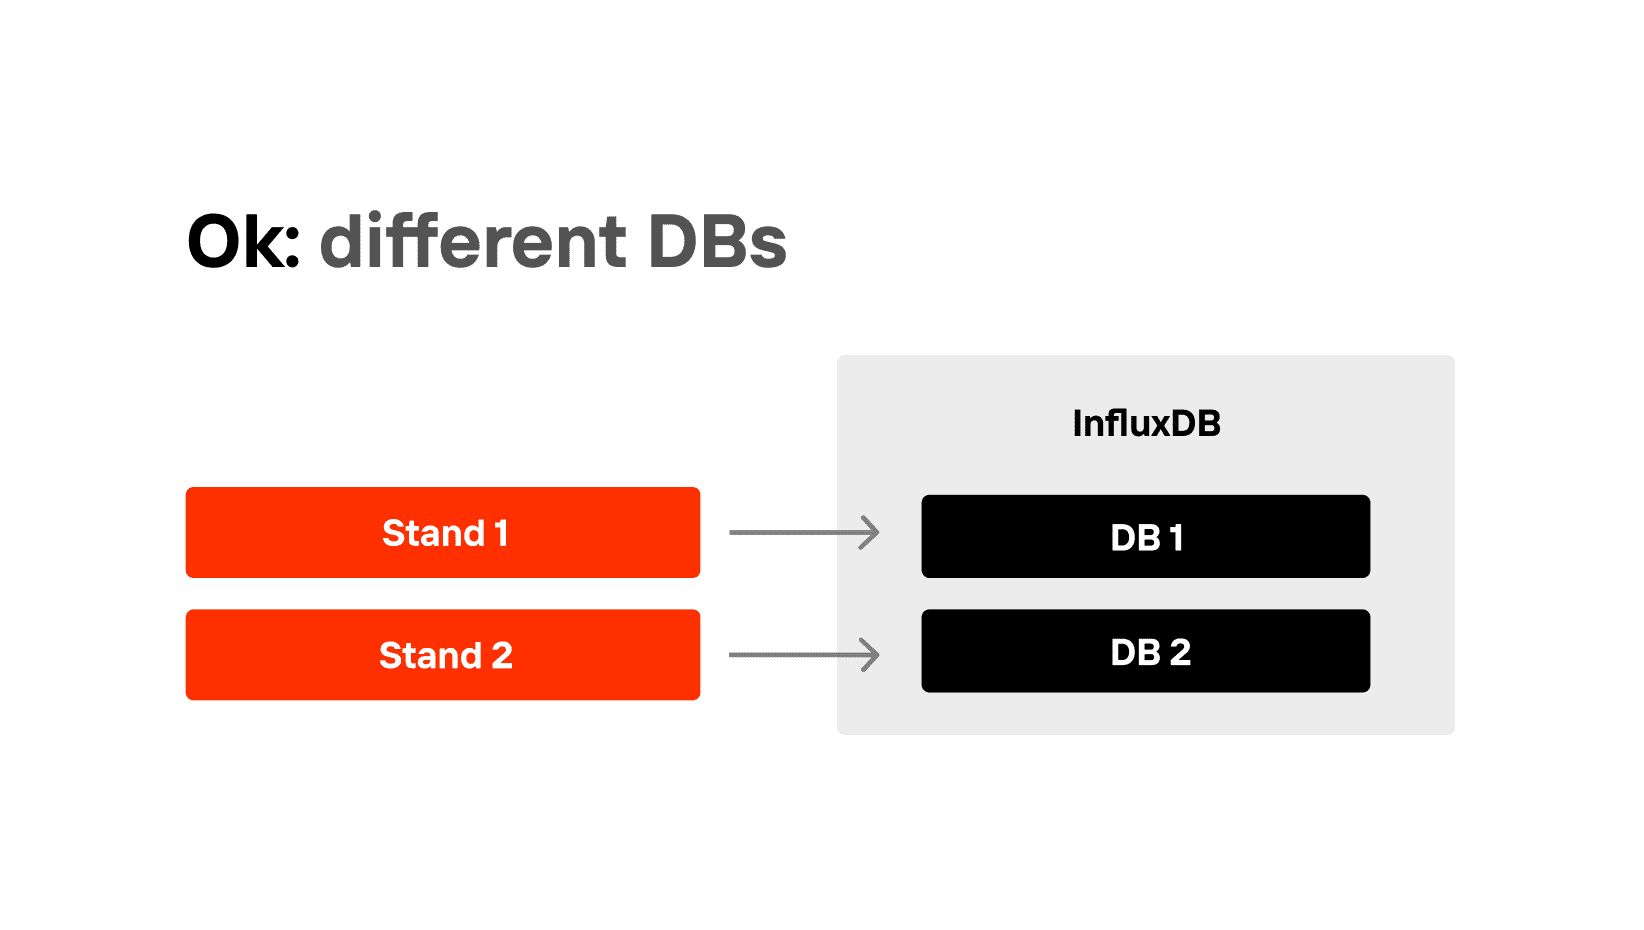
In general, even if they store data in two different databases on two different servers, it is absolutely fine, too. But Grafana dashboards need to be able to switch between data sources from InfluxDB. All you need is to create several data sources in Grafana, for example, Gatling_team 1, Gatling_team 2, etc., and make switches between them.
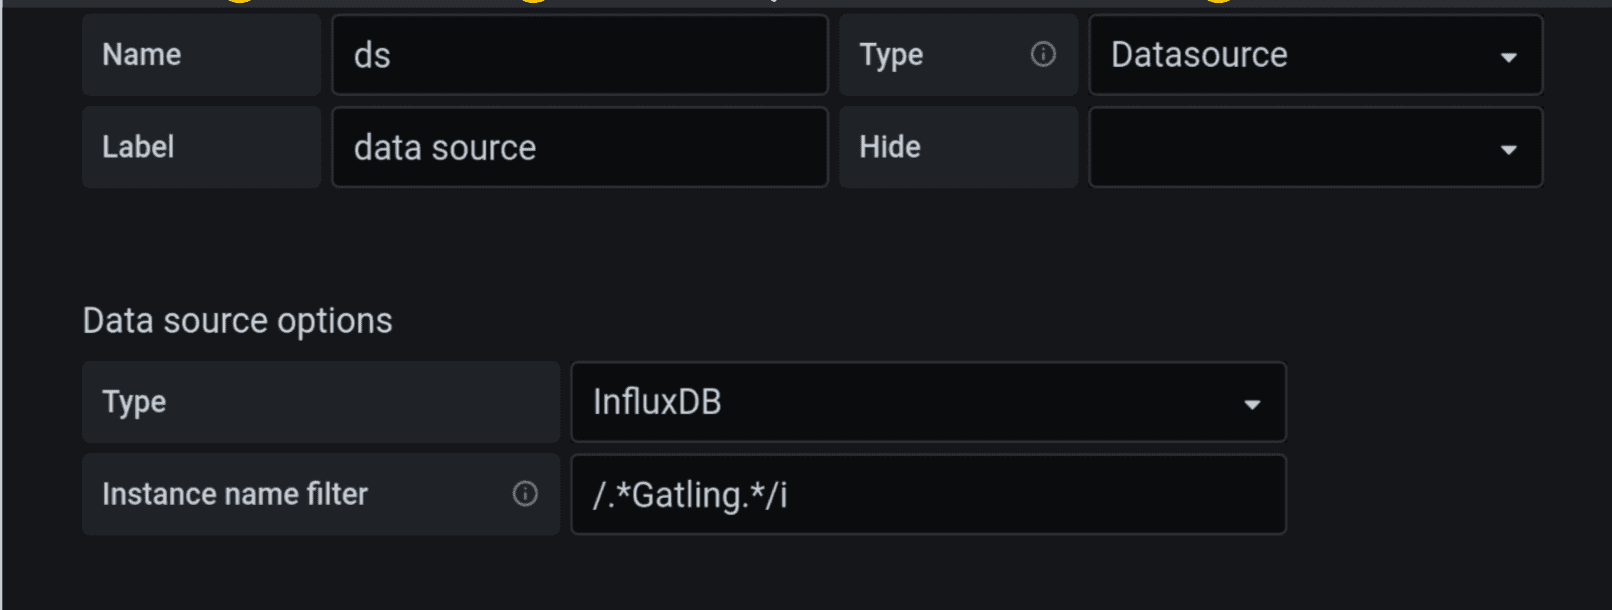
We highly recommended to start developing a Grafana dashboard by creating a variable datasource (ds). Make its type “Datasource”, as in the upper right corner of the screenshot, and add data source options type — InfluxDB, that is, if you are working with it. If you need to filter out data from Gatling or some other load testing tool from the list of all your data sources, just use regulars, such as /.*gatling.*/i or /.*telegraf.*/i.
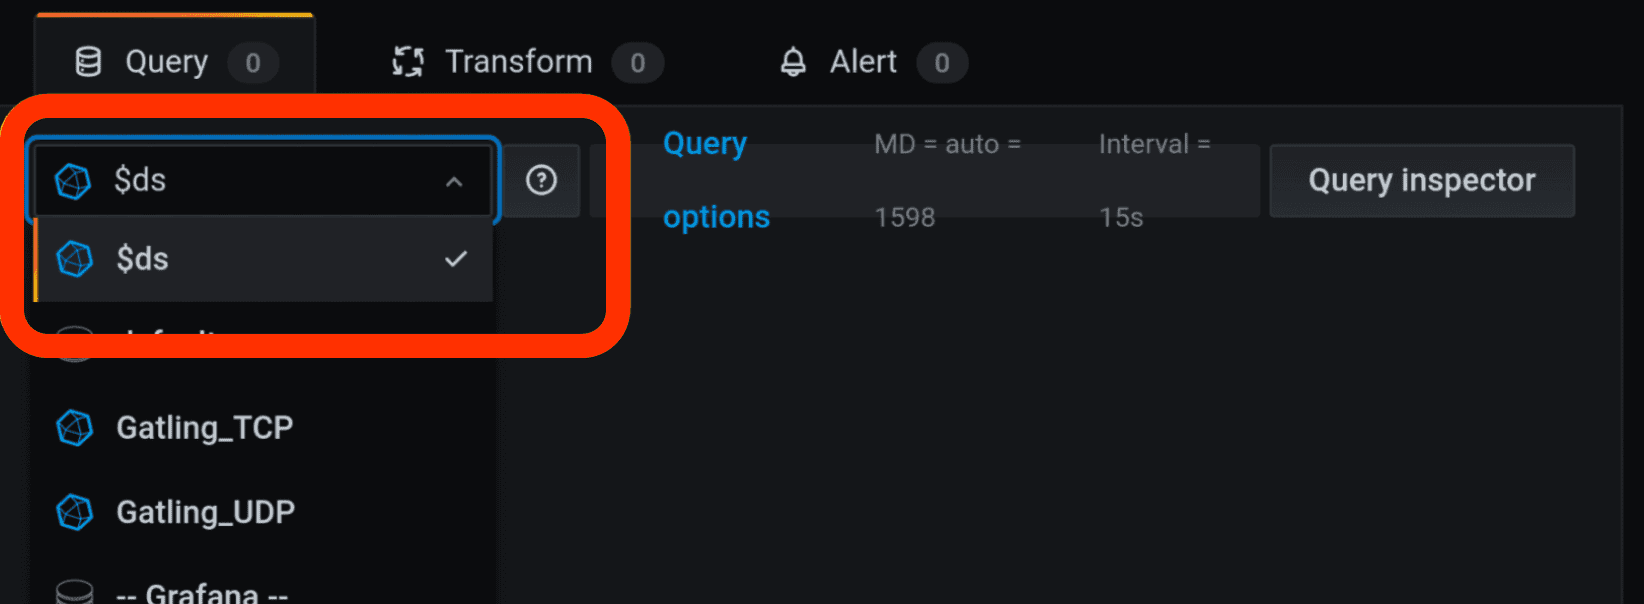
Put this data source, i.e. the $ds variable, into all queries, selections, and everywhere you use it. All you need to do is to replace a particular data source with a variable $ds. It will also save you from facing an annoying error that happens when you use someone else’s Grafana dashboard, and the message “data source not found” pops up.
How to Configure Data Retention/expiry Policy
Another point that allows you to reduce the size of the database is to add an additional retention policy, which will no longer be infinite. Set it up for 90 days, for instance. You will have to deal separately with those metrics that you need infinitely, though.
The choice of 90 days is optional, but quite popular with engineers providing load testing services. Another lifehack: if the name of your retention policy reflects its duration, it’s going to be easier to navigate the policies, if you have several.
To make your new retention policy default, you can use this code:
CREATE RETENTION POLICY "90d"

ON "database_name"

DURATION 90d REPLICATION 1

SHARD DURATION 1d

DEFAULT
Fill in your new retention policy with data from autogen, if there is any. Don’t forget that you need to do so with data from all your tables, for instance from Gatling, from gatling.users, anything you have, really. Use simple queries: select *, group by *. No need to worry: you can’t lose data this way, you’ve just optimized your storage policy.
SELECT *
INTO "90d"."gatling"
FROM  "autogen"."gatling"
WHERE time >= now() — 90d
GROUP BY *
So by now you will have two storage policies — eternal (autogen with duration 0), and the one for 90 days. To be able to choose between them, we will need to create another variable in Grafana, our step 2 after having created the dashboard. You can always choose autogen as a constant option, or you can use a query SHOW RETENTION POLICY and filter it to be not equal to the old retention policy with the regular expression “not equal”. Just in case you need it:
new != archive:
^ (
?! $archive
$)
.*$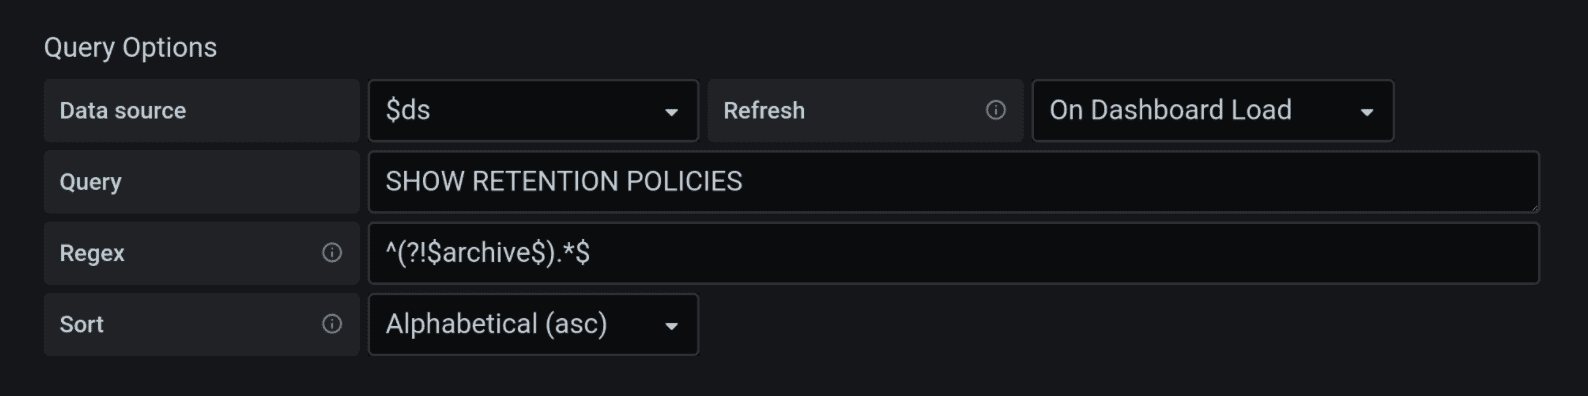
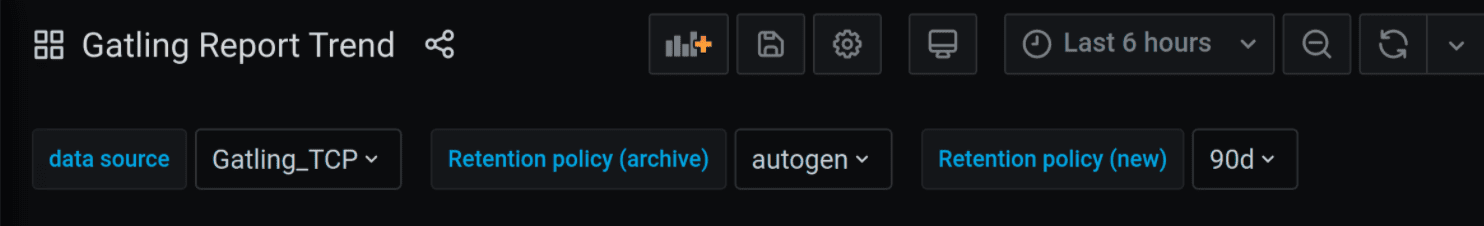
You will now have three variables on your Grafana dashboard: data source, your old retention policy and your new retention policy. One more variable you may need on your dashboard is Measurements, but the process of adding it is very similar. If you’re wondering how to create a grafana dashboard, start developing every Grafana dashboard like this, and you’ll see how well and fast everything will work. Having added all those parameters in advance, you’ll be able to use a single dashboard with several data sources. If you need it fast and agile, this is the way.
Another fast approach is using structured prompts to analyze load testing reports automatically, as shown in Prompts for Performance & Load Testing (Works with Any Report).
Filter Lists of Tags
Another thing you can add to your environment is filtration for the lists of tags. It’s easy and it will make your life a lot easier. If you have ever selected a tag from InfluxDB, most likely you did it with the following query: show tag values from “the needed measurement” with key = “the needed key”. This query is on top at StackOverflow, but the problem is that if you want tags for tests made in the last 5 minutes, even if there were zero tests, this query will still bring back all the tags.
This is because you have not used filtering by time. A simple step is to add “Refresh: On Time Range Change”, but that would work within the timeframe of the shard, i.e., a much bigger time frame than you need, since your default shard is most probably autogen. What saves us is adding this query:
SELECT "tag_name"

FROM

(SELECT last ("field_name")

  FROM "$new"."measurement"

  GROUP BY "tag_name")

WHERE $timeFilter
Our way is also scalable: you can use several schemes by adding the “Distinct” key operator.
SELECT DISTINCT ("tag_name")

FROM

(SELECT last ("field_name")

  FROM "$new"."measurement"

  GROUP BY "tag_name"),...

WHERE $timeFilter
Nota bene: $timeFilter can only be used once, so it is important to keep it in the end.
So if you now select the tests within the last 5 minutes, there will be zero simulations, while 90 days will give you 3, and 6 months will bring even more. The filter is now yielding very exact results, due to a minor improvement we have made. You can apply it to any of your dashboards to improve the results needed for your own specific tasks.
We hope that these life hacks will save you and your clients time. Afterall, there are other tasks that require a load testing engineer’s attention, apart from restructuring the data from the tests that have already been run. We hope that test report automation will spare you time for them.
Don’t forget to save this page and our blog to favourites: in the next parts, we will take a closer look at how to work with complicated tables in Grafana.