Ever wonder what’s really going on inside your system when you run performance tests or process data-intensive tasks? This article is for you.
We’ll explore what CPU time is, how to calculate CPU, and why it matters, especially for performance testers and engineers. You’ll learn to break down the simple formula, understand each component in real-life projects.
Let’s dive in now.
Key Takeaways
- CPU time measures the processor’s active execution time, distinct from elapsed or wall-clock time.
- High CPU time often reveals inefficient algorithms, excessive context switching, or resource contention.
- Tracking CPU time across workloads ensures fair resource allocation and cost optimization in cloud environments.
- Profilers and monitoring solutions provide visibility into per-thread and per-process CPU consumption.
- PFLB emphasizes CPU time analysis as a foundation for performance engineering and capacity planning.
What Is CPU Time?
CPU time is the total amount of time for which a processor spends executing a given task or process. It specifically measures how long the processor (CPU) is actively working on instructions, not including time the process is waiting for other resources like disk I/O or network input.
Think of CPU time like a stopwatch that only runs while the CPU is actually working on a task. If a program runs for 10 seconds but only keeps the CPU busy for 3 seconds, then its CPU time is 3 seconds.
It’s an essential performance metric when evaluating system efficiency. The more efficiently your code runs, the less CPU time it consumes, translating to faster apps, lower energy consumption, and improved user experience.
So, what does CPU time mean in practical terms? It tells you exactly how long the processor was doing real work, giving you direct insight into software efficiency.
Importance of CPU Time
CPU time is a window into how efficiently your system runs. The more time your processor spends executing instructions, the more resources it consumes. High CPU time can signal bottlenecks, poorly optimized code, or inefficient algorithms, all of which impact performance.
From a business perspective, minimizing CPU time can lead to serious gains:
- Faster processing means better user experience.
- Lower power consumption helps extend battery life on mobile and embedded devices.
- Reduced cloud infrastructure costs since many cloud providers bill based on compute time.
For performance testers and engineers, tracking CPU time gives a clear picture of system load and responsiveness. Whether you’re tuning a high-traffic web app or analyzing an API under stress, understanding and optimizing CPU time can help you reach your performance goals.
If you’re looking for expert help with system efficiency or stress testing, explore our load and performance testing services to learn how we can support your projects end to end.
CPU Time Calculation Formula
Here’s the classic CPU formula used to calculate CPU time:
This formula helps estimate how long the processor spends executing a task, which is an important metric when evaluating system performance. Let’s break it down.
Formula at a Glance
- Instruction Count: Total number of instructions your program executes
- Cycles Per Instruction (CPI): How many clock cycles are needed to complete each instruction
- Clock Cycle Time: How long a single clock cycle takes (in seconds or nanoseconds)
1. Instruction Count
The total number of instructions your program executes. This varies depending on the complexity of the algorithm and what exactly your application is doing.
Example
A simple loop may execute 500 instructions, while a machine learning algorithm could run millions.
This gives you an idea of the “volume” of work your processor needs to go through. Fewer instructions often mean more efficient code but not always. It depends on how well those instructions are executed.
2. Clock Cycles Per Instruction (CPI)
This tells us how many CPU cycles are needed to execute each instruction. Some instructions (like a basic addition) may only need 1 cycle, while more complex ones (like a division or memory access) could require several.
Each instruction typically passes through four stages:
- Fetch: Grabbing the instruction from memory
- Decode: Figuring out what to do with it
- Execute: Performing the action
- Write back: Saving the result
A lower CPI generally indicates faster execution, but keep in mind that CPU architecture and instruction types heavily influence this value.
3. Clock Cycle Time
This is the duration of one clock cycle, typically measured in nanoseconds. It’s determined by the processor’s clock rate (e.g., a 2 GHz CPU has a clock cycle time of 0.5 nanoseconds).
Faster clock speeds mean each cycle is shorter, but they may consume more power and generate more heat. That’s why raw speed isn’t the only factor in performance testing; balance is key.
Example of a CPU Time Calculation
Let’s say you’re running a performance test on an API:
- Instruction Count = 2,000,000
- CPI = 2
- Clock Cycle Time = 0.5 nanoseconds
CPU Time = 2,000,000 × 2 × 0.5 ns = 2,000,000 ns = 2 milliseconds
So, the CPU spent 2 milliseconds actively processing that API call. In a high-throughput environment, this adds up fast and could become a performance bottleneck.
A Note for Performance Testers
Understanding this formula is all about visibility. If you’re noticing CPU spikes during load testing or API benchmarking, breaking down CPU time can help you trace the root cause.
Tip
Try combining CPU time metrics with response times and memory usage for a fuller picture. Tools like , PFLB, JMeter or profiling monitors can help you map this out during large-scale tests.
Want to dig into practical metrics for APIs? Check out our guide on key metrics to track during API performance testing.
Key Point for Performance Testers and Engineers
When you’re running performance tests, CPU time is one of the clearest indicators of how well your system handles load under the hood. It shows how much real processing effort your application demands, and that’s critical when optimizing for speed, scalability, or cost.
Tracking CPU time helps you reveal:
- Whether your application is CPU-bound (limited by processing power) or waiting on something else (like disk I/O or network latency)
- How code or configuration changes affect processing efficiency
- Which parts of the system may need hardware upgrades or optimization
What Affects CPU Time?
Several architectural and system-level factors directly shape how long the CPU actively works on a task:
- Instruction count: More instructions mean more time spent executing them.
- CPI (cycles per instruction): Pipeline stalls, branch mispredictions, and dependencies can raise this number.
- Clock speed: A faster clock reduces CPU time, if cycles aren’t wasted.
- Cache efficiency: Cache misses delay instruction execution, increasing CPU time.
- Parallelism: Code that can’t be parallelized wastes potential CPU cycles.
- Compiler optimization: Smarter compilation reduces instruction count and boosts CPU efficiency.
These factors are especially critical in mobile environments, where CPU cycles are limited and energy consumption matters. If you’re working with mobile apps or need insights on optimization in resource-constrained systems, check out our guide to android apps performance and load testing.
How PFLB Optimizes CPU Time in Real-World Projects
At PFLB, performance testing is our specialty. With over 15 years of experience in performance engineering, we help companies uncover inefficiencies, fine-tune their systems, and deliver faster, leaner, and more scalable applications.
We’ve seen firsthand how high CPU time often signals deeper performance issues, especially in complex systems with large-scale user loads or heavy backend processing.
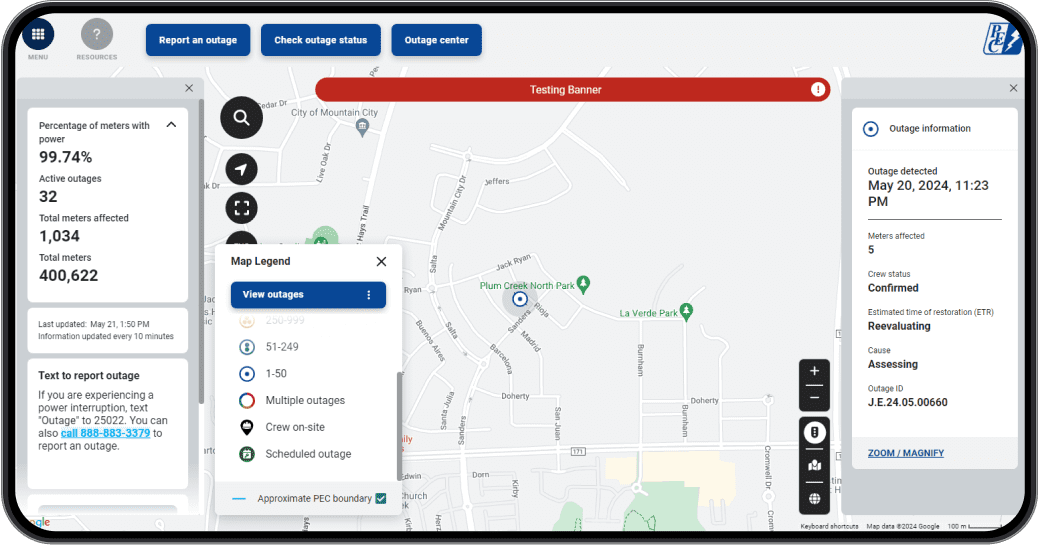
Real Results from Our Work
Why PFLB?
- We don’t stop at surface metrics, we dig deep into how your system uses CPU resources
- We optimize at every layer: from instruction handling to architecture-level parallelism
- We’ve done this before, across finance, utilities, education, and more
Explore more case studies and success stories here, or reach out to see how we can help optimize your systems: Check out all case studies
Final Thoughts
Tracking CPU time, also known as processor time, is important for identifying inefficiencies and making data-driven improvements. Whether you’re building a mobile app, a high-frequency trading platform, or testing an enterprise API, knowing how to calculate CPU time gives you a serious edge.
So next time you’re evaluating performance, ask yourself: What does CPU time tell me about this system? Chances are, it’s more revealing than you think.


