Performance Testing for Game Development: Process Automation
Mobile games require performance testing before they hit the market. Otherwise, thousands of users can complain about a game built for a high-end device, which can cause financial and reputational losses. Luckily, most key market players do realize it and run performance and load tests on a regular basis, during development, before every next release, etc., so the testing process becomes a necessary routine.
We are happy to share our expertise in performance testing since our performance testing services are popular among many different-scale mobile developers.
Challenges of Performance Testing in Gaming Companies
The performance testing routine usually involves a standard 7-step procedure: system analysis, testing methodology development, script development, execution of test scenarios, results analysis, tuning in case of negative results, and a release. Those stages that do require human engineering and are the most interesting are script development and tuning. And they are worth staff hours. However, the testing process itself and result analysis take hours and manual labor, and they are boring, too. In this article, we suggest one of the ways to automate them so that your testing engineers’ attention goes to where it is needed: tuning the system.
Another problem is that many game developers have to test several different games at a time in a shared testing environment and then compare the obtained results to the results of previous tests. Using Apache JMeter to test game performance is quite common, often accompanied by Jenkins for continuous integration (CI). While evaluating tools, understanding the difference between JMeter and K6 can help teams choose the most appropriate solution for their specific needs. However, when the number of tests in each project grows and files to analyze weigh gigabytes, stakeholders may become even more interested in test automation opportunities that can be used without external QA help.
Solution: JMeter Load Testing Center
JMeter Load Testing Center is an online web app/dashboard for CI of load testing with JMeter, built with Django. Load Testing Center (LTC) uses PostgreSQL to store data. It also uses the pandas module to analyze files with data. Pandas is an open-source data analysis and manipulation tool that analyzes CSV files from JMeter, even if they weigh gigabytes.
LTC’s main modules are:
1. Dashboard – front page with general information about the last tests;
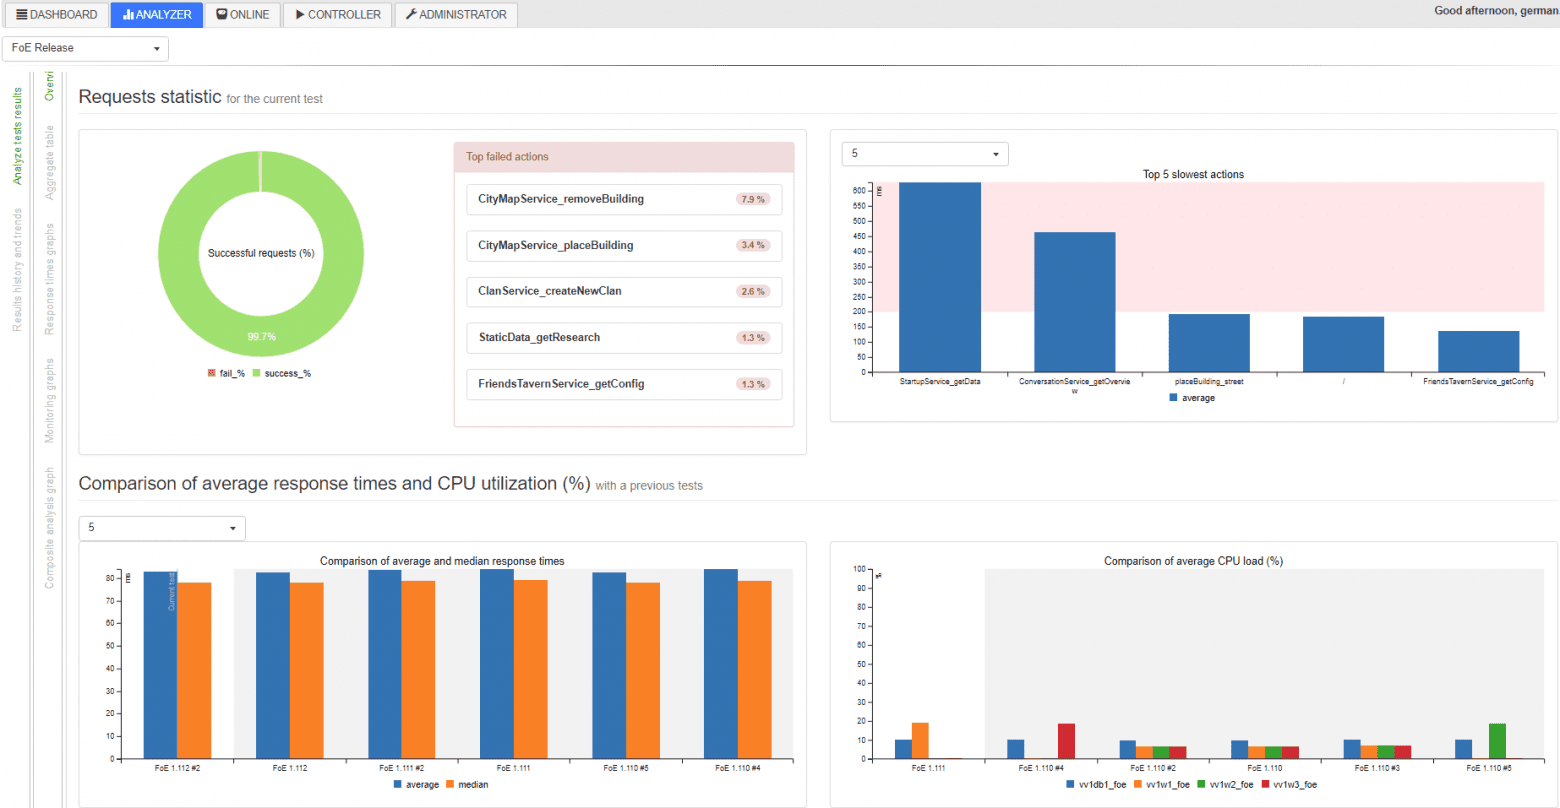
2. Analyzer – to build reports, analyze results, and compare results with another;
3. Online – for online monitoring for running tests;
4. Controller – to configure and run the tests;
5. Administrator – to configure different parameters.
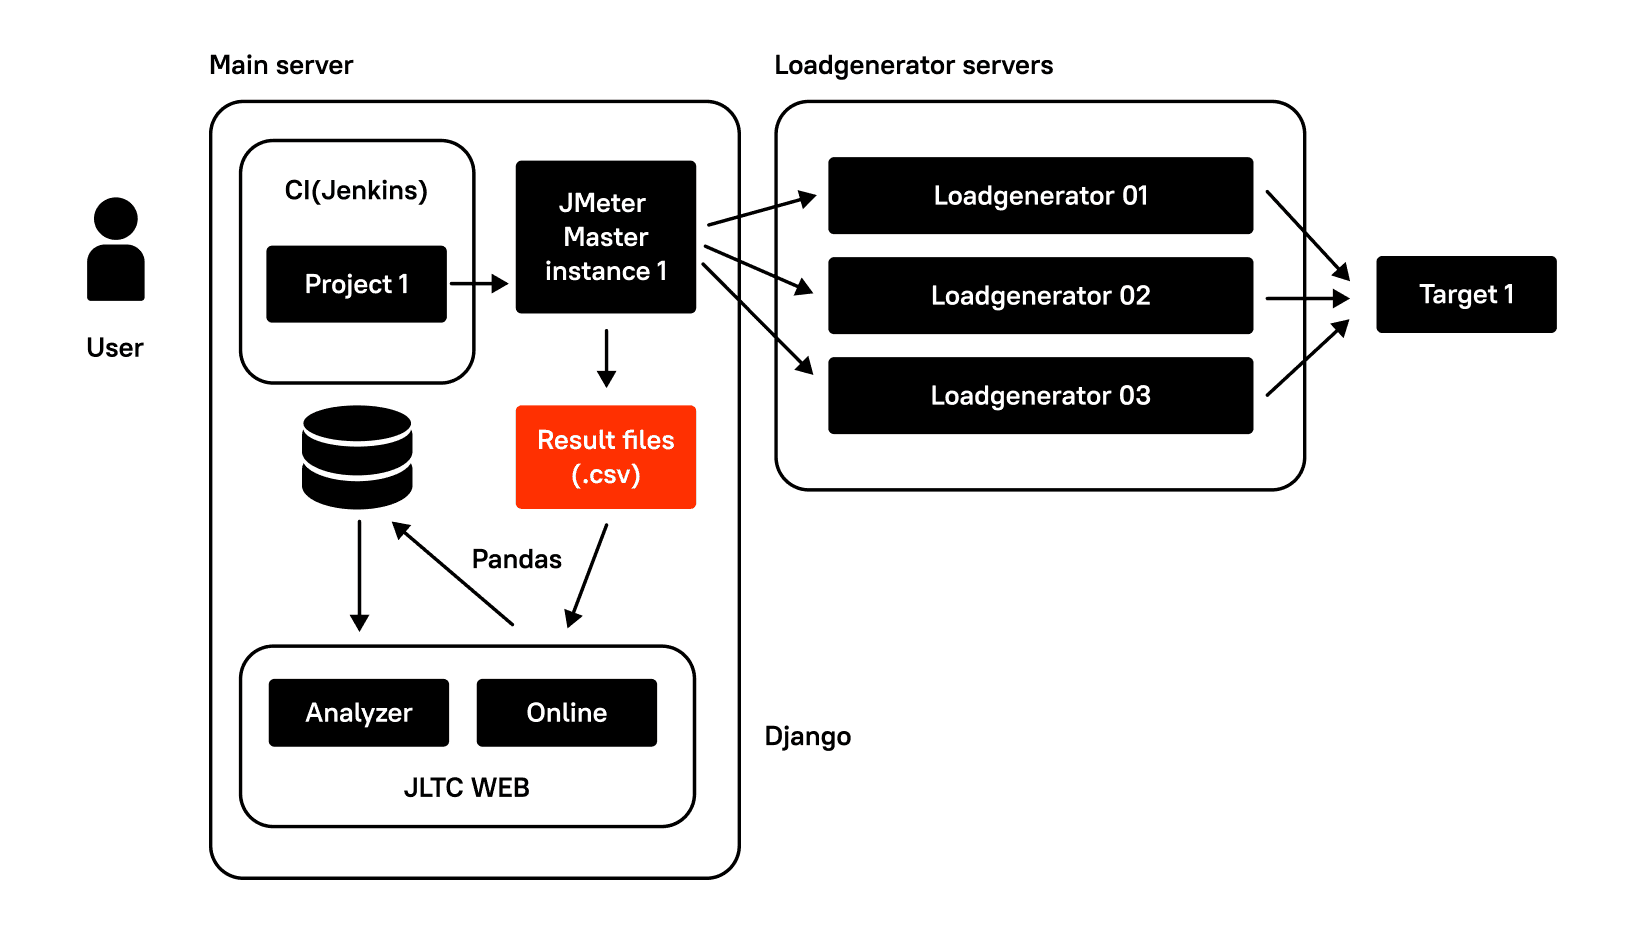
To run a test, just open Jenkins, choose a project, and click Start.
After that, Jenkins launches the main instance of JMeter on the main server, the one where Jenkins and LTC are located, and JMeter servers on one or more remote virtual machines in the required quantity. And the testing process begins.
During the test, a CSV file with JMeter results is created and updated with data in the project’s $WORKSPACE folder and another CSV file with remote host monitoring data.
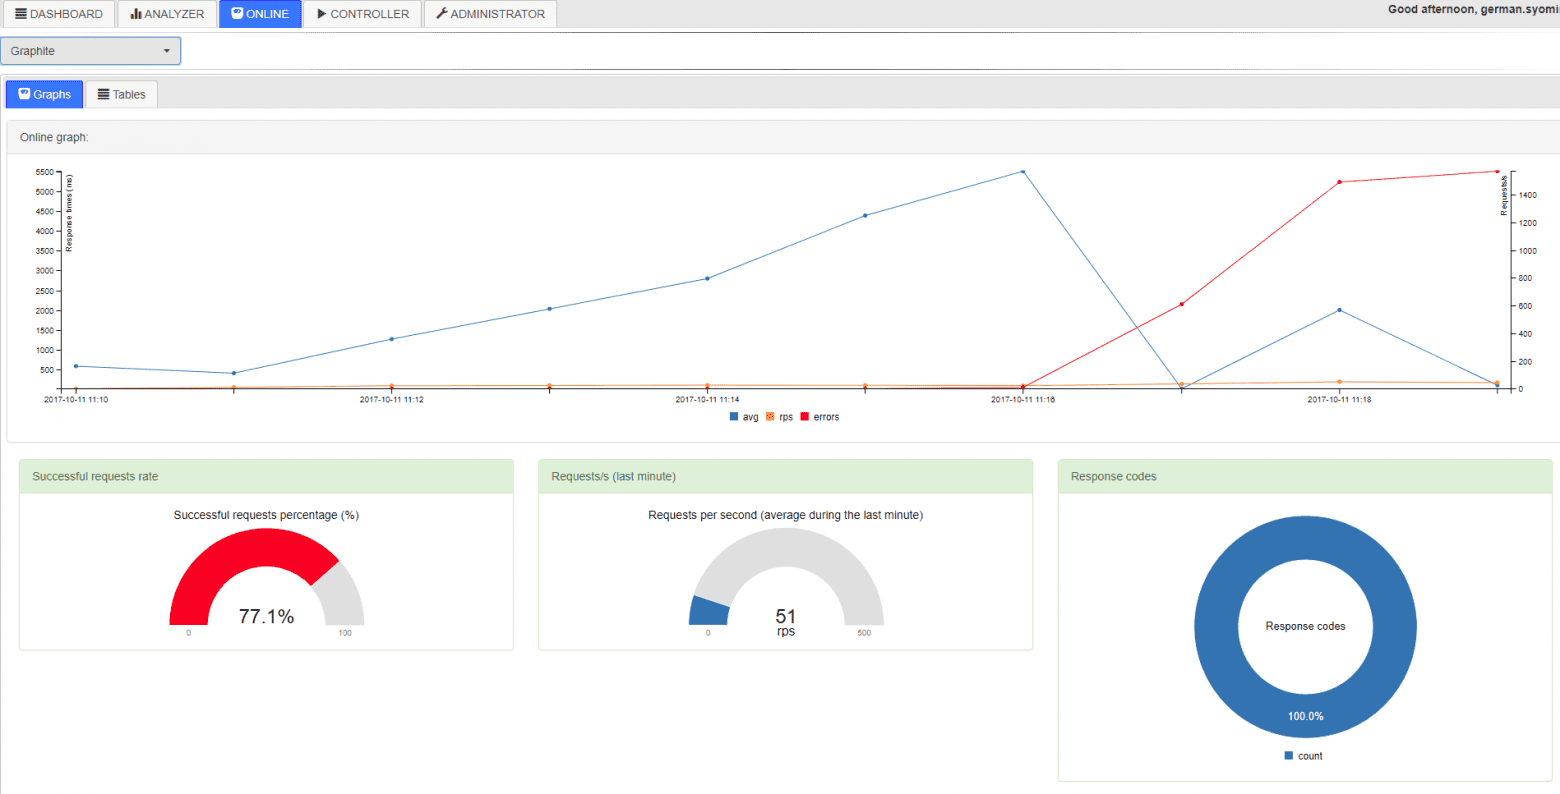
Then, you can open LTC and watch your test running online. At this time, the application will parse the aforementioned CSV files and put them in temporary tables in the database, based on which Online draws graphs:
Otherwise, you can wait until the end of the test, when a special script will gather all the data in one sheet to be analyzed in Analyzer and compared to the results of other tests. Voila!
Testing Several Gaming Projects Simultaneously
There is only one last problem: if you are testing several projects at a time, and they require different capacities to carry out the load, i.e., to emulate a different number of virtual users, how do you distribute the available, say, 10 virtual machine generators? You can assign each project to certain generators, make a schedule, or use a blocking plugin for Jenkins. But there is another option, too.
As we mentioned above, the backend is written on the Django framework. In the development of the front end, all the standard libraries were used: jQuery and bootstrap. For graphs, c3.js is a solution that easily draws the data received in JSON format.
Tables in the database usually have a pair of keys and one field with the JSONField() data type. JSONField is used because you can easily add new metrics to this table later without changing its structure.
Thus, a typical model that stores data on response times, the number of errors, and other things during one test looks very simple:
class TestData(models.Model):

   test = models.ForeignKey(Test)

   data = JSONField()

   class Meta:

      db_table = 'test_data'
In the data field, there are JSONs that store data aggregated in 1 minute.
To extract data from the table, there is one endpoint in urls.py that calls a function that processes this data and returns a conveniently readable JSON:
Endpoint:
url(r'^test/(?Pd+)/rtot/$', views.test_rtot),Function:
def test_rtot(request, test_id):Code to get a test start timestamp:
min_timestamp = TestData.objects.

       filter(test_id=test_id).

       values("test_id").

       aggregate(min_timestamp=Min(

           RawSQL("((data->>%s)::timestamp)", ('timestamp',))))['min_timestamp']
To extract the data from the database, subtract the min_timestamp obtained above to get the absolute test time, sort by timestamp, cast it to JSON and return:
d = TestData.objects.

       filter(test_id=test_id).

       annotate(timestamp=(RawSQL("((data->>%s)::timestamp)", ('timestamp',)) - min_timestamp)).

       annotate(average=RawSQL("((data->>%s)::numeric)", ('avg',))).

       annotate(median=RawSQL("((data->>%s)::numeric)", ('median',))).

       annotate(rps=(RawSQL("((data->>%s)::numeric)", ('count',))) / 60).

       values('timestamp', "average", "median", "rps").

       order_by('timestamp')

   data = json.loads(

       json.dumps(list(d), indent=4, sort_keys=True, default=str))

   return JsonResponse(data, safe=False)
On the frontend, you’ll have a c3.js graph that refers to this endpoint:
var test_rtot_graph = c3.generate({

       data: {

           url: '/analyzer/test/' + test_id_1 + '/rtot/',

           mimeType: 'json',

           type: 'line',

           keys: {

               x: 'timestamp',

               value: ['average', 'median', 'rps'],

           },

           xFormat: '%H:%M:%S',

           axes: {

               rps: 'y2'

           },

       },

       zoom: {

           enabled: true

       },

       axis: {

           x: {

               type: 'timeseries',

               tick: {

                   format: '%H:%M:%S'

               }

           },

           y: {

               padding: {

                   top: 0,

                   bottom: 0

               },

               label: 'response times (ms)',

           },

           y2: {

               min: 0,

               show: true,

               padding: {

                   top: 0,

                   bottom: 0

               },

               label: 'Requests/s',

           }

       },

       bindto: '#test_rtot_graph'

   });
This is the result:
Actually, the whole application consists of graphs like this one that draw data from the corresponding endpoints on the backend.
You can see how the whole system for analyzing tests works from the source codes, so next, we want to share the case template of load testing for games, as your own QA team may do.
Load Testing Games: Case Template
Load testing environment
The entire load testing environment should consist of one main server admin.loadtest, and several generatorN.loadtest servers. admin.loadtest for the case can be a Debian Linux 9 virtual machine, with 16 cores/16 gigs, running Jenkins, LTC and other neglectable software. generatorN.loadtest servers are bare virtual machines Debian Linux 8, with Java 8 installed. Their actual power can vary. On admin.loadtest, JMeter (the latest version with the most basic plugins) is installed as a pre-assembled deb distribution in the /var/lib/apache-jmeter folder.
GIT
The test plan for each project should be located in a separate project on your GitLab, and developers or QA from each team can suggest their own corrections. Each project should be configured to work with Git. Each project consists of ./jmeter_ext_libs/src/, ./test-plan.jmx, and ./prepareAccouts.sh.
Test plan
Each test plan uses a Stepping Thread Group with three variables: thread_count, ramp_up, and duration.
The values for these variables come from Jenkins when the test is run. Still, first, they must be put in the main element of the test plan in User-Defined Variables, like all the other parameterized variables. One of the important ones, let’s call it pool, is the one where a serial number for each running JMeter server is sent to, in order to subsequently differentiate the data pools used (for example, user logins). In ${__P(THREAD_COUNT,1)}, THREAD_COUNT is the variable name that will come from Jenkins, and 1 is the default value if it does not come.
Also, in each test plan, there is a SimpleDataWriter that stores the results of the samplers in a CSV file. The following options are activated in it:
<time>true</time>

            <latency>true</latency>

            <timestamp>true</timestamp>

            <success>true</success>

            <label>true</label>

            <code>true</code>

            <fieldNames>true</fieldNames>

            <bytes>true</bytes>

            <threadCounts> true</threadCounts>
Jenkins
Before running the test, each user can set some parameters that are passed to the above-mentioned variables of the JMeter test plan: server name, thread count, duration and ramp up.
Running the test
Now, let’s move on to the scripts. To begin with, prepare the JMeter distribution in the pre-build script:
#!/bin/bash

export PATH=$PATH:/opt/gradle/gradle-4.2.1/bin

echo "JMeter home: $JMETER_HOME"

JMETER_INDEX=$(cat /dev/urandom | tr -dc 'a-zA-Z0-9' | fold -w 8 | head -n 1)
Generate a random name:
JMETER_DIR="/tmp/jmeter-$JMETER_INDEX"

echo "JMeter directory: $JMETER_DIR"

echo $JMETER_DIR > "/tmp/jmeter_dir$JOB_NAME"

mkdir $JMETER_DIR

cp -rp $JMETER_HOME* $JMETER_DIR

if [ -d "$WORKSPACE/jmeter_ext_libs" ]; then

    echo "Building additional JMeter lib"

    cd "$WORKSPACE/jmeter_ext_libs"

    gradle jar

    cp ./build/libs/* $JMETER_DIR/lib/ext/

    ls $JMETER_DIR/lib/ext/

fi

cd $WORKSPACE
Going back to the challenge discussed above, if you have multiple virtual machines designed to generate load (and you do not know if tests from other projects are being run at the moment), based on the required total number of emulated THREAD_COUNT threads, let’s say you need to run a certain number of JMeter servers sufficient to emulate the required load on these virtual machines.
In our script, this is done using three lines in the Jenkins bash script, which naturally leads to more serious operations in the LTC scripts:
REMOTE_HOSTS_DATA=`python /var/lib/jltc/manage.py shell -c "import controller.views as views; print(views.prepare_load_generators('"$JOB_NAME"','"$WORKSPACE"','"$JMETER_DIR"', '$THREAD_COUNT', '$duration'));"`

THREADS_PER_HOST=`python -c 'import json,sys;data=dict('"$REMOTE_HOSTS_DATA"');print data["threads_per_host"]'`

REMOTE_HOSTS_STRING=`python -c 'import json,sys;data=dict('"$REMOTE_HOSTS_DATA"');print data["remote_hosts_string"]'`

REMOTE_HOSTS_DATA=`python /var/lib/jltc/manage.py shell -c "import controller.views as views; print (views. prepare_load_generators ('"$JOB_NAME"', '"$WORKSPACE"', '"$JMETER_DIR"', '$THREAD_COUNT', '$duration'));"`

THREADS_PER_HOST=`python -c 'import json,sys;data=dict ('"$REMOTE_HOSTS_DATA"'); print data["threads_per_host"]'`

REMOTE_HOSTS_STRING= `python -c 'import json,sys;data=dict ('"$REMOTE_HOSTS_DATA"'); print data["remote_hosts_string"]'`
Thus, in the first line, you call the prepare_load_generators function and put various data in it, namely, the project name, the path to the project workspace directory, the path to the temporary JMeter distribution (/tmp/jmeter-xvgenq/) created above, the duration of the test, and, most importantly, the desired total number of emulated threads $THREAD_COUNT. What happens next is visible in the repository. To summarize it:
{

       “remote_hosts_string”: “generator1.loadtest:10000,generator2.loadtest:10000, generator2.loadtest:10001”,

       "threads_per_host": 100

   }

 {

       “remote_hosts_string”: “generator1.loadtest:10000, generator2.loadtest:10000, generator2.loadtest:10001”,

       "threads_per_host": 100

   }
As you can see, at that moment, all JMeter servers are running and waiting to be connected; then, the test itself will begin. Thus, further in the second and third lines, we take the values from this JSON and pass them to the main instance of JMeter. The initial value of THREAD_COUNT is divided between remote JMeter servers, and each accounts for threads_per_host (note that for the THREAD_COUNT, we pass the value of threads_per_host as calculated above):
java -jar -server $JAVA_ARGS $JMETER_DIR/bin/ApacheJmeter.jar -n -t $WORKSPACE/test-plan.jmx -R $REMOTE_HOSTS_STRING -GTHREAD_COUNT=$threads_per_host -GDURATION=$DURATION -GRAMPUP=$RAMPUPThere’s a different model for running remote JMeter servers. Save data about tests running, the virtual machines, ports, ids of this process, etc. It will be necessary to stop the test when the same JMeter servers need to be destroyed.
class JmeterInstance(models.Model):

    test_running = models.ForeignKey(TestRunning, on_delete=models.CASCADE)

    load_generator = models.ForeignKey(LoadGenerator)

    pid = models.IntegerField(default=0)

    port = models.IntegerField(default=0)

    jmeter_dir = models.CharField(max_length=300, default="")

    project = models.ForeignKey(Project, on_delete=models.CASCADE)

    threads_number = models.IntegerField(default=0)

    class Meta:

        db_table = 'jmeter_instance'
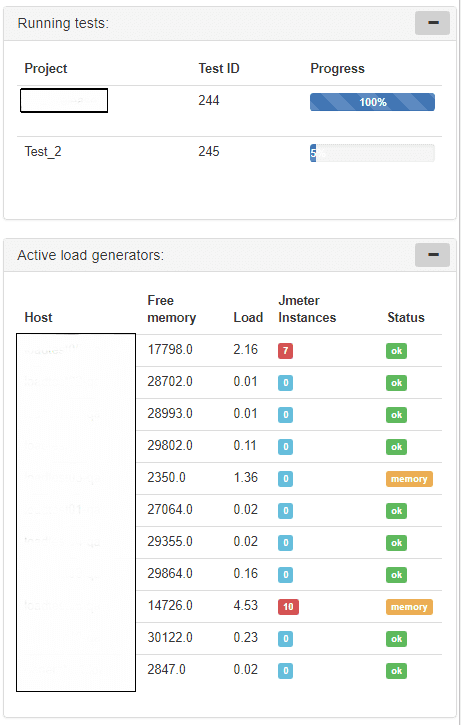
Meanwhile, the front page displays nice visuals summarizing some of the data on running tests and the status of load generators.
Stopping the test
After the test, it is necessary to destroy all running JMeter servers, delete temporary JMeter distributions and collect the results. The post-build script should look like this:
JMETER_DIR=$(cat /tmp/jmeter_dir$JOB_NAME)

echo "Removing Jmeter dir from admin: $JMETER_DIR"

rm -rf $JMETER_DIR

python /var/lib/jltc/manage.py shell -c "import controller.views as views; print(views.stop_test_for_project('"$JOB_NAME"'))"

JMETER_DIR=$(cat /tmp/jmeter_dir$JOB_NAME)

echo "Removing Jmeter dir from admin: $JMETER_DIR"

rm -rf $JMETER_DIR

python /var/lib/jltc/manage.py shell -c "import controller.views as views; print (views.stop_test_for_project ('"$JOB_NAME"'))"
Start with deleting the temporary distributive from the main server, then call the stop_test_for_project function, passing the project name to it. The function will go through a special table in the database, which stores information about running JMeter instances and stops them.
For the final step, to collect the results of your tests, you will have to use one of two possible ways. The first one is to run this script:
python /var/lib/jltc/datagenerator_linux.pyOtherwise, you can call a web service locally:
curl --data "results_dir=$JENKINS_HOME/jobs/$JOB_NAME/builds/$BUILD_NUMBER/"http://localhost:8888/controller/parse_results

curl --data "results_dir=$JENKINS_HOME/jobs/$JOB_NAME/ builds/$BUILD_NUMBER/" http://localhost:8888/controller/parse_results

curl --data "results_dir=$JENKINS_HOME /jobs/$JOB_NAME/builds/ $BUILD_NUMBER/" http://localhost:8888/controller/ parse_results
That’s it!
The Results
Of course, the results you will get using this game performance testing case template are not universal. You can also use InfluxDB to store metrics and the Grafana dashboard to visualize them. But to analyze the results of different tests or compare test results from different projects, you will either have to automate your reports with InfluxDB and Grafana, too (you can read about it here), or use this solution. If your team needs help with any of these scenarios, please let us know: we have 450+ certified testers on board who have handled over 300 performance or load testing projects worldwide. To get a skilled team of testers to work on your project, contact us!
Related insights in blog articles
11 API Failure Causes and How To Solve Them

When an API fails, the consequences ripple quickly through the entire system. Transactions stall, integrations break, and frustrated users flood your support channels. Understanding exactly why API failures happen — and how to fix them — is essential for developers and businesses alike. This article examines the most common reasons behind API failures, explores the […]
API Mocking: A Complete Guide
Waiting for APIs to become available or stable can slow down entire projects. API mocking provides a smart way to avoid these roadblocks by simulating real API responses, keeping your teams productive and ensuring smoother integration down the line. In this guide, you’ll discover exactly what API mocking involves, how it differs from using real […]
API Endpoint: A Complete Guide
Modern applications rely heavily on APIs (Application Programming Interfaces) to communicate and exchange data across different systems. At the heart of this interaction lies the API endpoint — a fundamental concept that defines where and how data exchanges happen. This guide explains clearly what an API endpoint is, outlines its importance, and provides practical insights […]
gRPC vs. REST: Detailed Comparison

Choosing between gRPC and REST can feel confusing, especially if you’re trying to figure out the best way for your applications to communicate. This article breaks down the grpc vs rest comparison clearly, without jargon or confusion. You’ll learn exactly what each protocol is, the advantages and disadvantages of each, and understand why gRPC is […]
Be the first one to know
We’ll send you a monthly e-mail with all the useful insights that we will have found and analyzed
People love to read
Explore the most popular articles we’ve written so far
- Top 10 Online Load Testing Tools for 2025 May 19, 2025
- Cloud-based Testing: Key Benefits, Features & Types Dec 5, 2024
- Benefits of Performance Testing for Businesses Sep 4, 2024
- Android vs iOS App Performance Testing: What’s the Difference? Dec 9, 2022
- How to Save Money on Performance Testing? Dec 5, 2022
