Imagine launching a new product, only to have your website crash the moment traffic spikes. Or rolling out an update, confident in its stability — until real users start complaining about slow response times and timeouts. Performance issues can make or break an application, and that’s why performance testing is non-negotiable. Many development teams are discovering the benefits of continuous performance testing to catch these issues early, preventing costly failures in production.
Now, the question is: What’s the best tool for load testing?
There’s no shortage of options, but two names stand out:
- JMeter – A well-established, open-source tool with broad protocol support.
- Gatling – A developer-friendly, high-performance framework built for automation.
Both tools has its strengths and trade-offs. But if you’re wondering which one fits your team’s workflow, technical expertise, and performance testing needs, this guide will break it all down for you.
Performance testing tools come in different flavors, each catering to specific use cases, technical expertise, and scalability needs. Modern approaches often emphasize continuous delivery performance testing to ensure reliability throughout development. Let’s compare the tools to understand what they bring to the table.
What is JMeter?
JMeter is one of the most well-known open-source performance testing tools, developed by the Apache Foundation. It has been around for years and remains a go-to solution for testing web applications, APIs, databases, and various other services.
Best For: Teams that need an open-source, highly extensible tool for multi-protocol testing, provided they’re comfortable with manual configuration and infrastructure setup.
For teams looking to avoid the complexity of setting up and maintaining infrastructure manually, exploring options like running JMeter tests in the cloud can significantly reduce overhead and improve scalability. Meanwhile, those focused on backend robustness, especially in microservices or complex API ecosystems, leveraging advanced methods to ensure API stability under load becomes essential to validate performance under real-world conditions.
What is Gatling?
Gatling is a developer-centric performance testing framework designed for modern web applications. Unlike JMeter, which provides a GUI, Gatling is entirely code-driven, meaning tests can be written as Scala, Kotlin, Java and JavaScript code.
Best For: Developers and DevOps teams who prefer a “load testing as code” approach, need high-performance test execution, and want to integrate performance testing directly into CI/CD pipelines. Learn more about Gatling alternatives in our article.
JMeter vs Gatling: Comparison Table
How does Apache JMeter compare to Gatling for load testing? Check out the JMeter and Gatling comparison below:
| Aspect | Apache JMeter | Gatling (Open Source) |
|---|---|---|
| License/Cost | Open-source, free to use. No licensing cost, but users must provision and maintain their own infrastructure. | Open-source (free) core engine. Gatling Enterprise (paid) available for additional features and support. |
| Test Design Approach | GUI-driven test plan creation. Supports HTTP recording and scripting in Groovy/Java for advanced logic. | Code-based DSL for test scenarios (Scala/Java/Kotlin). No built-in GUI, but a Recorder can generate scripts from user flows. |
| Supported Protocols | Broad protocol support: HTTP/HTTPS, FTP, JDBC, SOAP, REST, JMS, SMTP, POP3, IMAP, LDAP, TCP, and more. Extensible via plugins. | Primarily web-focused: HTTP/HTTPS, WebSockets, JMS, and SSE. Does not natively support databases, FTP, or email testing without additional code. |
| Extensibility & Customization | Highly extensible via plugins and scripting. Large community contributing extra protocols, graphs, and functions. | Supports custom protocol implementations via code. Can integrate with external libraries but has fewer ready-made plugins. |
| Scalability | Supports distributed testing, but users must manually set up and maintain load generators. Cloud scaling is possible via third-party services. | Efficient load generation using asynchronous architecture. For extremely large tests, manual distribution or Gatling Enterprise for clustering. |
| Reporting & Results | Basic reports in GUI with a CLI report generator. Supports CSV/XML exports and integration with external tools like Grafana for real-time monitoring. | Generates automatic HTML reports with detailed performance metrics. Open-source version lacks live monitoring, requiring external metric push for real-time tracking. |
| CI/CD & Automation | Supports automation via CLI. Can integrate into CI/CD pipelines (Jenkins, Azure DevOps, GitLab CI) but requires additional setup and maintenance. | Designed for CI/CD. Simulations are written in code, making it easy to integrate with Jenkins, Maven, and Gradle for automated performance testing. |
| Ease of Use | Medium – GUI helps with basic tests but complex scenarios require scripting. Setting up distributed tests can be time-consuming. | High for developers, as the code-based approach is structured and efficient. Low for non-programmers due to the requirement to write and maintain Scala scripts. |
| Ideal Use Cases | Comprehensive performance testing where multiple protocols are needed, especially for enterprises with experienced performance engineers. Suitable for teams that can fine-tune infrastructure and configurations. | Best for continuous performance testing in development/DevOps environments. Great for stress-testing high-traffic services efficiently and integrating with CI/CD pipelines. Works well when teams have coding expertise. |

• Discuss different options
• Receive a personalized quote
• Sign up and get started
What Are The Key Differences Between JMeter and Gatling?
Every performance testing tool has its strengths and trade-offs. Let’s explore Gatling vs Jmeter comparison in more detail:
JMeter: Pros and Cons
One of the key Apache Jmeter and Gatling differences is that JMeter is a go-to open-source solution for performance testing, widely used in enterprise environments. It’s flexible but comes with notable challenges. Learn more about JMeter alternatives.
✅ Pros:
- Free and open-source – No licensing costs, making it accessible to all teams.
- Broad protocol support – Works with HTTP(S), FTP, JDBC, JMS, SOAP, REST, SMTP, LDAP, and more, making it ideal for testing complex system architectures.
- Highly extensible – Large plugin ecosystem and support for scripting (Groovy, Java, JSR223) allow customization for advanced scenarios.
- Integration-ready – Works with Jenkins, GitLab CI/CD, InfluxDB, Grafana, and other monitoring tools for test execution and reporting.
❌ Cons:
- High memory consumption for large-scale tests – Uses a thread-based approach, requiring multiple machines for massive loads.
- No real browser execution – JMeter sends HTTP requests but does not execute JavaScript, making it harder to test modern dynamic web applications.
- Requires manual setup – Distributed load testing involves configuring multiple instances manually, which can be time-consuming.
- Outdated GUI – While functional, JMeter’s interface feels clunky compared to modern tools, leading to a steeper learning curve for beginners.
Gatling: Pros and Cons
Gatling is a high-performance testing framework designed for developers and DevOps teams. It excels in efficiency and automation, but its code-driven approach limits accessibility.
✅ Pros:
- Lightweight and scalable – Uses asynchronous non-blocking IO, enabling it to simulate high user loads with minimal resource consumption.
- Great for CI/CD – Designed to fit seamlessly into DevOps workflows, making it ideal for continuous performance testing.
- Rich reporting – Generates detailed HTML reports with response time distributions, error rates, and percentiles.
- Good scripting capabilities – Written in Scala, Kotlin, Java and JavaScript, allowing for precise control over test scenarios.
- Efficient for high-traffic services – Gatling’s architecture allows it to handle thousands of virtual users per instance, reducing hardware needs.
❌ Cons:
- Requires programming knowledge – Tests are written in Scala (or Java/Kotlin), which creates a steep learning curve for non-developers.
- No built-in GUI – Unlike JMeter or PFLB, Gatling lacks a native graphical test builder, meaning users must define test flows entirely in code.
- Limited protocol support – Primarily supports HTTP(S), WebSockets, JMS, and SSE, making it less versatile than JMeter for database, email, or FTP testing.
- Scaling requires manual setup – While efficient, running tests across multiple machines requires Gatling Enterprise or manual orchestration.
What If Neither Is For You?
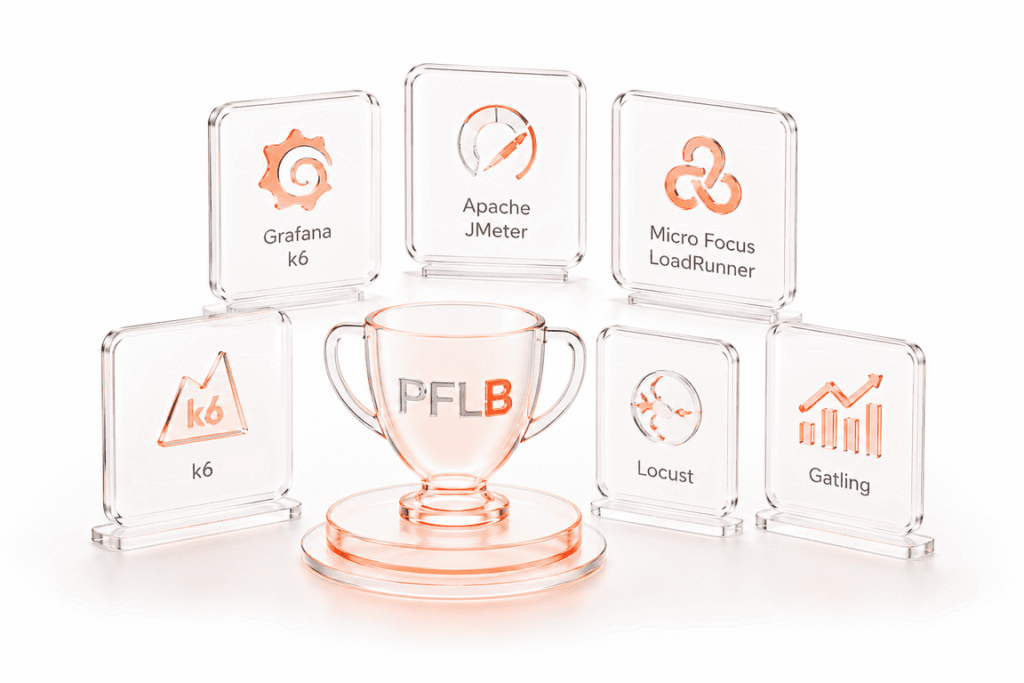
If neither Gatling nor Locust fits you needs — consider PFLB. PFLB is a next-generation, cloud-based performance testing platform that takes a radically different approach from traditional tools like JMeter and Gatling. Instead of requiring complex scripting or infrastructure setup, PFLB provides an easy-to-use, AI-powered environment for large-scale performance testing.
Best For: Enterprises and teams that want fast, scalable, and effort
Final Thoughts
Looking closely at JMeter vs Gatling you can see that traditional performance testing tools still have their place, but they come with trade-offs—whether it’s complex setup, scripting requirements, or infrastructure limitations. They work well if you have a dedicated team of engineers ready to fine-tune and maintain your testing environment. But for businesses that need scalability, efficiency, and real-time insights without the hassle, PFLB is the smarter choice.
With cloud-based scalability, AI-driven analysis, and a no-code interface, PFLB removes technical barriers while delivering enterprise-level performance testing. Whether you’re simulating millions of users, running continuous CI/CD tests, or preparing for a high-traffic event, it provides everything you need without the complexity.
If performance testing should be seamless, scalable, and insightful — PFLB is the way forward.