If you have faced performance issues with your product or are getting ready for a release, you have probably already started thinking about performance testing. You might (and should!) be interested in finding out which operations slow down your system the most, what load can it endure, or what number of users can use it concurrently without causing response time growth.
There are special tools designed to help you find answers to each of these questions through performance testing, but their interfaces often take time and effort to get familiar with. If you are not into spending lots of your time on reading documentation and tutorials, we have good news for you: there is an exception to every rule! In this blog post we’re describing how to run performance testing with PFLB, even if it is the first performance testing project in your life.
What is the PFLB?
PFLB is a cloud platform designed to evaluate the performance of websites, mobile applications, REST, and gRPC API services. It helps you understand how your system works under load when visited by many concurrent users.
The service is really easy to use: make a request to emulate the load, set up virtual users’ activity parameters and get a report which helps identify performance issues. For websites, there is an even easier way: use your Google Analytics data to create a load profile automatically.
Getting Started and Setting Profile Distribution
First of all, you will need to log in to the system. You can use your email or your Google Analytics profile to register on PFLB. The process is as simple as any other registration, and the prices are reasonable, so we’re sure you’ll make it.
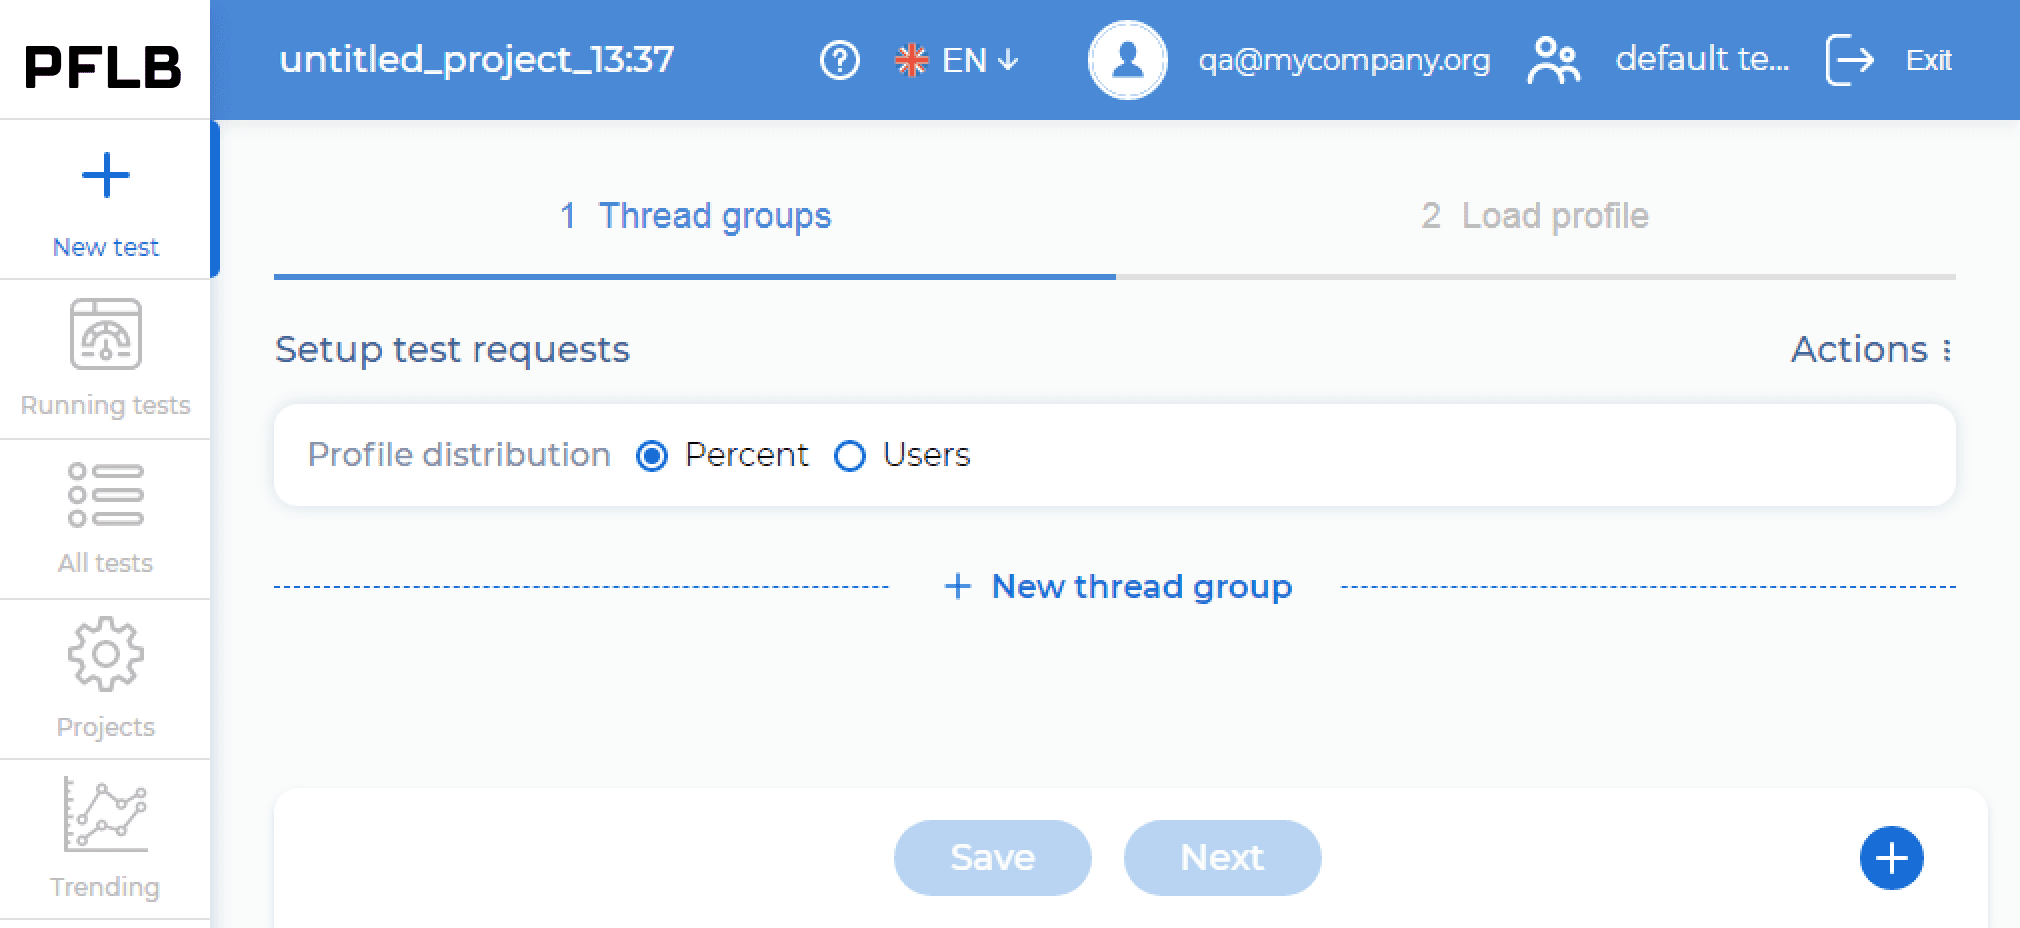
As soon as you are log in, you can start creating your first test. Click the New Test icon on the left of the screen to create a new test project, namely, a set of HTTP requests or transactions. Scenarios, or a specified order of executing such requests, are called Groups.
An HTTP request is a message sent by a client, usually a browser, to the server. When you click the link or type text in the message field, you send an HTTP: any user activity on the website is a set of HTTP requests. A transaction is a group of HTTP requests that are sent to the server with certain parameters.
Before you create groups, you have to set up the rules of load distribution between them. PFLB supports two modes of virtual users distribution:
The first option is easier to set up, while the second gives you more flexibility. You can choose the option you prefer in the Thread groups section, but if you are new to performance testing, we recommend using the Percent mode of profile distribution.
Creating a Test
Now you are ready to create your first test! There are three ways to do it: write your own test scenarios, copy the pre-existing request groups, or import data. Whichever way you choose, you will not need any preliminary experience or extra effort. You can see for yourself.
Create a Group Manually
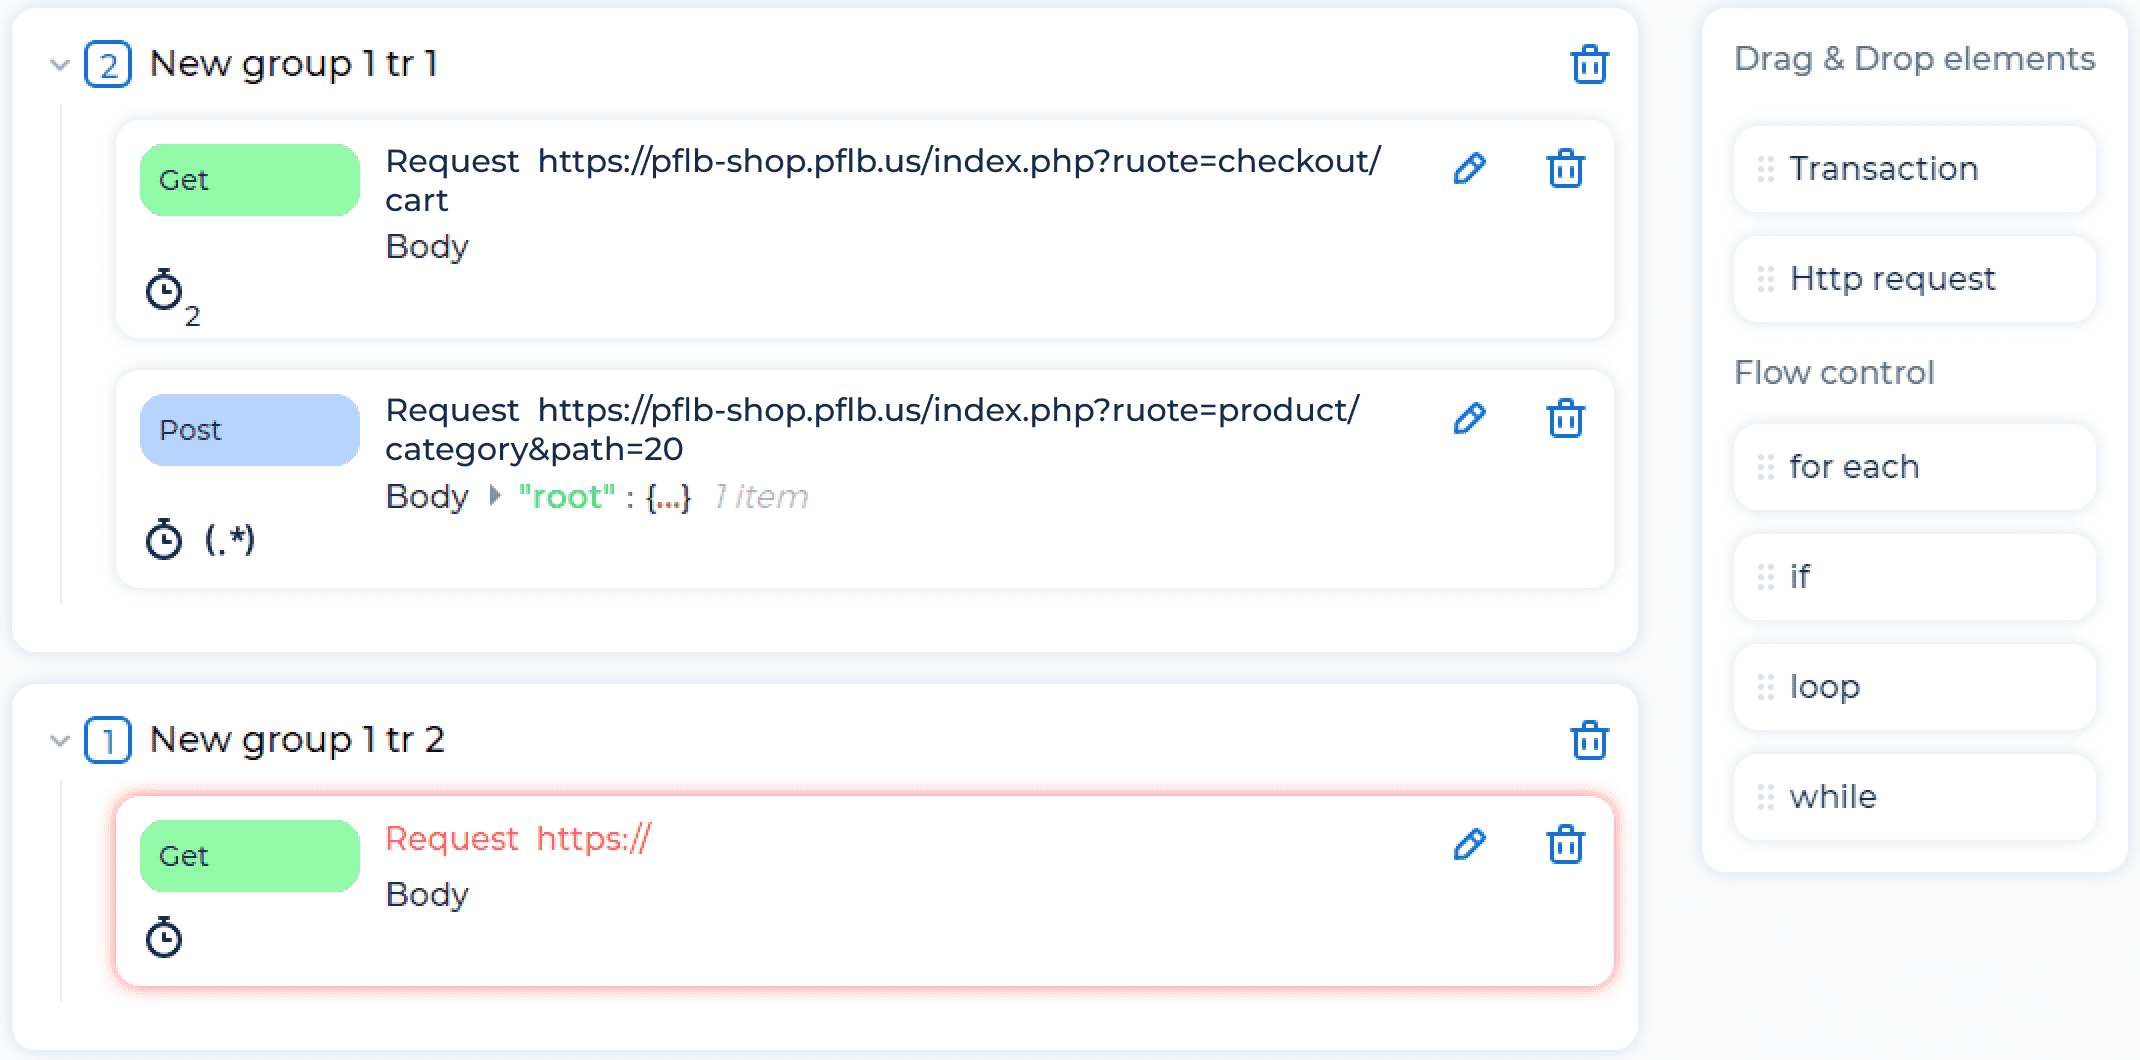
To create a group manually, click + New thread group. The group will be added to the list. To add an action to the group, click the pencil icon which opens the editor.
A thread group is a group of requests that is executed by the system in a certain sequence. In other words, it can be called your test scenario. For instance, visiting your website, clicking the button, filling in the form, and other actions of your regular user are described as a sequence of requests with preset parameters (e.g., time between request execution).
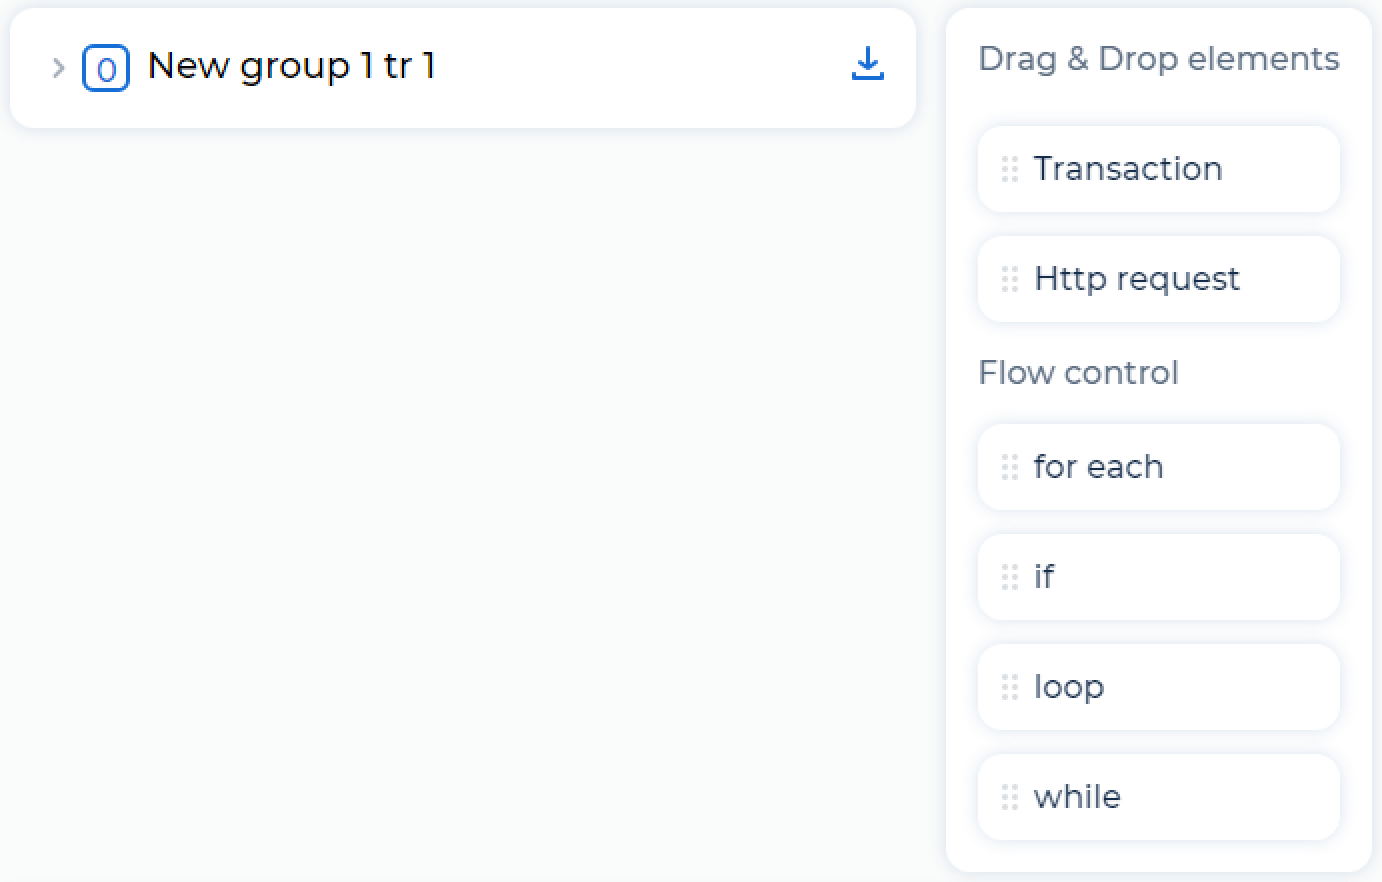
A menu on the right of the editor’s window allows you to create new test elements. Simply use Drag & Drop to move the HTTP request or Transaction elements to the left. Use the pencil icon to edit the HTTP request.
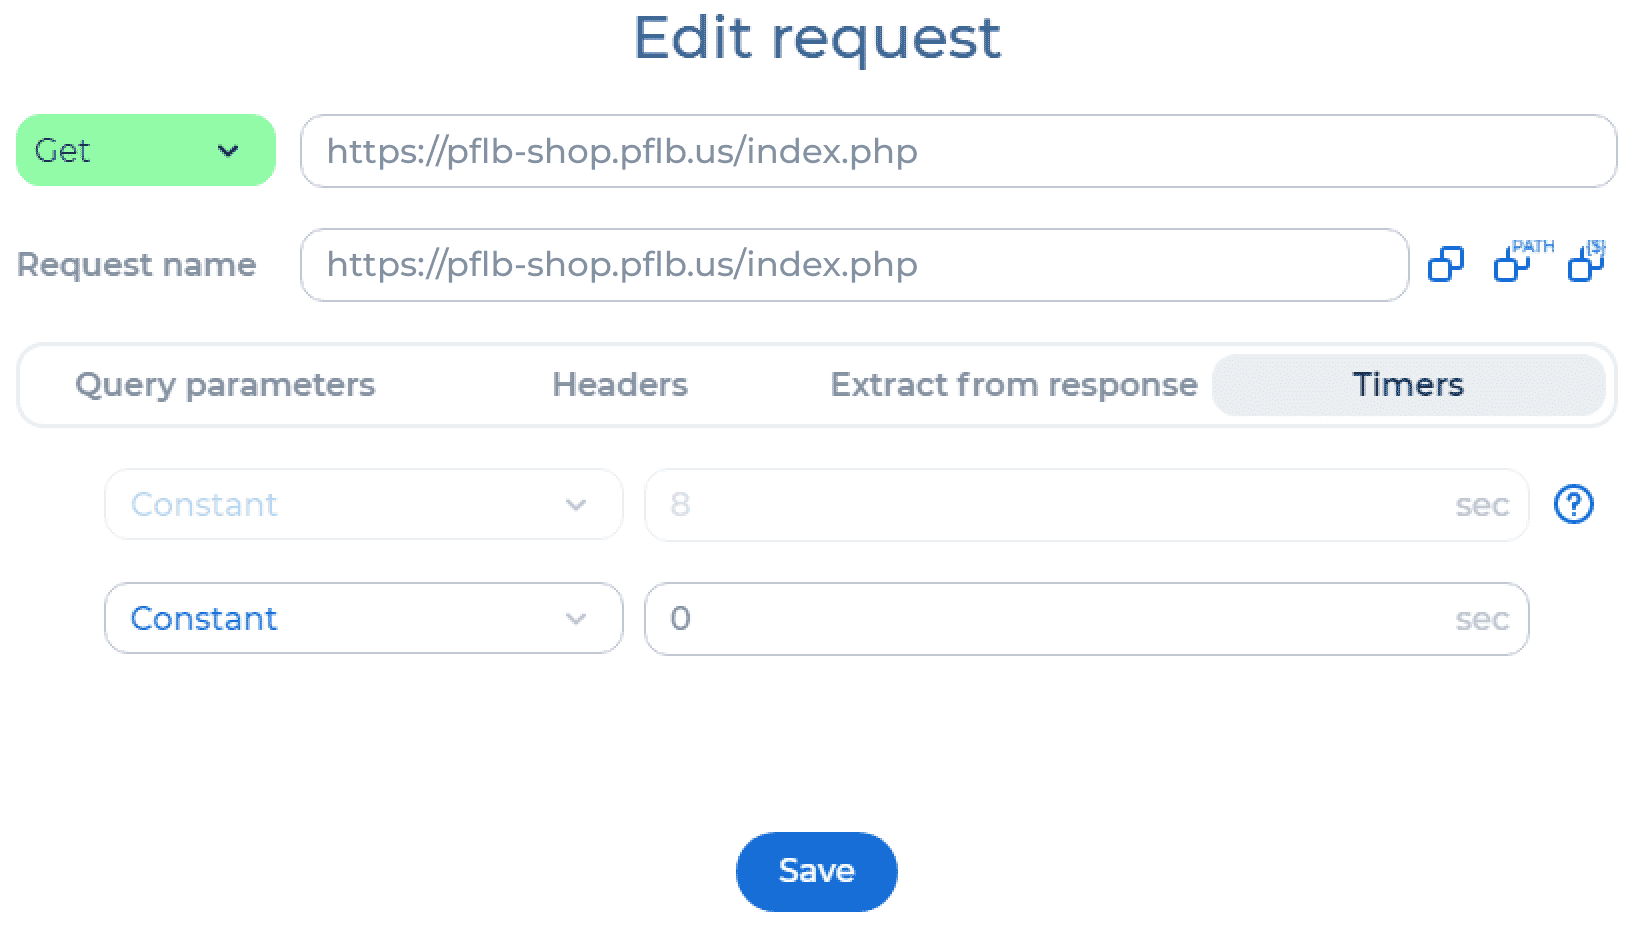
You can set up particular actions for PFLB to execute during the test by editing the HTTP request. Click the green field and select the HTTP method from a drop-down list: Get, Post, Put, etc. Then, add the request URL.
You can also set up a range of parameters for any request by using the tabs under the address bar:
For each group, you can set up additional parameters of flow control, such as for each, if, loop, or while. This is how you create one or several test scenarios.
Import Groups
You can also create test scenarios based on data on requests or transactions collected by third-party applications or services. In such cases, groups will be created automatically based on the criteria you set up. Then, you can edit scenarios in the same way that you edit those created manually.
To import groups data, click Import in the lower right corner of the screen, choose a tab that corresponds to the type of data you are importing, and click the button to choose the file to upload.
PFLB supports data from the following sources:
Copying Groups
If you have pre-existing groups of requests, you can base the new ones on them. Just use the copy icon in the group you need. You will then be able to edit any parameters in the new group and add or delete requests and transactions.
Additional Settings
Choose Load Generators Location
By default, you can simulate the load only from N. Virginia, but if you have an active subscription plan you can pick another region. Due to PFLB integration with Amazon Web Services (AWS), you can choose from one of the regions depending on where your customers are located. If you’re interested in gathering more data from Amazon, you might find this guide on how to scrape Amazon useful.
To do so, select one of the following in the drop-down list:
Set SLA
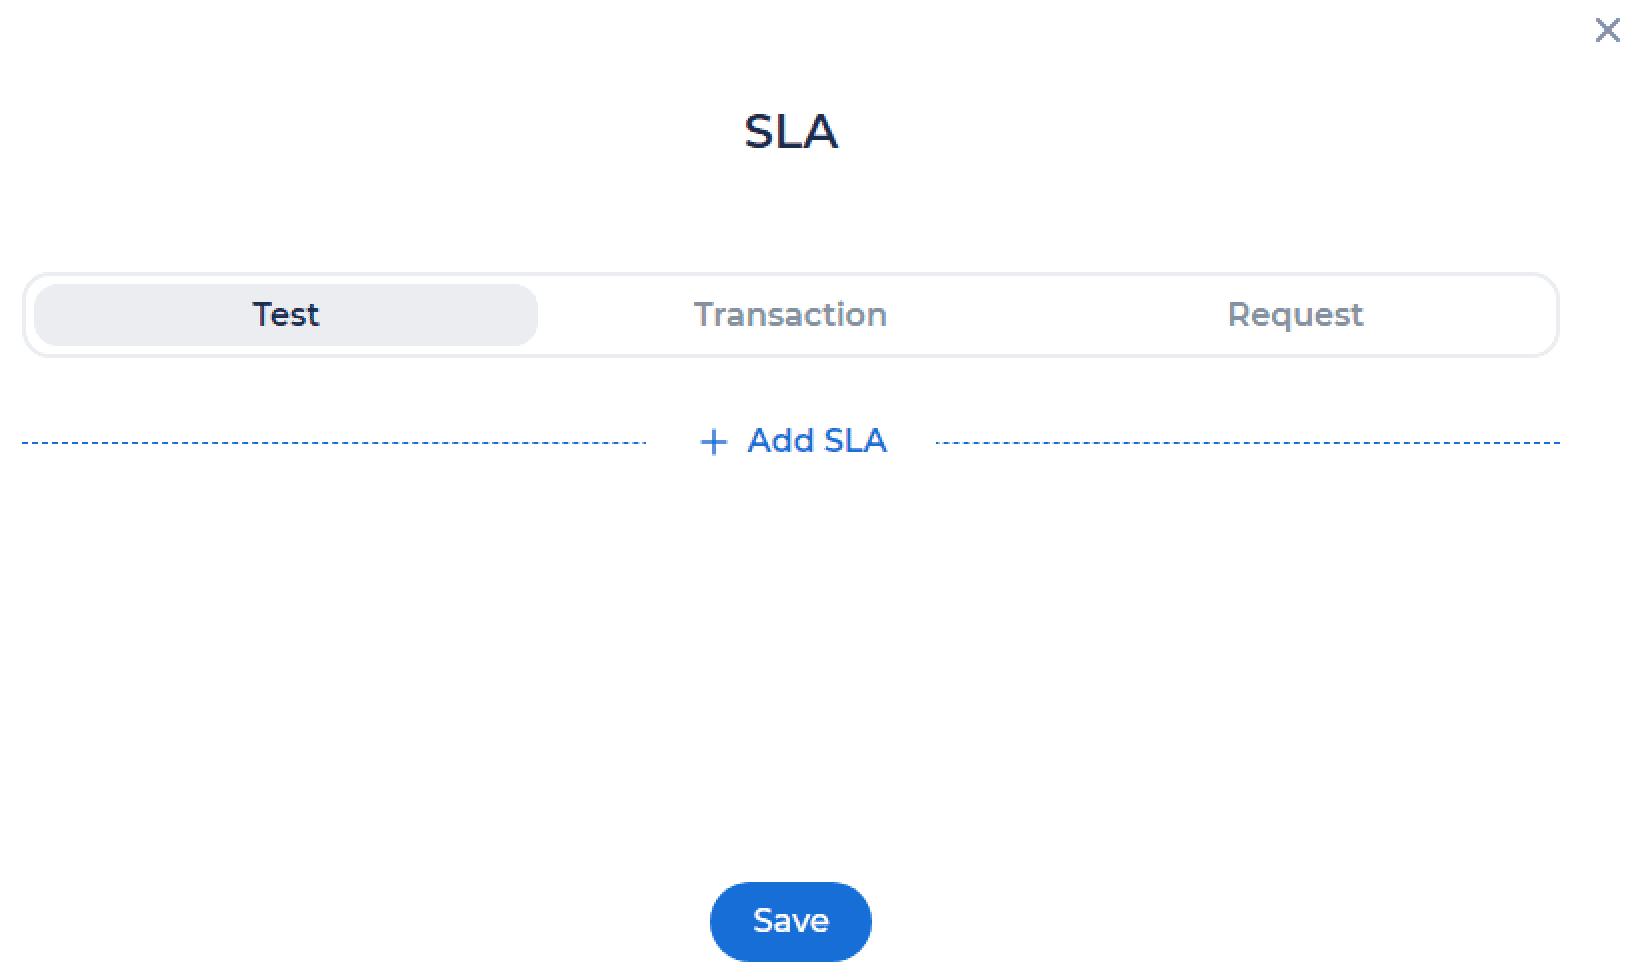
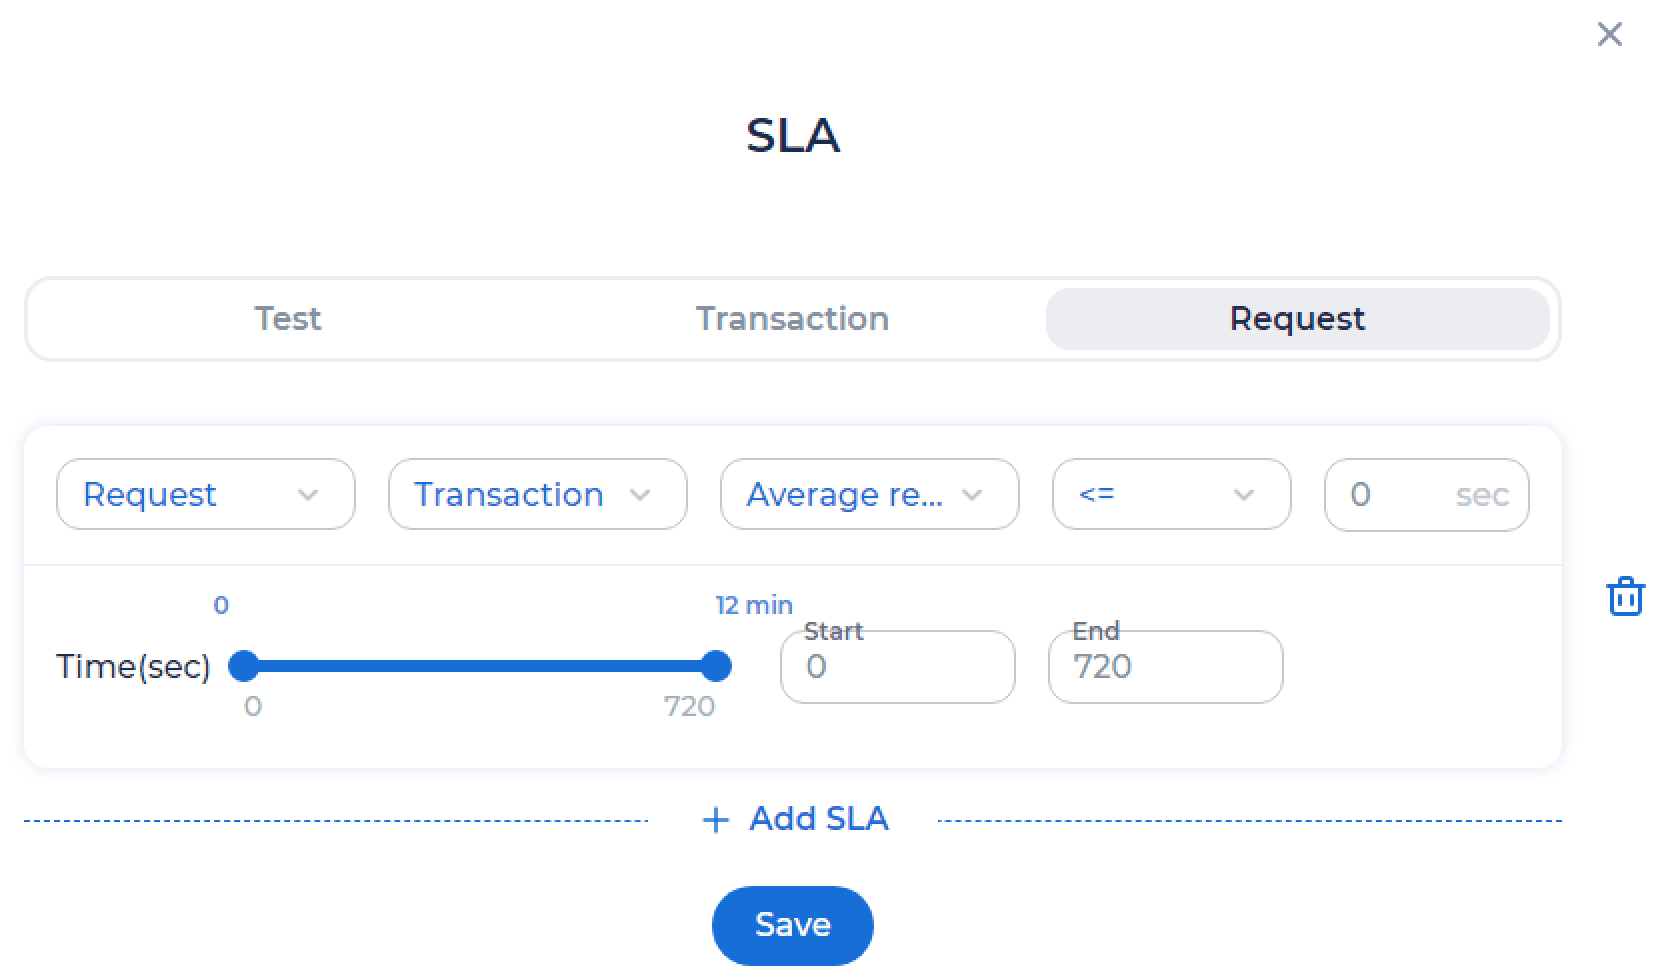
Test scenarios are grouped into projects, and their results can be tracked via different metrics. For each of them, you can set service level agreement (SLA) – specific criteria that are used to evaluate website performance. For example you can set a condition that the error rate must be less than 5%. Just click SLA and set the parameters for transactions, requests, or the whole test.
Here is the list of metrics for which you can set SLAs:
At the end of the test specified SLA will be calculated automatically and can be accessed on the results screen.
Specify Project Parameters
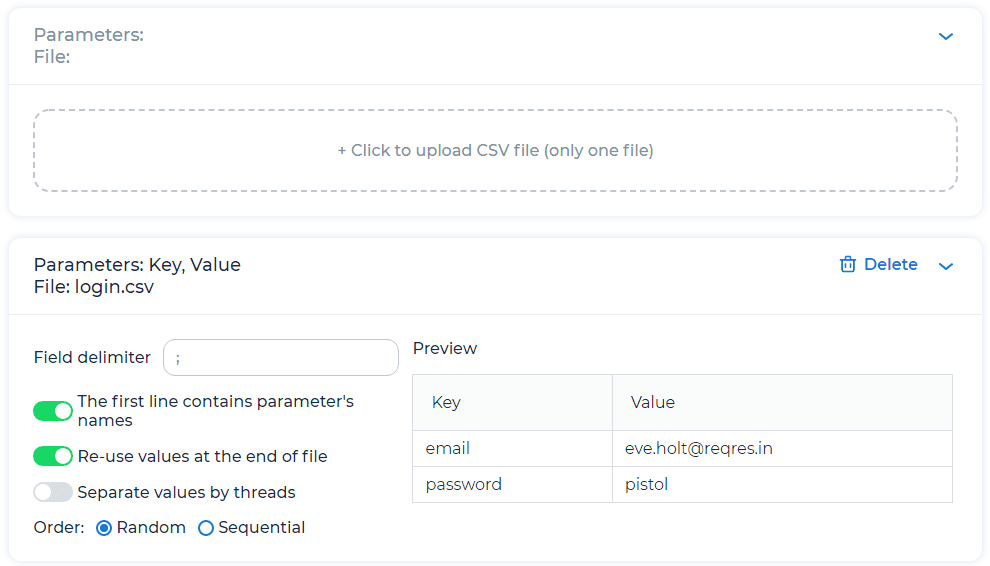
To make the test more relevant, you can add further parameters for the traffic. For example, incorporate a data pool with users’ credentials to load test-secured endpoints. PFLB supports literal parameters and comma-separated values (CSV).
To add a literal parameter:
To add a CSV parameter:
Configure Load Profile
A load profile in performance testing refers to the pattern of usage or traffic that is expected to be generated on a system during normal or peak load periods. It includes such metrics as the number of concurrent users, the frequency and type of user transactions, the duration of user sessions, and expected data volumes. Load profiles are used to design and execute performance tests that simulate real user behavior and workload on the system under test.
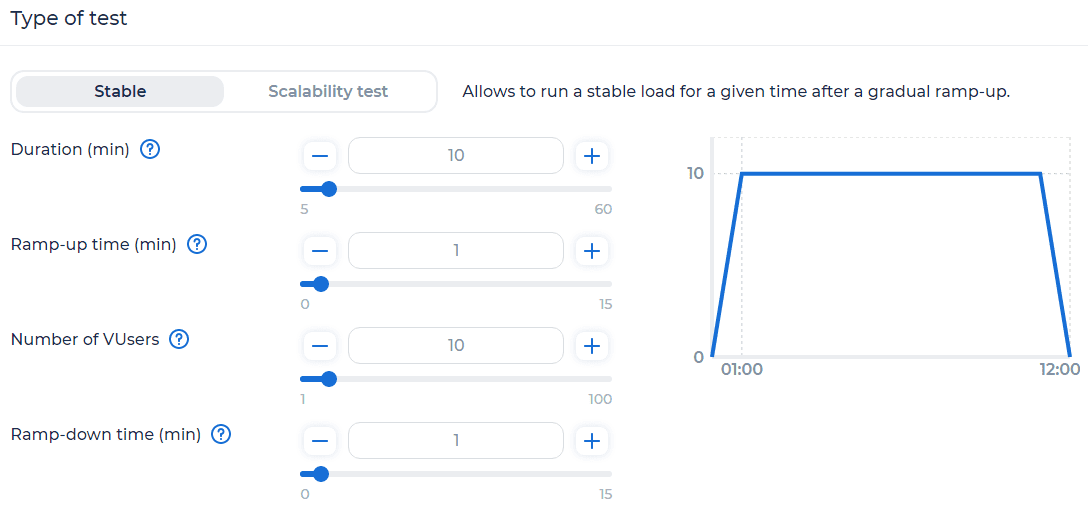
To parameterize this process, choose the Load Profile section in the main test window or set preferable options for each group on the previous tab. Depending on your service plan, you can choose stable or scalable load distribution. The first one is more suited for comparison purposes and the second is to determine maximum system capacity. To configure the load profile, use such metrics as test duration, number of users, time to planned load, and time to zero load.
Running the Test and Analyzing the Results
Now that you have created your test, it is just about time to start the evaluation of your website performance. Tick that you agree with the terms and conditions, click Run test, and wait a moment while load generators will deploy in the cloud.
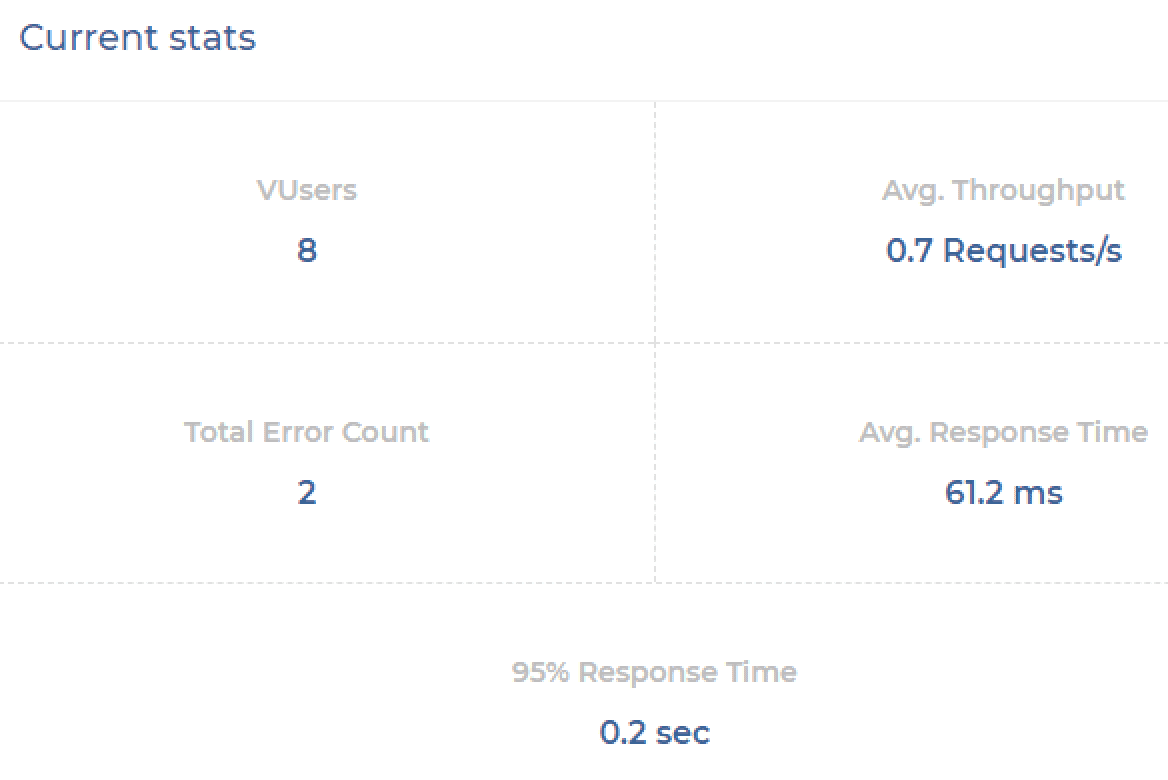
After having started the test, you can follow up on its execution in the Running Tests section situated in the main menu on the left. You will find the data on the site’s number of virtual users, test duration, response time, requests per second, etc.
Grafana Dashboards
Once the testing is done, you can view the test’s progress and results visualized using Grafana, which is integrated into the PFLB. There are three types of dashboards available:
To view the data during test execution, open the Running Test page and click Detailed stats or Detailed system metrics.
If you want to compare tests:
If You Have any Further Questions
In this text, we have only shared the very basics of using PFLB and its main settings. We hope to have given you an idea of how easy it is to start performance testing of your website. However, creating an ideal test designed particularly for your website needs is a creative process that sometimes requires a professional performance testing team or a subtle and wholesome configuration.
Although our platform is user-friendly, it has every necessary function you may need to have full control over the testing process. To learn more about the testing platform and its features, please visit the Documentation section.
Related insights in blog articles
API Endpoint: A Complete Guide
Modern applications rely heavily on APIs (Application Programming Interfaces) to communicate and exchange data across different systems. At the heart of this interaction lies the API endpoint — a fundamental concept that defines where and how data exchanges happen. This guide explains clearly what an API endpoint is, outlines its importance, and provides practical insights […]
gRPC vs. REST: Detailed Comparison

Choosing between gRPC and REST can feel confusing, especially if you’re trying to figure out the best way for your applications to communicate. This article breaks down the grpc vs rest comparison clearly, without jargon or confusion. You’ll learn exactly what each protocol is, the advantages and disadvantages of each, and understand why gRPC is […]
Top 10 Data Masking K2view Alternatives

If you’re exploring alternatives to K2view for data masking, this guide breaks down the top tools worth considering. We’ve compiled the leading solutions that serve a variety of industries — from finance and healthcare to DevOps-heavy SaaS. You’ll find a detailed comparison table of K2View competitors, full tool breakdowns, and a closer look at PFLB […]
How to Generate AI-Powered Load Test Reports with PFLB
Say goodbye to tedious manual reporting after load testing! With PFLB’s innovative AI-powered report generation, performance engineers can quickly turn detailed test data into comprehensive reports. This guide walks you step-by-step through setting up your test, running it, and effortlessly generating exhaustive performance analysis — so you spend less time reporting and more time optimizing. […]
Be the first one to know
We’ll send you a monthly e-mail with all the useful insights that we will have found and analyzed
People love to read
Explore the most popular articles we’ve written so far
- Top 10 Online Load Testing Tools for 2025 May 19, 2025
- Cloud-based Testing: Key Benefits, Features & Types Dec 5, 2024
- Benefits of Performance Testing for Businesses Sep 4, 2024
- Android vs iOS App Performance Testing: What’s the Difference? Dec 9, 2022
- How to Save Money on Performance Testing? Dec 5, 2022
