JMeter is a highly extensible, open-source platform that can help identify performance issues in your application. It is among the most popular tools for performance testing. You can read more about difference between PFLB, LoadRunner and JMeter.
So in JMeter, it is no longer possible to change the intensity, the number of threads and the duration of the test by standard methods after starting the test. However, it happens that the test is already running, but you urgently need to change a parameter (for example, I often forget to indicate the test duration), for which you need to stop the test, set database to the initial state, reboot the cluster, pull the original git commit and so on. Solution: configure and run BeanShell Server. With the help of BeanShell Server one can “play” with the following settings. Let’s illustrate it on the example of intensity change.
Variables
jmeter_loc – the full path to the root jmeter folder
host, port – jmeter’s host and port for the machine, where it is running
bsh_loc – folder, containing bsh-files
new_throughput – new intensity value, op/min
old_throughput – default intensity value, op/min
JMeter configuration and start from the command line
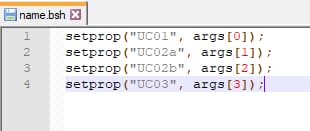
- 1We create the file name.bsh: «setprop(“hits”,args[0]);»
- In jmeter.properties search for: «BeanShell configuration» and comment out the lines «beanshell.server.port=9000» и «beanshell.server.file=../extras/startup.bsh».
- After rebooting jmeter the server start line appears in the command line window:
- Set target JMeter throughput to ${__P(hits, %old_throughput%)}.
- If needed during the test we set the new throughput from the jmeter root folder in cmd to: «java –jar %jmeter_loc%\lib\bshclient.jar %host% %port% %bsh_loc%\name.bsh %new_throughput%».
Explanation
In the line «java –jar %jmeter_loc%\lib\bshclient.jar %host% %port% %bsh_loc%\name.bsh %new_throughput%» we call bshclient and indicate, which host and port are opened to the bsh-server, as well as which bsh-script needs a new parameter.
Example solution for a maximum search test
The project profile consisted of 20+ operation, so changing each intensity change manually is not fun. We wanted to find a maximally scalable and parametrized solution, which would allow us to use it for different projects with a different operation amount and from different loading machines.
Let’s illustrate it on the example of intensity change.
In the end we’ve written a “universal” .bat-file to change intensity,
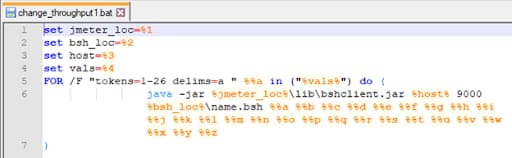
where vals-line contains new intensity values, separated by letter “a”.
name.bsh:
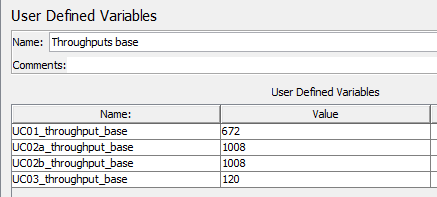
In JMeter load test scenario we add a separate thread group and in it – jsr223-sampler. Constant timer is added to the thread group and the intensity change is fired by it. Base intensity values for each iteration are saved in User Defined Variables.
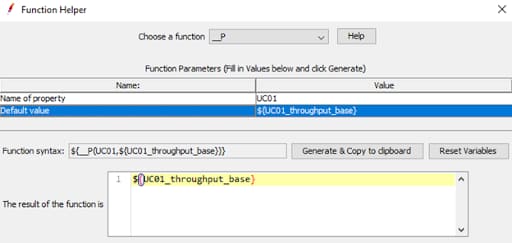
Function Helper explains, how to use intensity values syntax in Target Throughput.
After the .bat-file has been executed, the command line stays open, so we see that the intensity values have successfully been changed.
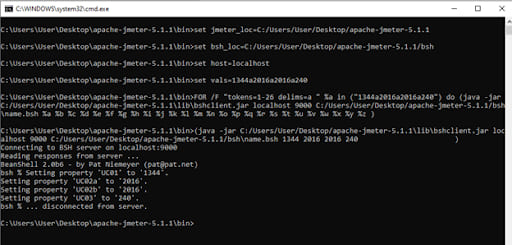
And that the command has looked like that:
java -jar C:/Users/User/Desktop/apache-jmeter-5.1.1\lib\bshclient.jar localhost 9000 C:/Users/User/Desktop/apache-jmeter-5.1.1/bsh\name.bsh 1344 2016 2016 240We observe the intensity change in Transaction per Second:
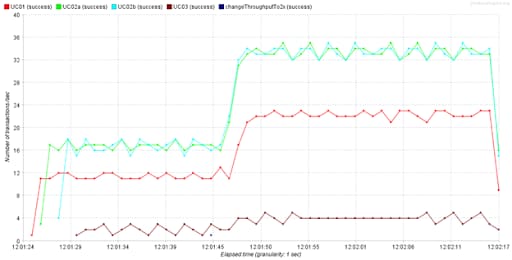
The intensity has been doubled.
Conclusion
Using the described approach, you can increase and reduce intensity, thread amount and test duration, which saves time and helps to choose the optimal load options.