Nowadays, almost every company has its mobile app, which provides millions of customers with products and services for all kinds of requests. Just think of it: developers upload thousands of new applications and mobile games daily to Google Play and the App Store. To engage and retain users, you should have brand new ideas and a great code and design and be sure of high system performance.
Your application’s quality, reliability, and speed must be the best in this highly competitive market. The most reliable way to identify opportunities and potentials of your product is mobile app performance testing. This process often involves system performance analysis to ensure your application meets user demands under various conditions. In this blog post, we will look at how to write a load script for a mobile application and run a performance test by generating HTTP/HTTPS traffic on the app server using JMeter.
Key Takeaways:
How JMeter Сan Be Used For Mobile App Performance Testing?
Apache JMeter is a versatile and powerful tool for performance testing, making it an excellent choice for mobile app testing. While there are many best tools for performance testing available in the market, JMeter stands out due to its evolution from web applications to support a wide range of applications, including mobile. Its ability to simulate real-world traffic and measure performance under varying loads makes it a go-to solution for ensuring your mobile app can handle user demands effectively. During mobile app load testing using JMeter, you can simulate thousands of users interacting with your app simultaneously, ensuring it performs flawlessly under stress.
Here’s how JMeter can help you with mobile app performance testing:
1. Choose Operations and Create a Load Profile
The first step in approaching mobile app performance testing using JMeter is to understand what type of operations should be performed and with which frequency, that is, to create a load profile. This process often involves analyzing the most loaded month, selecting the peak day, and identifying the most intensive operations, ensuring they constitute more than 80% of the total load. By focusing on these key metrics, you can build a robust JMeter mobile app testing strategy tailored to your application’s needs.
The choice of procedures and their intensity is made by analyzing the statistics for the most loaded month, selecting the peak day of that month by the number of interactions, and choosing the peak hour of that day. Pick the most intensive operations from the list for this hour. They should constitute more than 80% of the total load.
The profile should also include the most resource-intensive operations and those important for your business. It is worth considering possible time limits for those interactions, too. If you do not have suitable statistics, e.g., because your app is new, the profile is created based on your market analysis and forecasts.
2. Prepare a Real Device or Install Emulator
Now, it is time to decide whether to use a real smartphone or a mobile operating system emulator to write a script. The latter is much cheaper because you do not need to buy a collection of different devices from multiple vendors. On the other hand, if your app is supposed to interact with a microphone or a GPS module, you probably will not be able to test it without appropriate hardware.
In this post, we are using the MEmu Android emulator. We have also tried it with a real mobile device based on Android 10, and there is no difference other than some visuals.
3. Configure the Connection to the Network
For further work, it will be necessary to connect the desktop and a real or virtual device to the same local network. In the case of the Android OS emulator, everything is simple because it is installed on your PC and, therefore, connected to the same network.
For a real mobile device, you have to manually configure a connection with a desktop over a local network, which is very easy to do. All you need is to connect a mobile device and a PC to one router via Wi-Fi or, in the case of a computer, LAN.
4. Create a Script in JMeter and Configure an HTTP Proxy Server on Your PC
For the script, you will need to install Apache JMeter. This is a popular tool for load testing, but if you have not worked with this program yet, it is not a problem. First, you must install the Java Development Kit (JDK) on your PC; otherwise, the app won’t start.
When JDK is installed, you should download the archive with the program from one of the mirrors listed on the official Apache website and unpack it on your desktop. Then, you should run the file jmeter.bat in the bin folder. After the start, a graphical user interface will pop up. You will use it to work on your test plan.
Now you can start creating your script using JMeter:
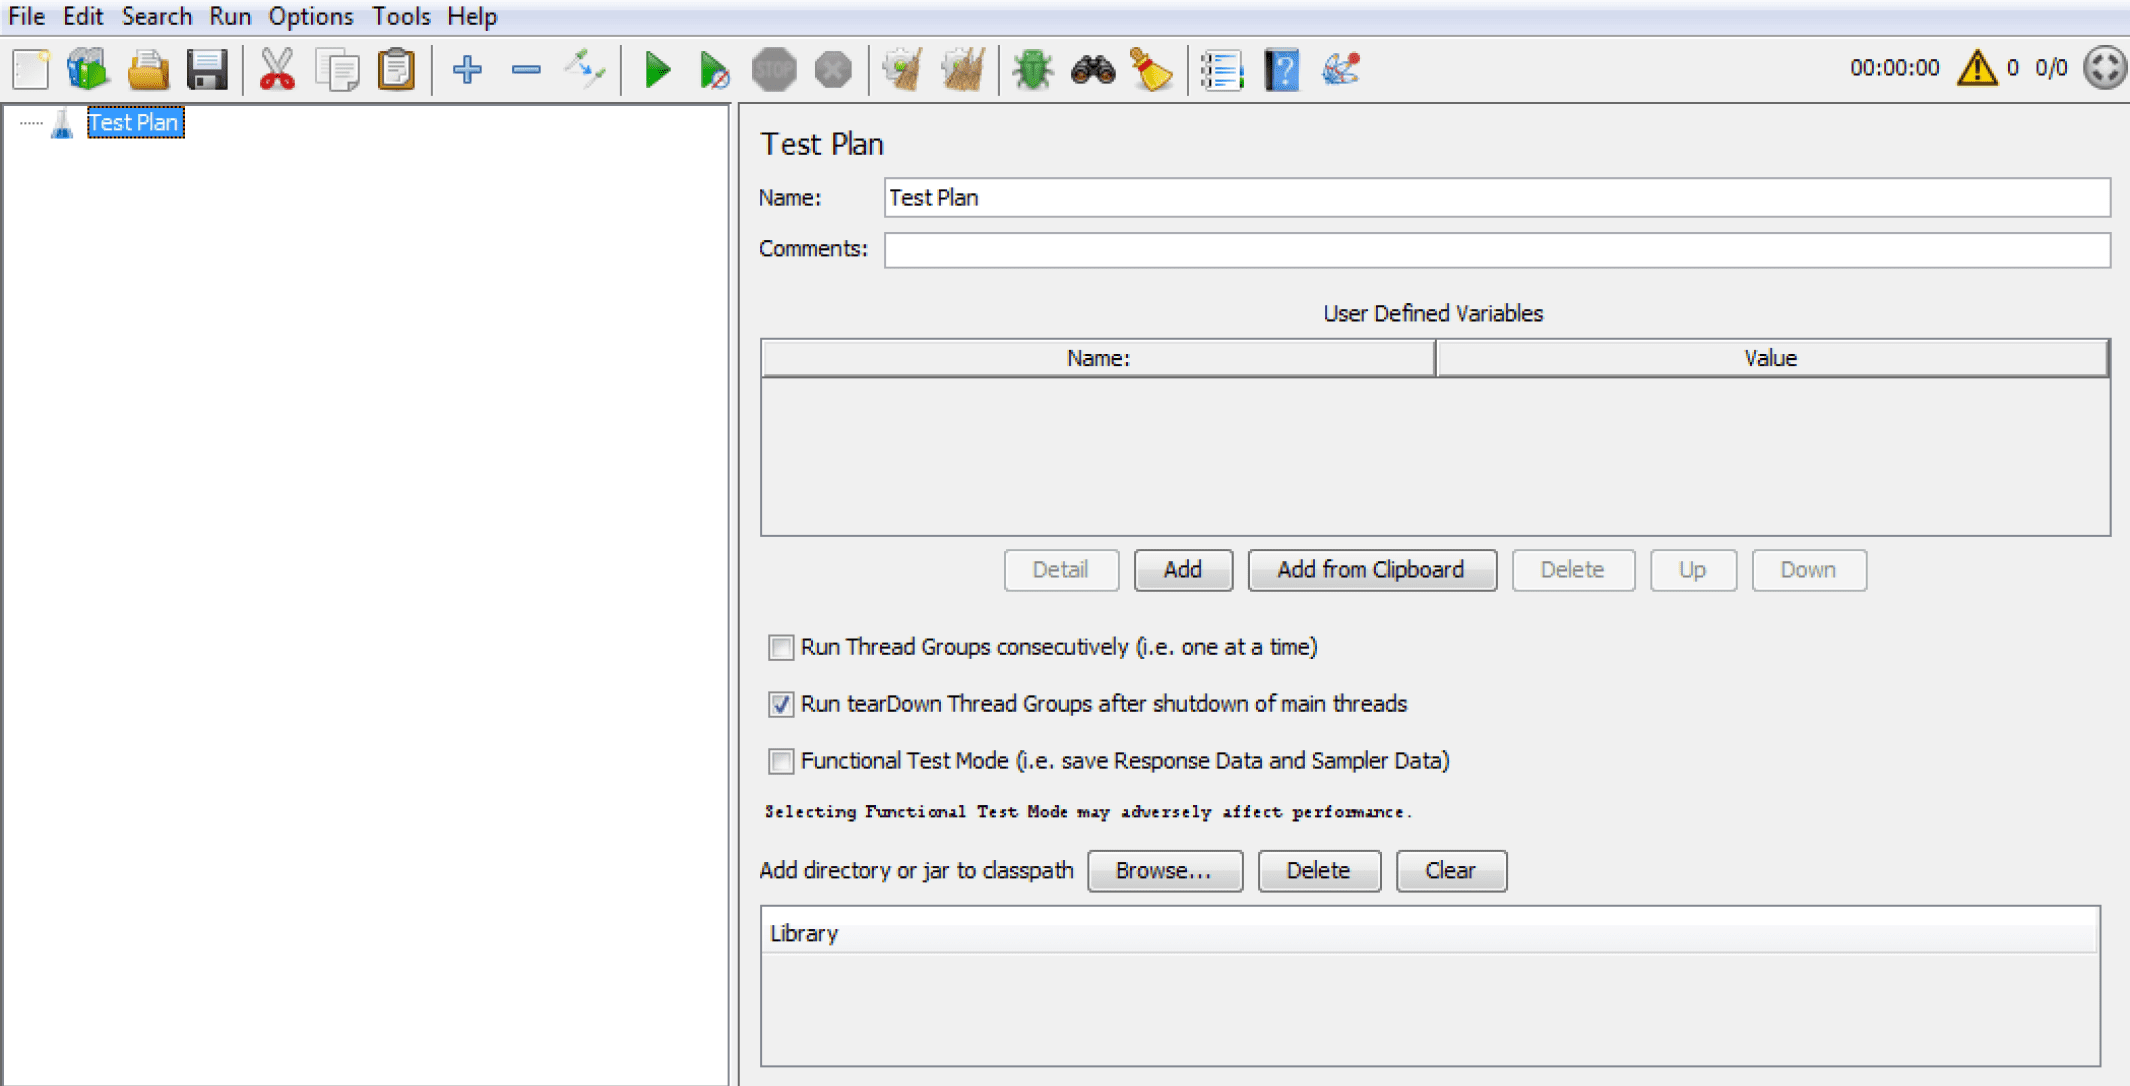
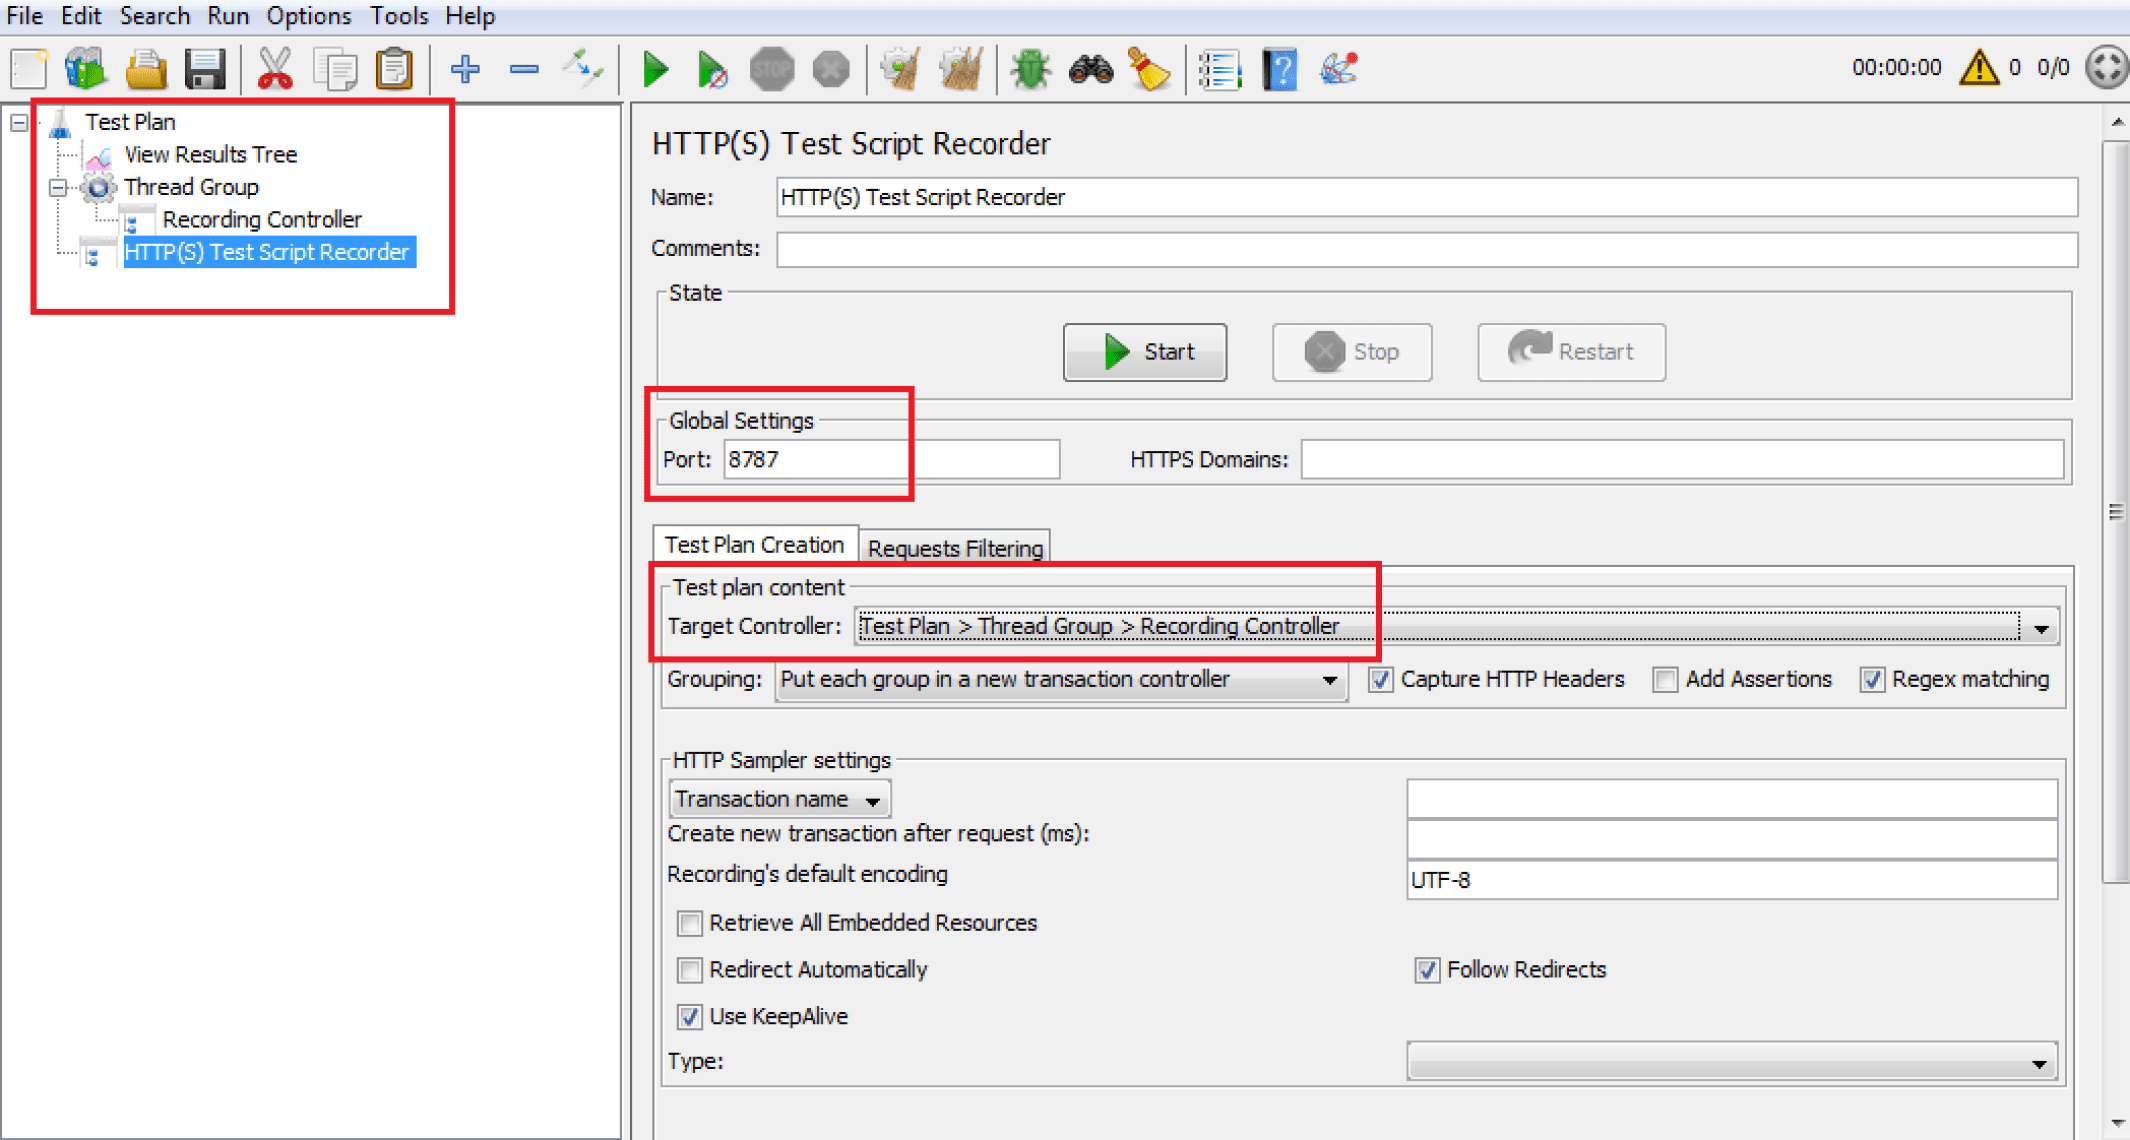
1. Add the main element to your Test Plan. Right-click Test Plan —> Add —> Threads (Users) —> Thread Group. This thread group can consist of one or more scripts, each performing a specific task for your virtual users. Before starting the test, all Threads (Users) elements must be configured for load delivery. Remember that each script needs a separate “spool” of threads, as the intensity of these scripts can be different.
2. Add Listener. Right-click Test Plan —> Add —> Listener —> View Results Tree. This adds an element to view future queries and responses, which is useful when debugging the script.
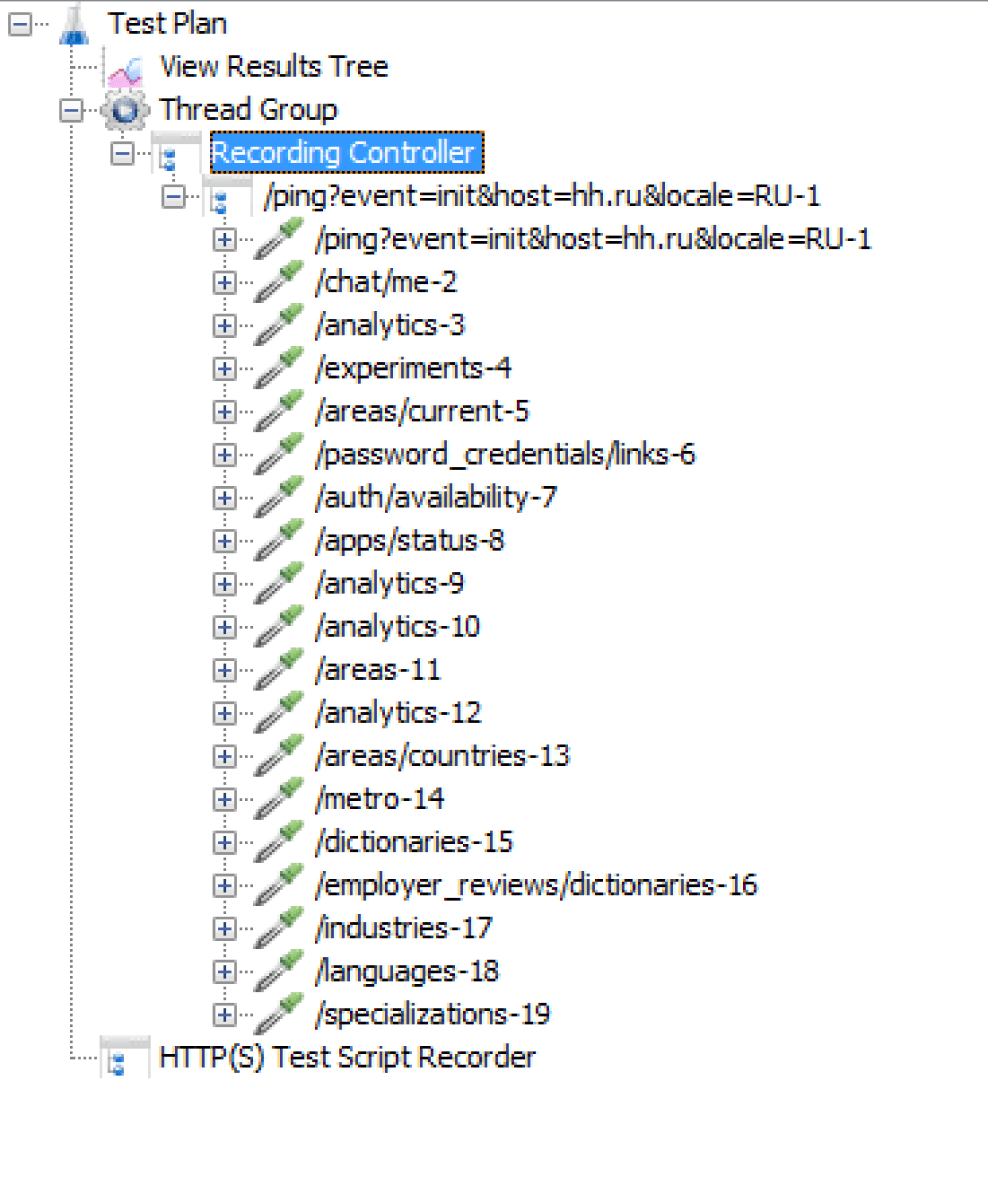
3. Add Recording Controller. Right-click on Thread Group —> Add —> Logic Controller —> Recording Controller to add an element inside your coil that allows you to automatically group the script on transaction writing. This is quite convenient for a lot of actions.
4. Add Test Script Recorder. Right-click on Test Plan —> Add —> Non-Test Elements —> HTTP(S) Test Script Recorder to add an element to record the script. Pay attention to the connection port: ensure it matches the port you specify in your mobile device or emulator settings.
Do not forget to choose Test Plan > Thread Group > Recording Controller in the Target Controller field. This option indicates where the script will be recorded to.
Then, you should click the Start button, and JMeter will create the certificate you need for the next step. Confirm the creation of the Root certificate in the pop-up window, or wait until it disappears and stop the recording.
The created certificate will be valid for seven days. If you need to renew it in the future, you can click the Start button again.
5. Copy and Install the Certificate on Your Mobile Device
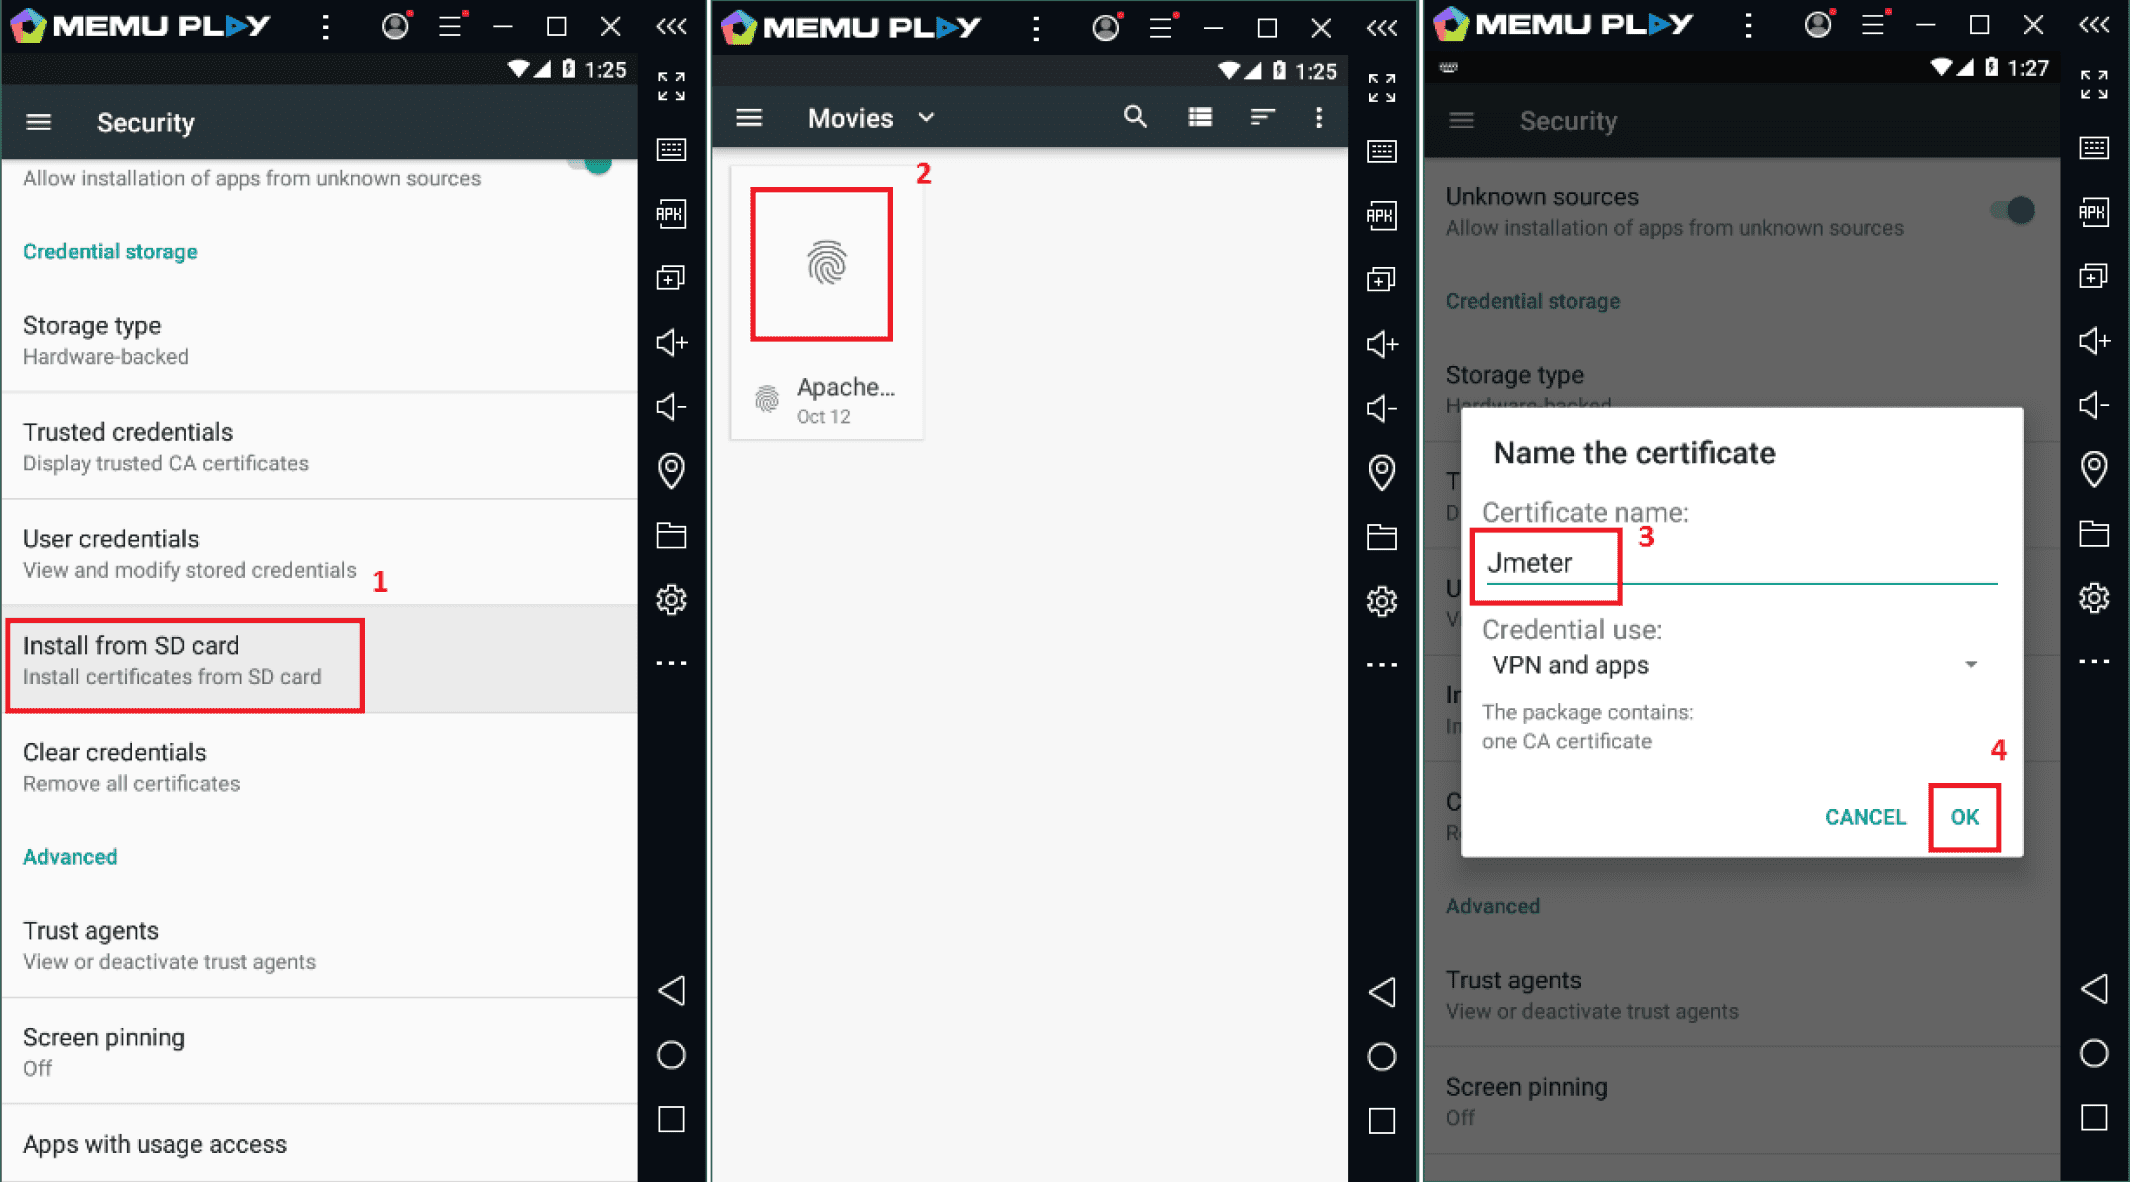
The next task is copying and installing the Apache JMeter certificate on a smartphone or emulator. You will find the certificate in the JMeter installation directory bin folder. The file you are looking for is called ApacheJMeterTemporaryRootCA.crt.
Transferring it from your desktop to a real device is not a big deal, but copying a file to an emulator may look tricky. Take MEmu as an example. Click the icon of a folder on the right of the toolbar and open the shared folder screen. Each folder has a Windows icon, which opens a folder on your PC, and an Android icon, which opens an appropriate directory on the emulator. You can copy the certificate to any of these four folders on your PC and then find it on the emulator by clicking on the relevant Android icon.
To install a copied certificate on a mobile device, it is sometimes not enough just to run it via the certificate installer. Even if the system reports that the certificate has been successfully installed it is not. Therefore, you need to go to the settings and do the following:
6. Download and Install the App on Your Mobile Device
It’s time to download and install the mobile application you want to test using JMeter. Since everyone knows how to do this on a real device, let’s look at the emulator.
There are two ways to install the app in MEmu. First, you can click the APK icon on the right side of the toolbar. This opens Windows File Explorer, where you can find and run your application package. Another option is to download it directly from Google Play, which also works in the emulator.
It is worth noting that if you want to download some client-server application and try to write a script, you cannot do it seamlessly. The reason is that, nowadays, to protect the application from incorrect data, hacking, data theft, etc., developers add many checks into the code and implement SSL certificates. These security measures are essential components of comprehensive application testing, and understanding web app security testing explained can help you better navigate these challenges. So, you cannot get a response from the server via proxy. Of course, it is possible to bypass it with the help of special utilities, but if you are a part of the team working on the project, you’d better ask developers to solve this problem.
7. Configure Proxy on Your Mobile Android or iOS Device
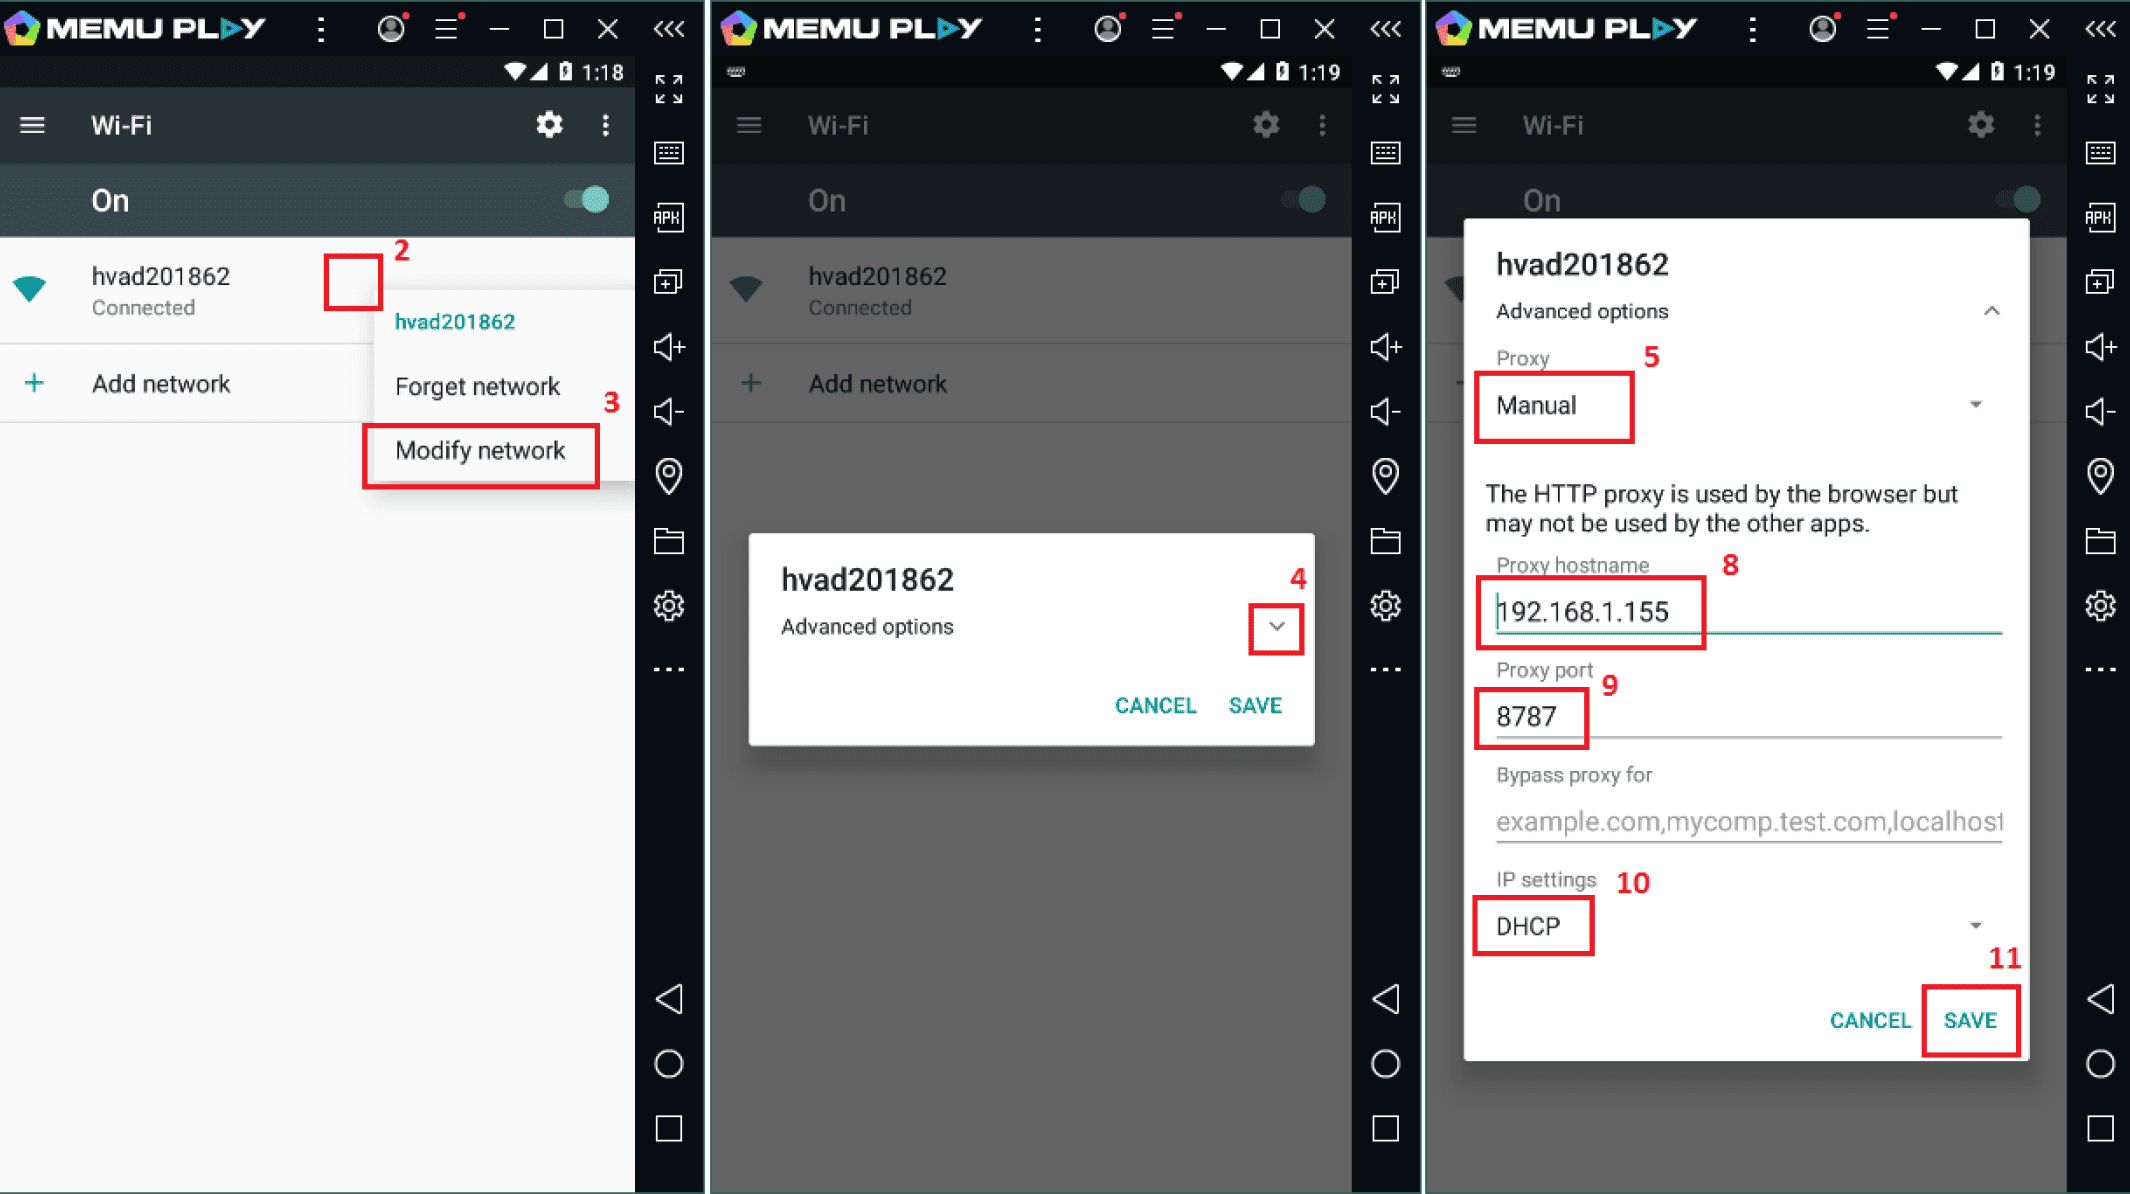
The next step is proxy configuration. To analyze scripts, you need to intercept mobile traffic and transfer it over a certain LAN port to Apache JMeter. You have already configured the proxy server on your desktop, and now you will have to do the same on your emulator.
8. Record the Mobile App Performance Testing Script Using JMeter
Now, you can start recording the script. Click Start in JMeter and run the application in the emulator or smartphone. If everything is set up correctly, the recording controller will add a transaction in which multiple requests will be grouped. Each next action in the application will add a transaction with its queries until you finish the record by clicking the Stop button.
All Test Plan elements can be moved or commented, also you can hide or show the contents of each element, copy and paste, or delete them. It is also possible to copy a script to another scenario by opening two windows of the tool, which is useful when designing a large project. If you want to save a recorded script and continue your work later, click File —> Save Test Plan As.
9. Disable Proxy on Your Mobile Device
When recording is on, the traffic is sent to Apache JMeter, but after the script is recorded, you will not have access to the Internet via Wi-Fi. To restore the connection, disable the proxy server on your test smartphone.
If you are recording a lot of scripts using a real device, you can switch from Wi-Fi to cellular data and back. The proxy settings on the wireless network do not reset, so you can quickly start writing another script.
10. Process the Script and Start the Load Testing
This stage is not different from the processing of a regular script. After parameterizing, correlating, and adding test data, a debugging test (one iteration with one virtual user) is run to check for errors. You can see the results of the script debugging by selecting the View Results Tree element from the script tree. You may want to insert delays between actions to get as close as possible to the real conditions.
Use the Ultimate Thread Group or the Stepping Thread Group to smooth the load. You will find these in Test Plan —> Add —> Threads (Users). If an element you need is missing, you can add it using Options —> Plugins Manager.
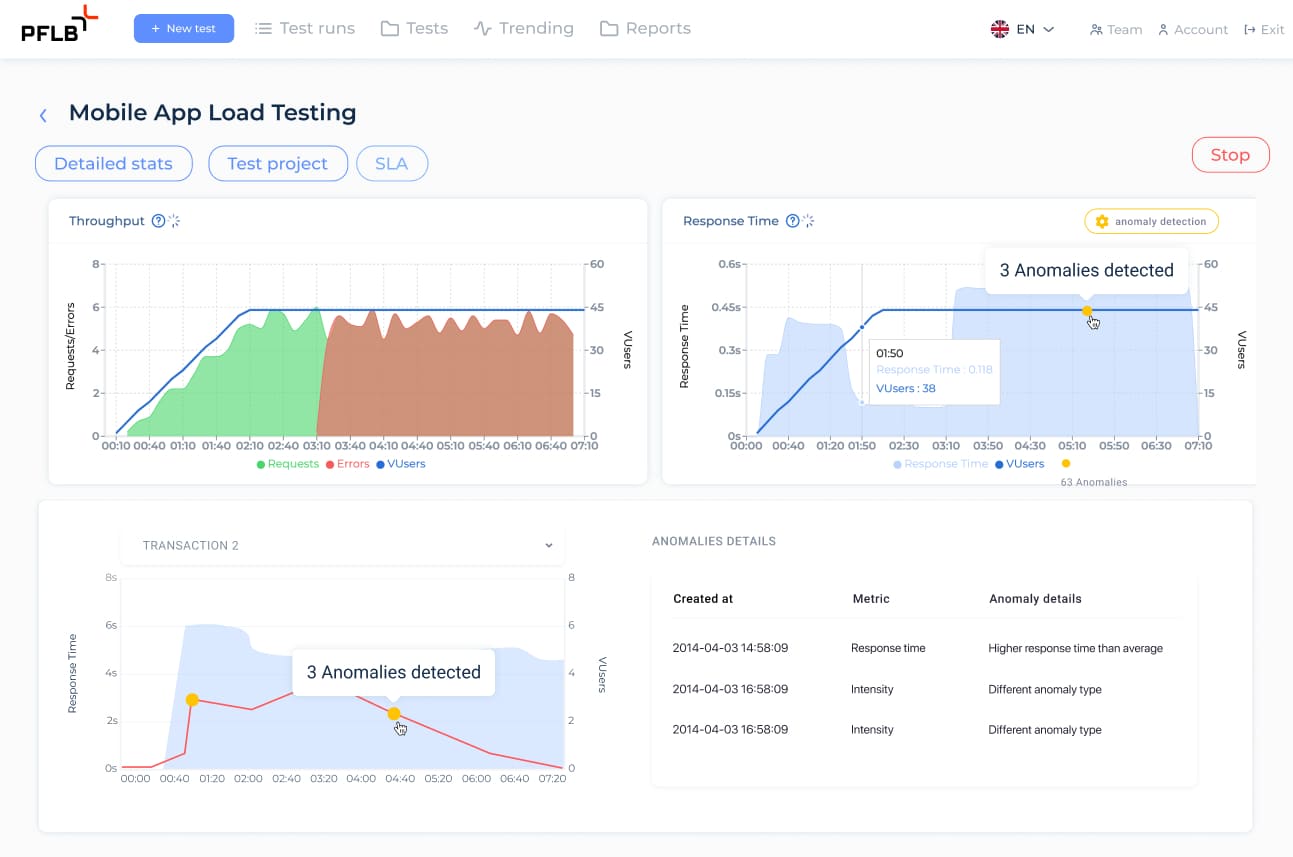
It is also necessary to calculate the pacing of each operation, the number of virtual users used, and the number and duration of load stages. An important step is to add monitoring elements through Test Plan —> Add —> Listener, such as Transactions per Second, Active Threads Over Time, Hits per Second, Aggregate Report, etc.
These tools will help you collect data for further analysis. After all these actions, you can start the test.
How to Design Load Test Plans using JMeter
When it comes to ensuring your mobile app performs under pressure, designing a solid load test plan is like laying the foundation for a sturdy house. You can’t skip it if you want lasting results. With JMeter, you have the tools to mimic real-world usage and uncover performance hiccups before they impact your users.
But where do you begin?
Let’s walk through the steps to build a test plan that’s as effective as it is insightful.
Identify Test Scenarios
Start by outlining the key scenarios you want to test. Consider actions that users are likely to perform on your app:
By focusing on realistic user activities, you ensure the test plan reflects real-world usage patterns.
Define User Behavior Profiles
Different users interact with your app in varied ways. Create profiles to represent typical user behaviors:
Defining these profiles helps you test how your app handles diverse user loads.
Configure Thread Groups
Thread Groups in JMeter define the number of virtual users, their behavior, and the load they generate. Here’s how to set them up:
This configuration ensures your test mirrors actual traffic patterns.
Add Logic Controllers
Logic Controllers in JMeter allow you to customize the flow of requests:
Use these controllers to create complex and realistic test scenarios.
Incorporate Realistic Data
To simulate real-world usage, use parameterized data:
This step makes sure your test doesn’t repeatedly send the same inputs, making it more authentic.
Integrate Assertions
Assertions validate the responses your app returns during testing:
Assertions help you measure whether your app behaves as expected under load.
Monitor Test Results
Finally, add Listeners to track and analyze the test outcomes:
Choosing the Right Load Testing Infrastructure
When it comes to running JMeter tests for mobile app performance, choosing the right infrastructure is just as important as creating effective test plans. The infrastructure determines how efficiently you can simulate large-scale loads, run distributed tests, and analyze performance metrics.
Testers typically have three main options for load testing infrastructure:
| Feature | Local Computers | Cloud Resources | PFLB |
| Setup and Configuration | Manual setup, time-consuming | Requires cloud environment setup and expertise | Preconfigured, ready to use from day one |
| Scalability | Limited by local resources, unsuitable for large-scale loads | Good scalability, depends on configuration | Highly scalable, supports massive loads effortlessly |
| Distributed Testing | Complex, requires significant configuration | Requires manual setup and expertise for multi-node testing | Fully supported with distributed testing out of the box |
| Maintenance | High, requires constant monitoring and adjustments | Medium, ongoing management required | Low, minimal effort required from testers |
| Cost Management | Low initial cost, but resource limitations may incur hidden costs | High, costs can escalate without proper monitoring | Transparent and optimized for cost efficiency |
| Advanced Analytics | Not available | Depends on third-party tools | AI-powered, provides actionable insights |
| Ease of Use | Low, requires expertise in setup and management | Medium, depends on familiarity with cloud environments | High, designed for ease and efficiency |
1. Local computers
Some teams opt to run JMeter tests on their local machines. While this can work for small-scale tests, it comes with several challenges:
2. Cloud resources
Another option is to set up your own load testing environment in the cloud. While cloud resources can scale better than local machines, this approach also has its downsides:
3. PFLB: specialized cloud load testing infrastructure
For teams looking to avoid the headaches of setup and maintenance, PFLB is in the top of the best load testing tools.
PFLB’s load testing infrastructure offers a fully preconfigured best jmeter cloud service that’s ready to use from day one.
Here’s why PFLB is the smarter choice:
With PFLB, you get the benefits of cloud testing without the hassle of managing the infrastructure. It’s designed for testers who need reliable, scalable, and efficient solutions for their load testing needs.
Conclusion
By now, you should have a solid understanding of how to configure mobile application traffic reading, record scripts, and run mobile performance testing using Jmeter. Remember, performance testing is an iterative process, so don’t hesitate to run multiple tests based on your objectives. Besides, tools like PFLB’s cloud-based platform can make the process even more seamless and efficient.
If you encounter challenges or need expert guidance, don’t hesitate to reach out—we’re here to help you ensure your mobile app delivers the performance your users expect.

