Similar Android apps can be designed in very different ways. Depending on the approach taken, seemingly identical apps consume different amounts of smartphone resources. Applications working under Android OS can consume different amounts of memory or CPU time. They can affect the battery life in different ways, or download more or less data over the network. Overall, all of these parameters affect the look and feel and performance of your android app. This is what distinguishes a high-quality app from an average one.
There are about 3.5 mln apps in Google Play Store. Users have options, and you need them to choose your app. To avoid the nightmare of every product owner, namely, the situation in which the user uninstalls your app for Android OS, performance testing services is crucial. It should be started when designing the application, continued when writing the code, and ran before every new release. For those new to this area, understanding performance testing for mobile apps is essential before diving into platform-specific techniques.
Effective load testing tools can help identify how your app behaves under various user loads, preventing potential crashes during peak usage. Some of the ways to do performance testing of Android apps are built in the OS, while others are available on the web. In this article, we list both types for your developers to be able to test the app every now and then.
Key Takeaways
1. Application Profiler in Android Studio
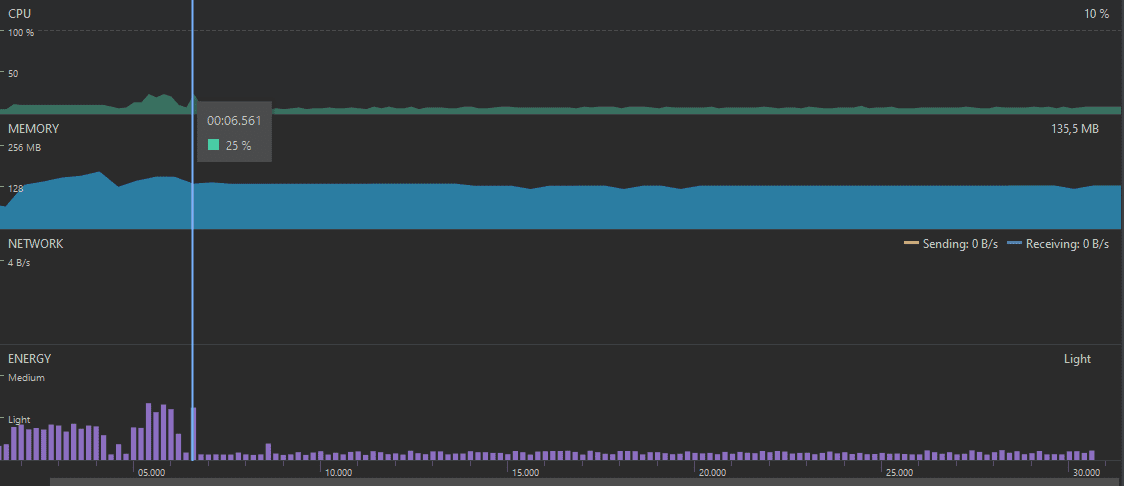
The profiler built into Android Studio allows you to track all the main performance metrics of your application, such as memory, CPU, network usage, and energy consumption.
Please note that if you have obfuscated your application, profiling it will become more complicated.
2. Monitoring CPU Usage
Does the app freeze when switching between screens? Or does it just take a long time to respond when you press the button? If so, your processor is probably overloaded at the moment.
To understand what exactly slows down the app, just a few steps is enough:
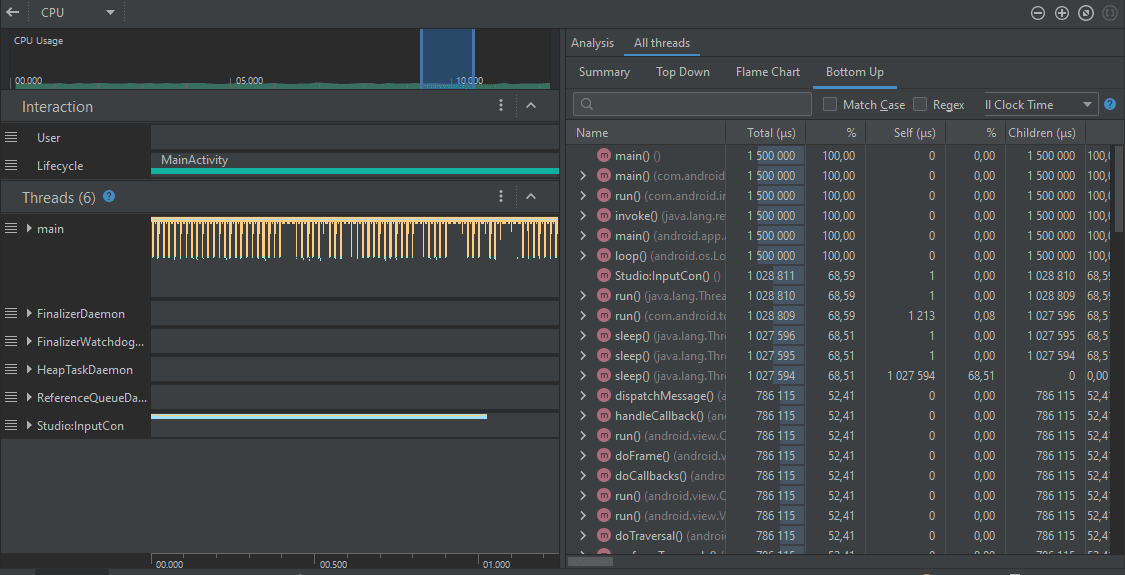
Android Studio will show you which methods were executed for how long. This way, you will be able to find the bottlenecks of your application.
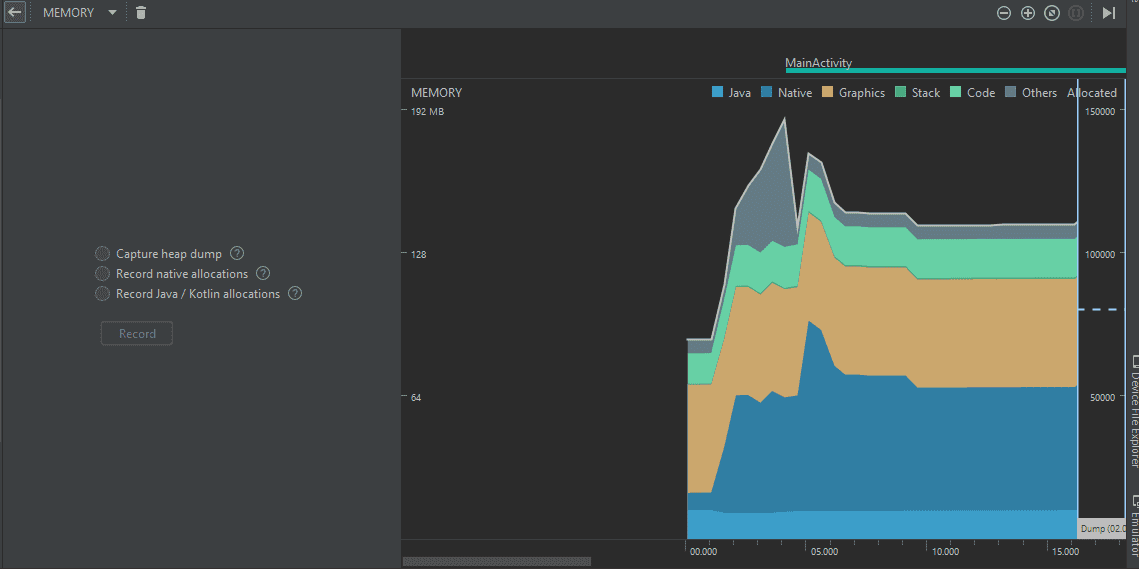
3. Looking for Memory Leaks in the Application
In Android Studio Profiler, you can notice that when using the application actively, the Memory graph can sometimes be constantly growing.
This may mean a memory leak in your app. Android Studio allows you to take a look at which objects were created when the app was running. Thus, by repeating the actions that have led to a memory leak, you can find out which type of objects affects performance.
Memory leaks in Android < 8.0
In devices running Android OS versions lower than 8.0, you need to launch the Allocation Tracker. It also has data visualization tools to help you identify the worst culprits that are allocating the most memory. First, you need to collect a data set to view.
You will be shown which objects have already been created.
Memory leaks in Android >= 8.0
If you are using a device with Android 8+ on board, the process is almost the same as described above, but the allocation tracker is always enabled by default. Just select the area on the graph that you want to explore and you will see the objects created in this interval.
Leak Canary
Leak Canary is a memory leak detection library that is embedded in your application. At the debugging stage, it automatically starts the monitoring in order to ensure that activities and fragments do not leak memory. In Android OS, context leakage is one of the most unpleasant.
4. Monitoring Data Usage over the Network
Is your Android app actively communicating with the backend? You can use the built-in Android studio profiler. Does it seem that at some point the application is using the network too often? Log access to the network and see where your application goes.
Also, do not forget not only about performance, but also about users and UX. For example, when the connection disappears, it would be good to tell your user about it.
5. Android Testing Tools
Even if the application works perfectly on your device, there is no guarantee that the same thing will happen to the user. There are a number of solutions that allow you to monitor the performance of Android applications for end users:
For basic purposes, a solution from Firebase is suitable: it is free, and most probably Firebase is already connected to your project. Additionally, for those needing to simulate app performance across different devices, using the best emulators for load testing can be a crucial step in ensuring your app performs optimally in various environments.
6. Testing UI Performance
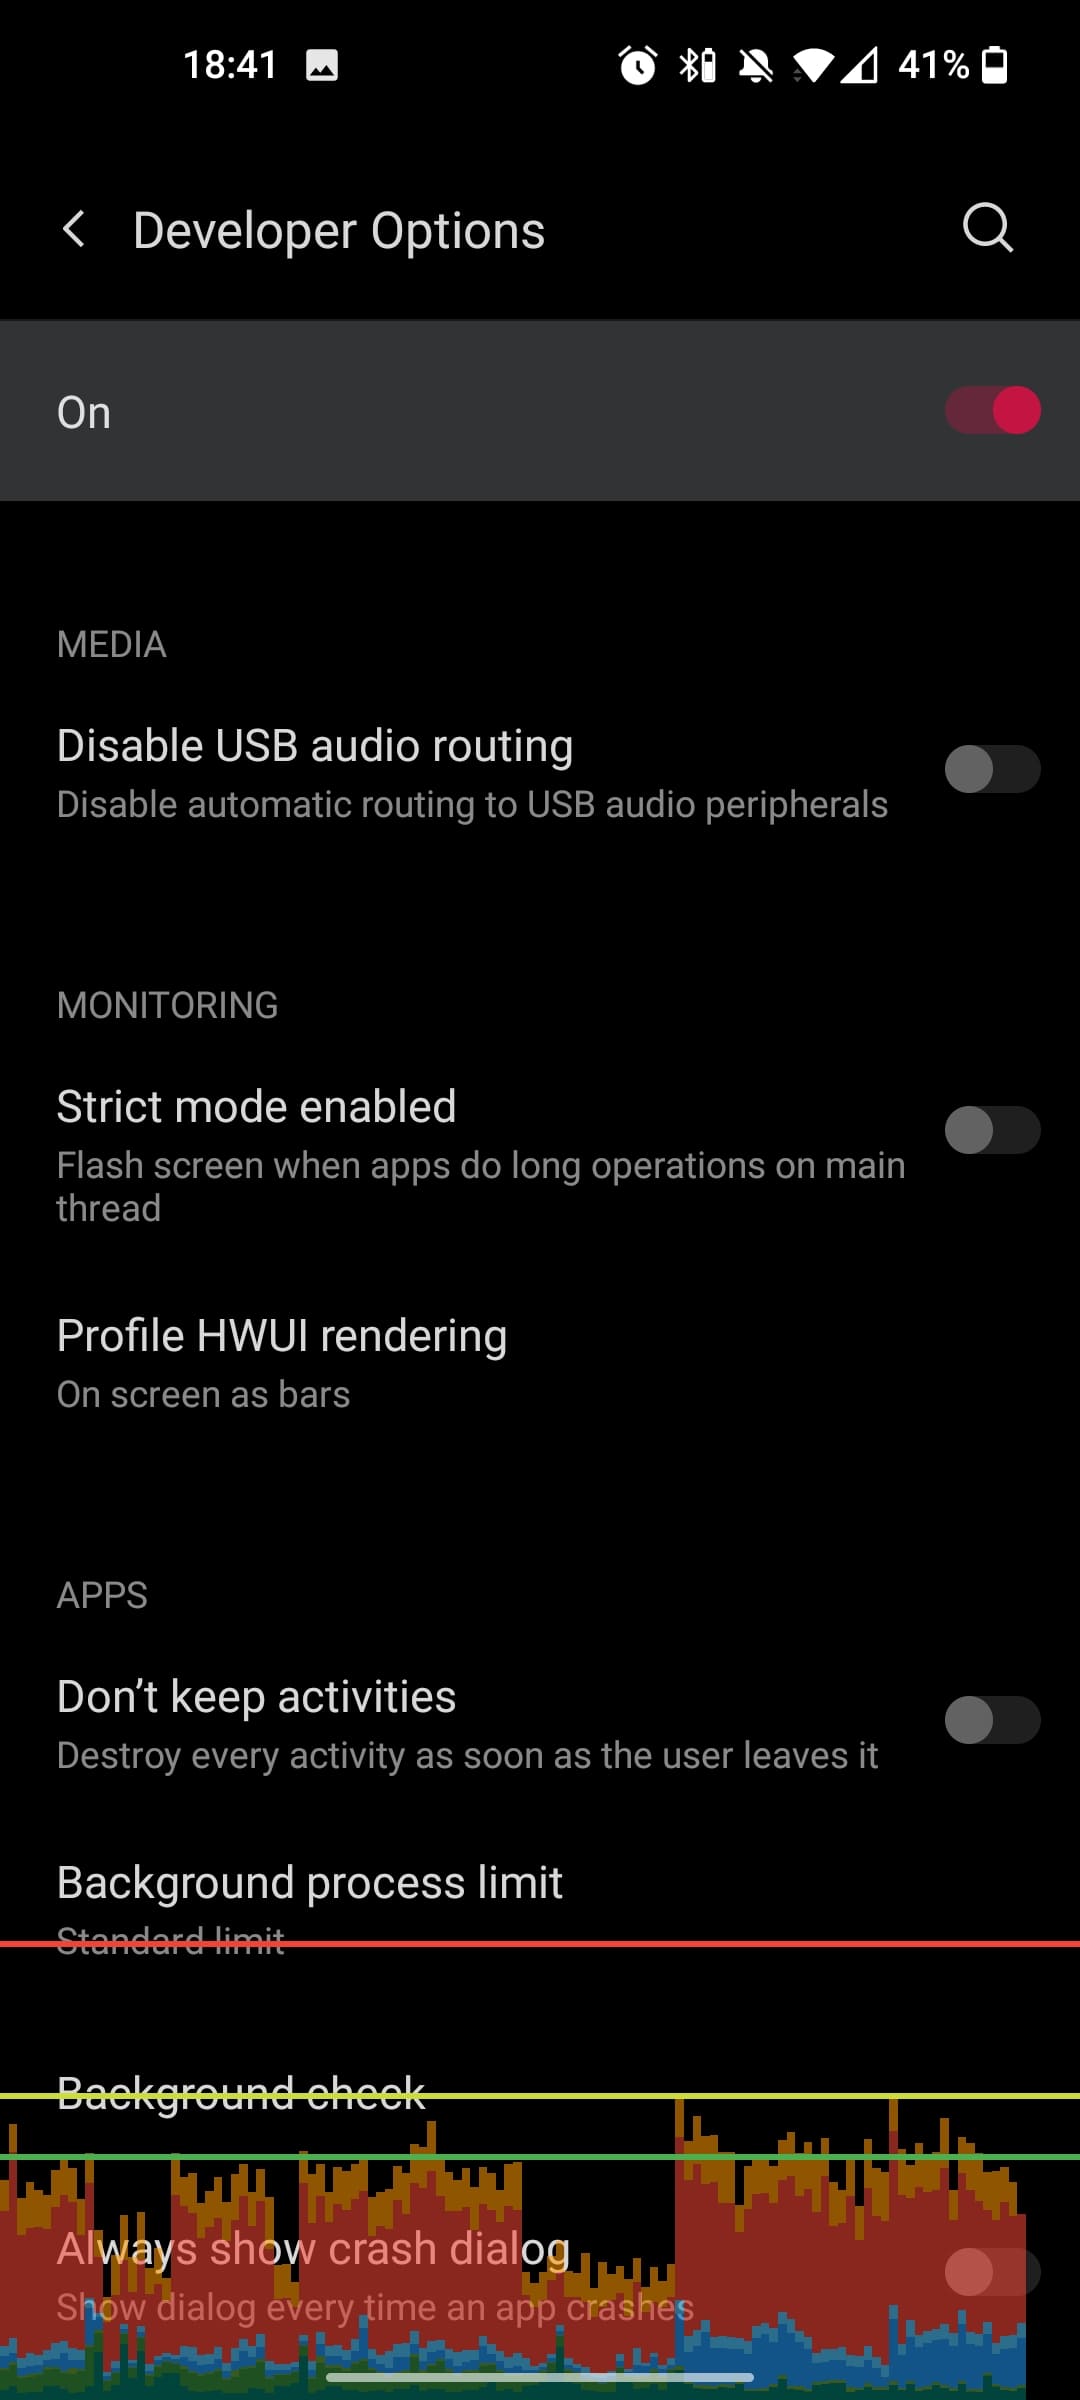
Profiling GPU rendering
There is a baseline for the rendering of the contents of your screen: 16 ms per 1 frame. About this much is needed so that the total frame rate reaches a comfortable speed of 60 fps.
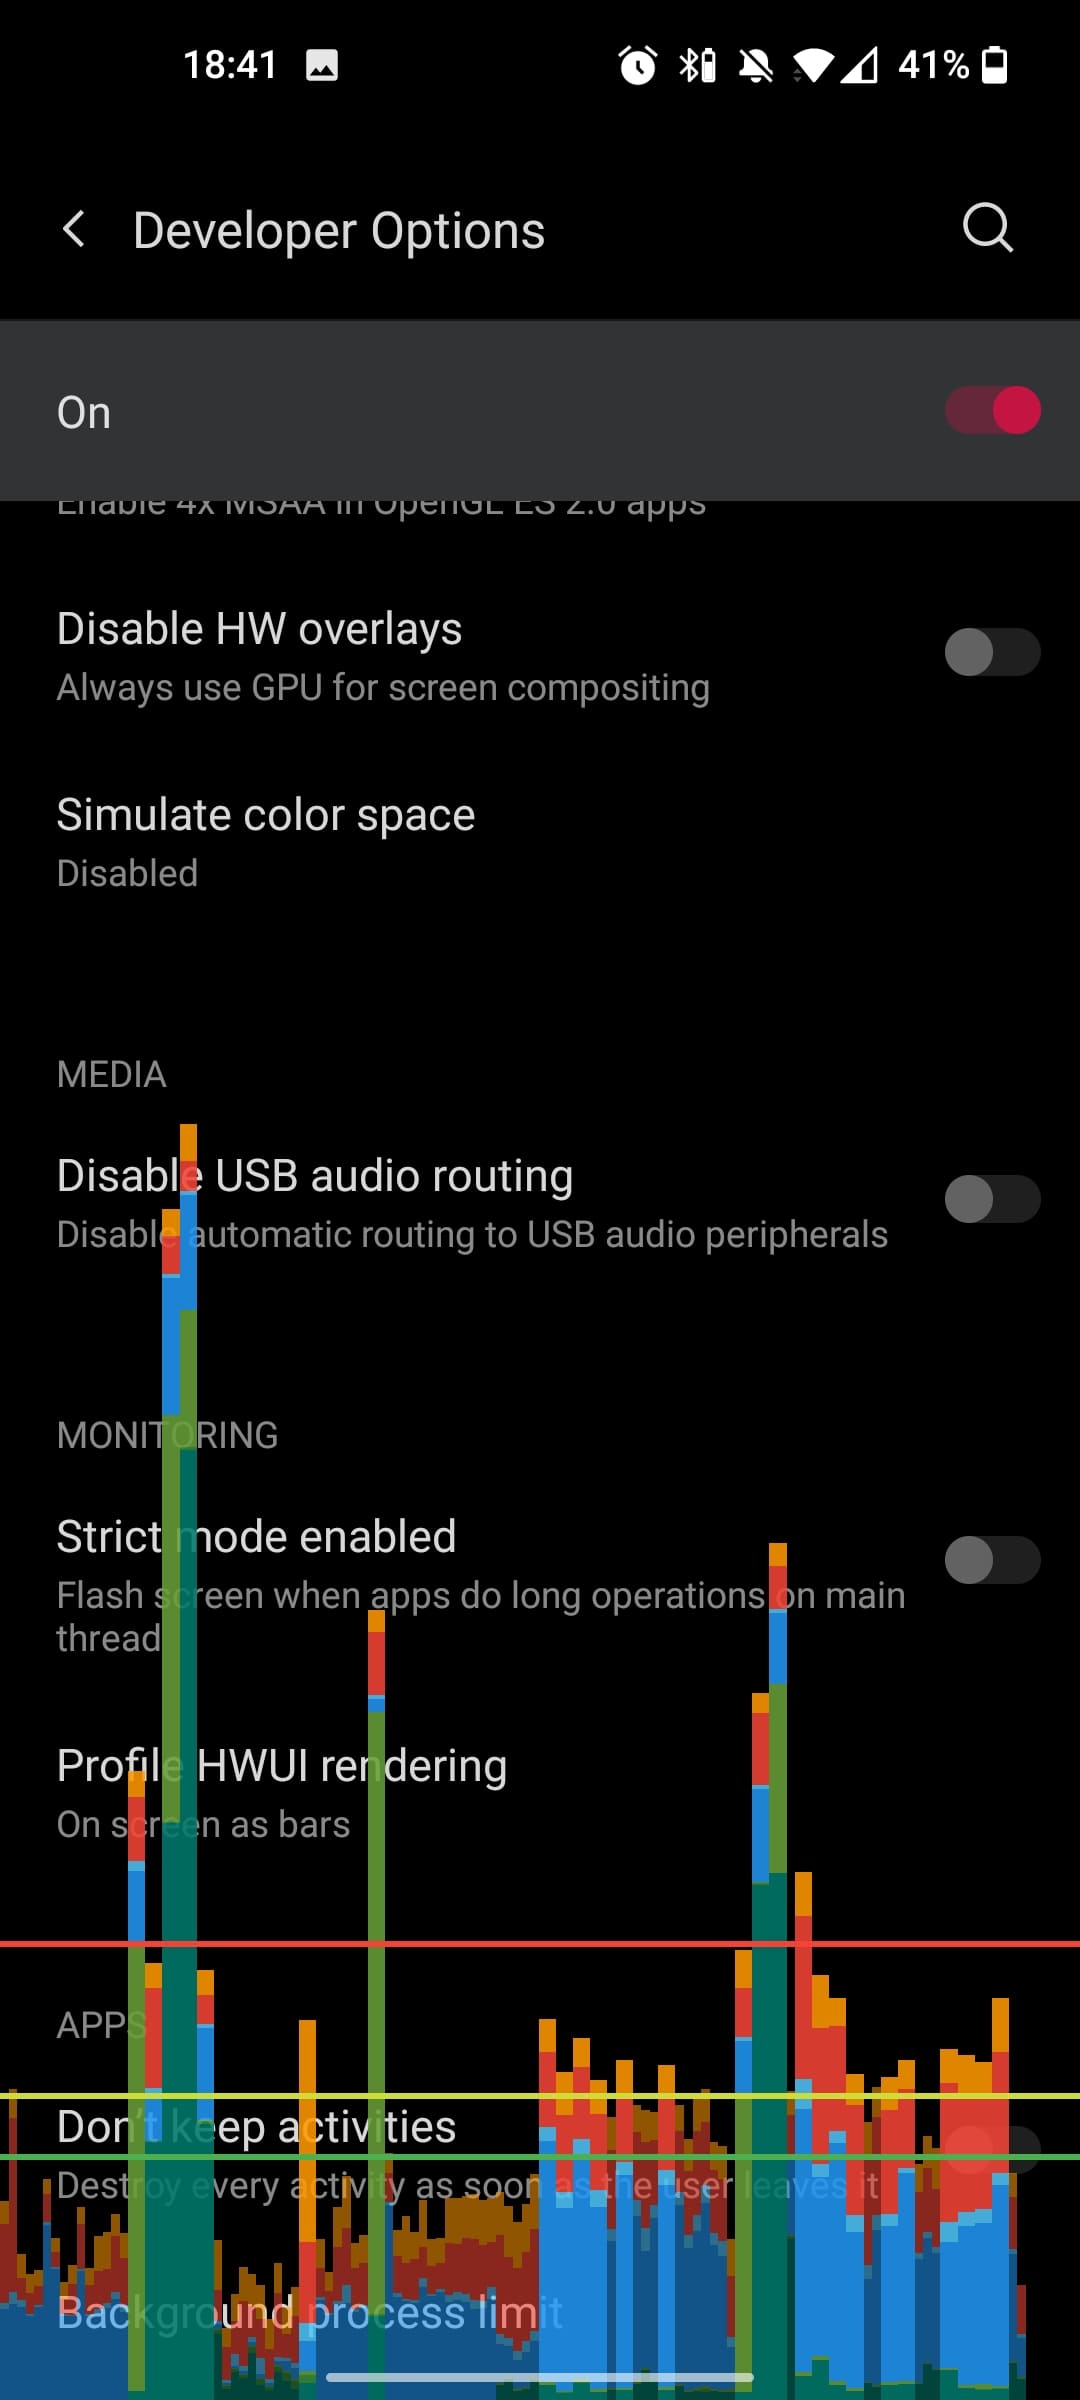
In order to check the rendering speed of your interface, it is not necessary to place logs everywhere. Android has standard methods for frontend performance testing. You can enable it in the developer settings on your phone: the option you need is “Profile GPU rendering” or “Profile HWUI rendering”. For a visual representation, select On screen as bars. Everything below the green line fits in the limit of 16 ms.
Optimizing layout
The more times we redraw the same pixel, the worse the performance, right? This can happen when there are too many embedded groups and elements in the layout. For example, first, the background is drawn, then the background of the card on top of it, then the element itself. Overdraw is unavoidable sometimes, but it has to be kept at a minimum. The more elements — the worse.
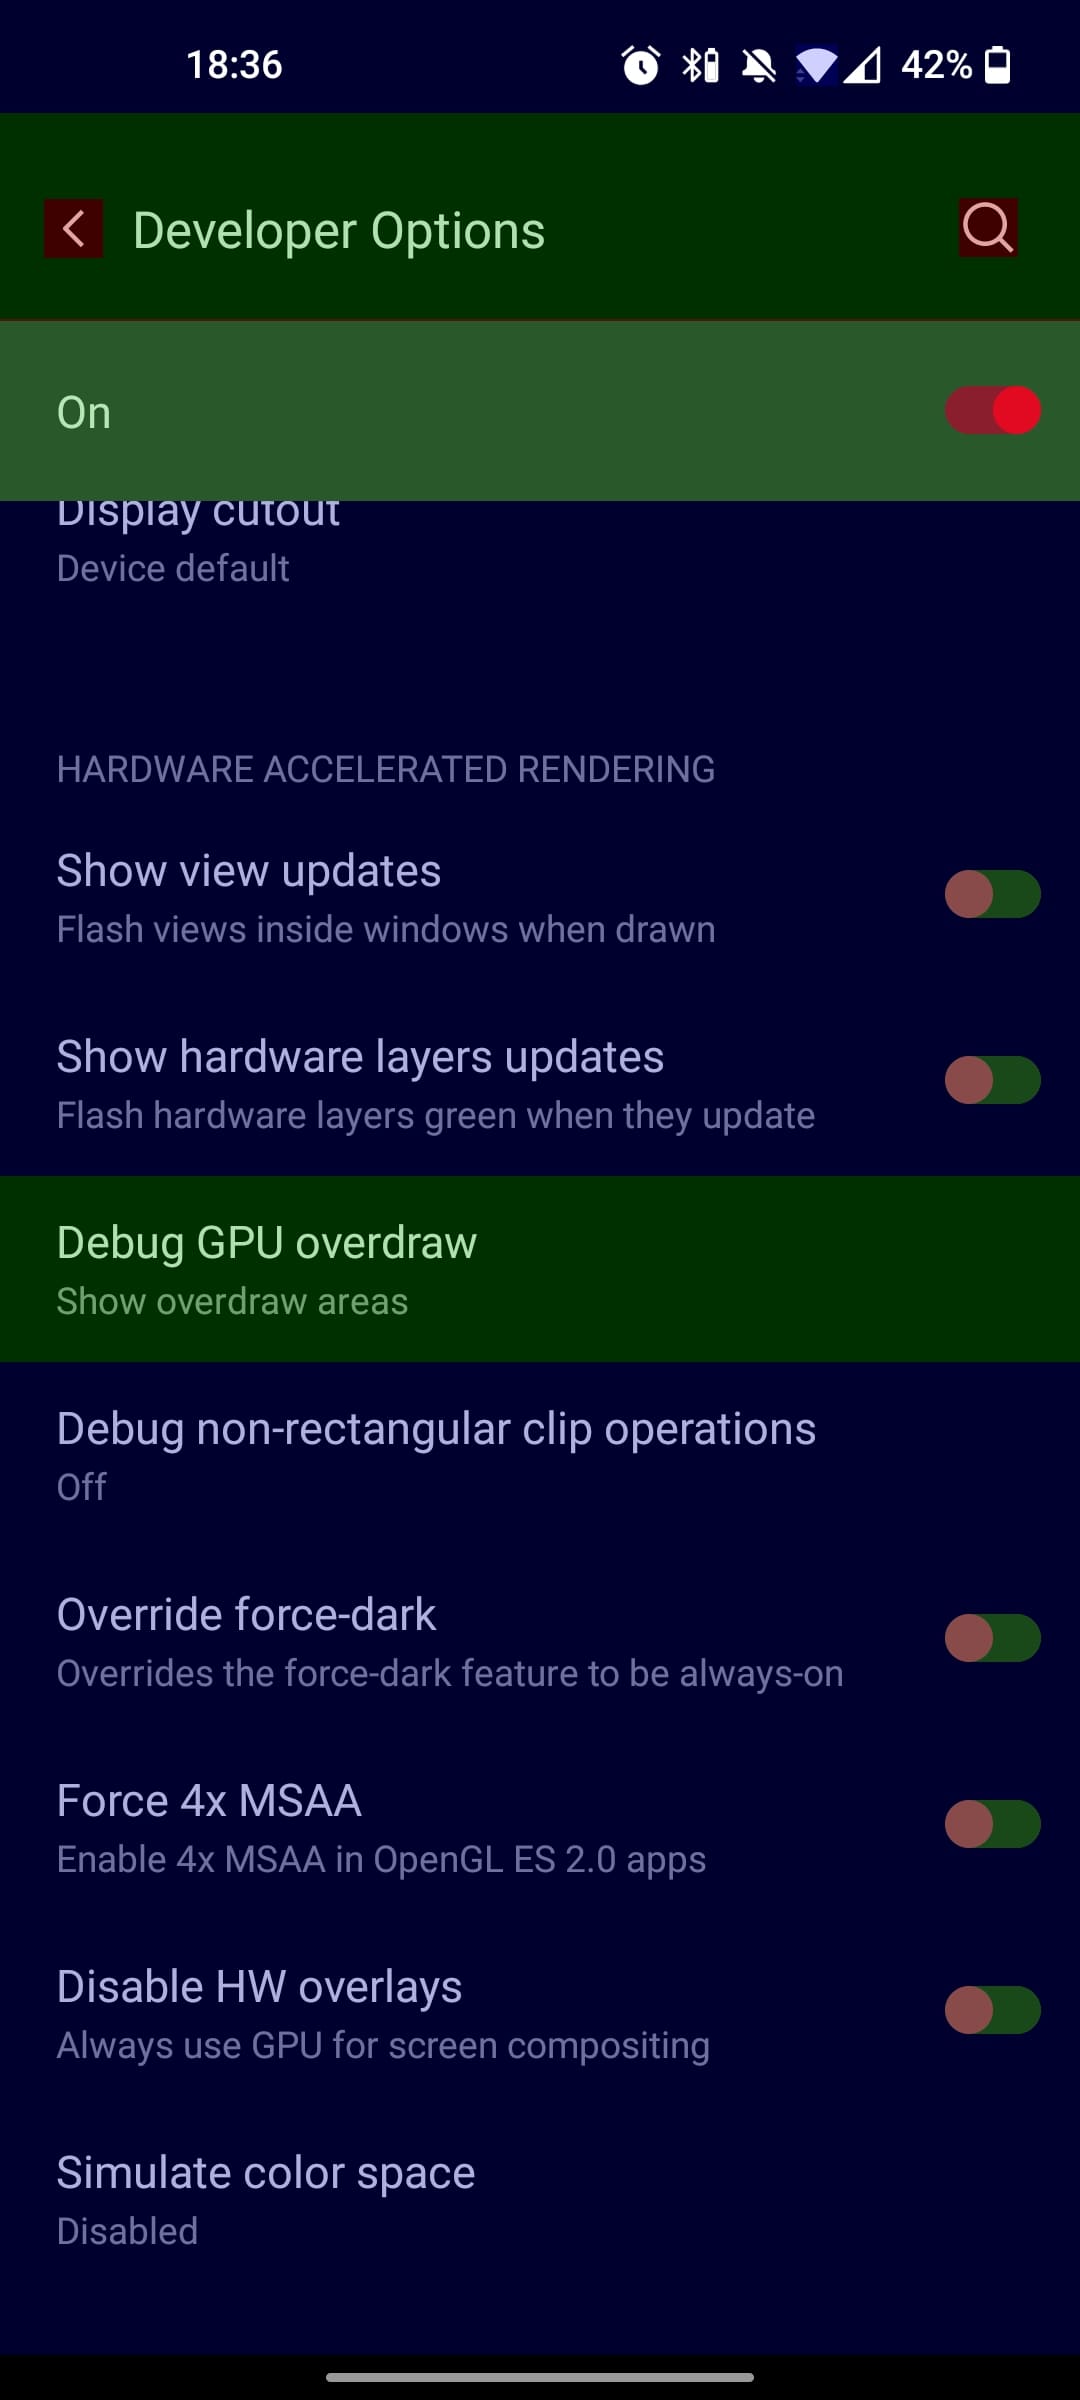
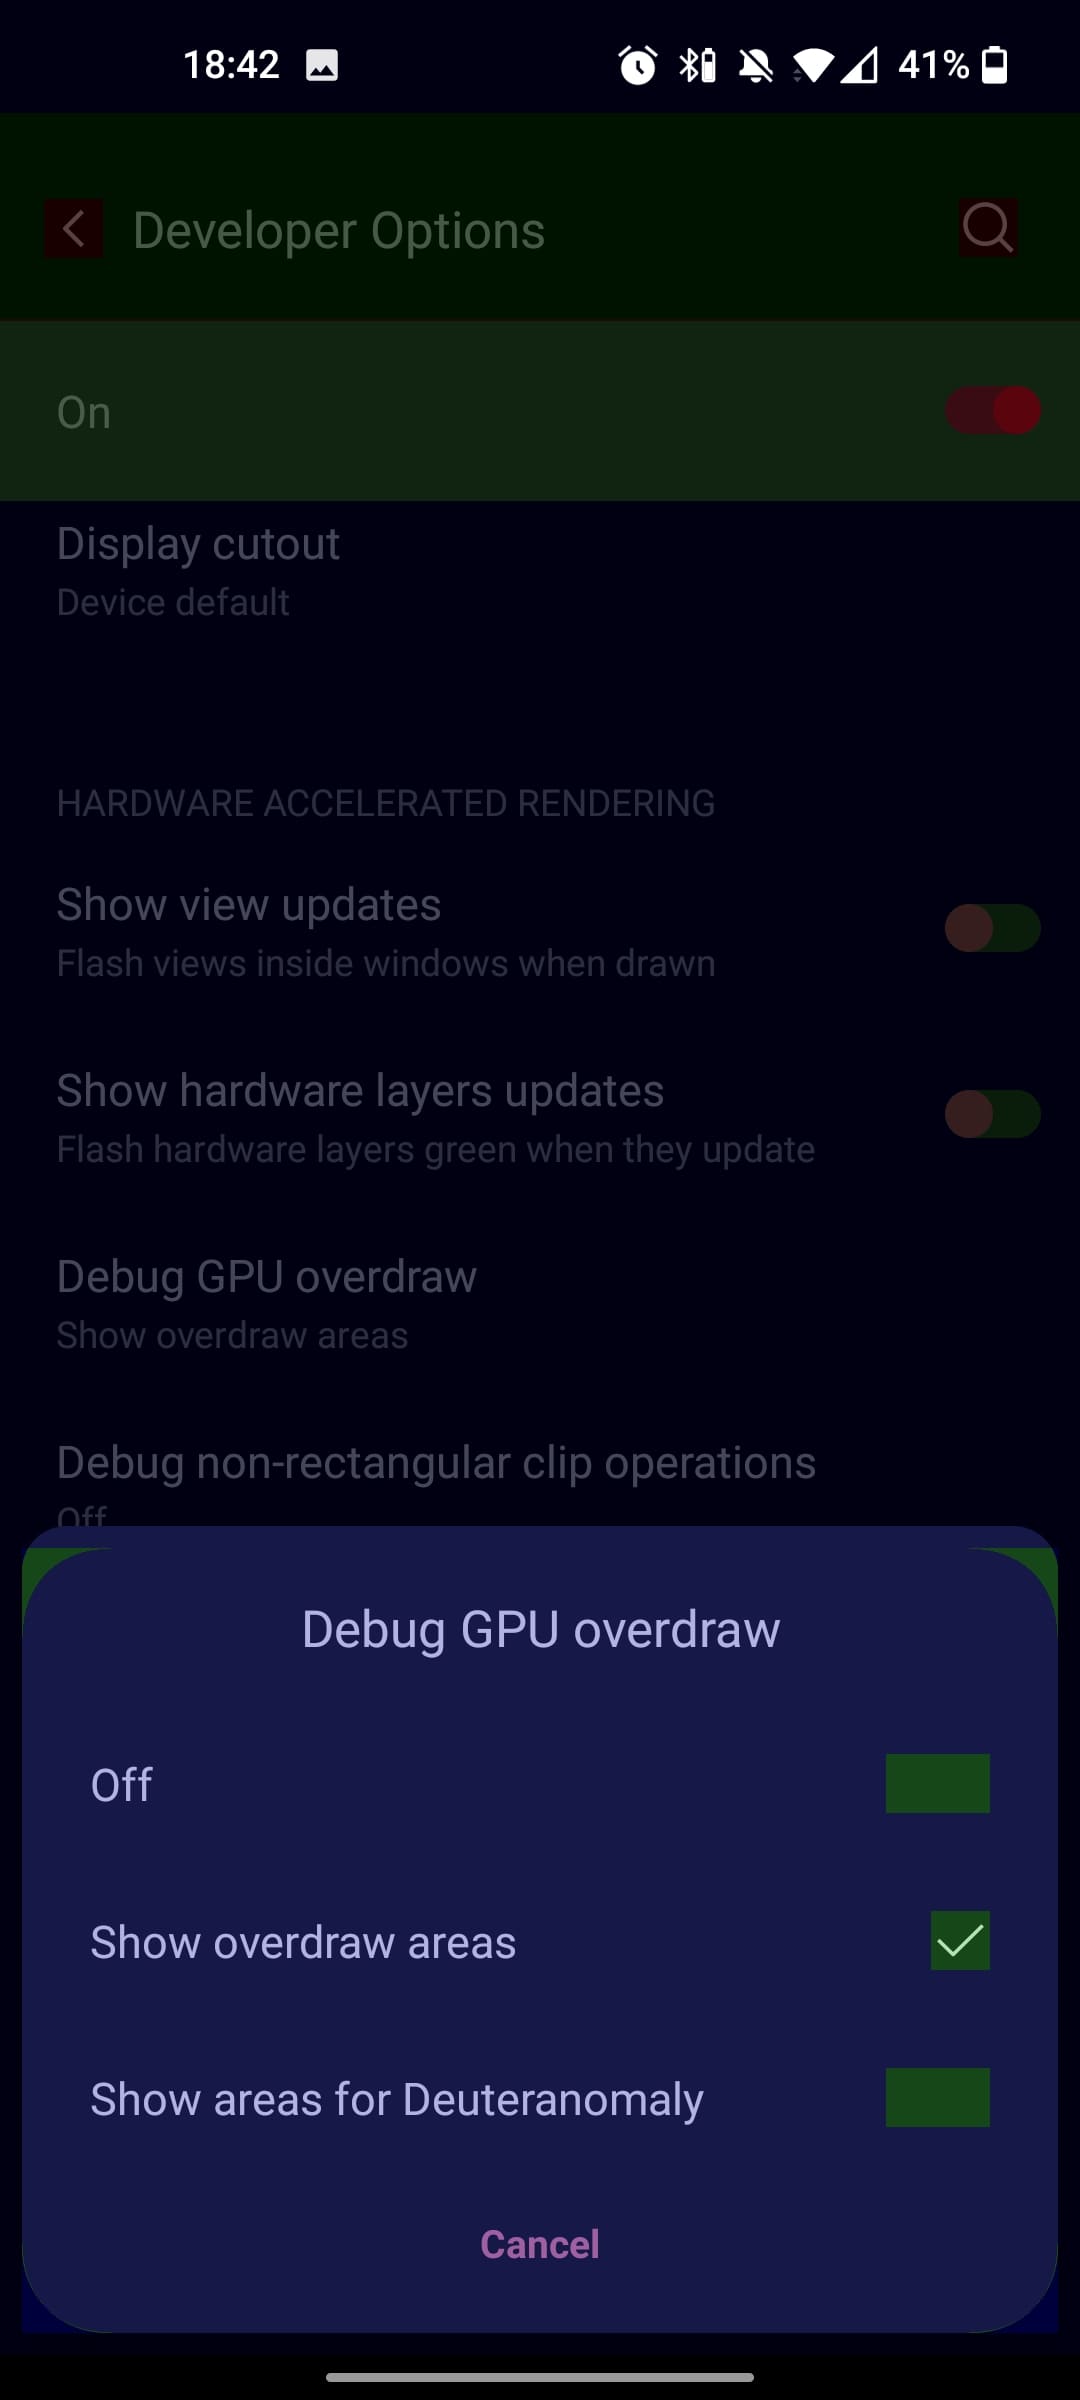
You can view the overlays by enabling Debug GPU Overdraw in the developer options on the device.
Go to Settings -> Developer Options -> Debug GPU overdraw -> Show overdraw areas. Once you enable it, the screen starts showing colors, don’t worry it is the expected behavior.
These simple steps listed above will give you some idea of performance problems in your Android application. To deal with them, read our articles on the types of testing services for mobile app owners, or request a free demo to use one of the best load testing tools – PFLB.
Some of our 400+ engineers will be happy to share their experience of performance and load testing for mobile apps and help you keep your end users happy. At least they have helped our 300+ enterprise clients we’ve had since 2008.